• Keine Ergebnisse gefunden

Air quality in the Cologne Conurbation - high-resolution spatiotemporal biomonitoring

N/A
N/A
Protected

Academic year: 2021

Aktie "Air quality in the Cologne Conurbation - high-resolution spatiotemporal biomonitoring"

Copied!
232
0
0

Wird geladen.... (Jetzt Volltext ansehen)

Volltext

(1)

Air quality in the Cologne Conurbation - high-resolution spatiotemporal biomonitoring

I n a u g u r a l - D i s s e r t a t i o n

zur

Erlangung des Doktorgrades

der Mathematisch-Naturwissenschaftlichen Fakultät

der Universität zu Köln

vorgelegt von

Eva Lehndorff

aus Kaiserslautern

2008

(2)

Berichterstatter: Prof. Dr. Lorenz Schwark

Prof. Dr. Yaping Shao

Tag der letzten mündlichen Prüfung: 20.05.2008

(3)
(4)

Abstract

Atmospheric quality assessment for the Greater Cologne Conurbation, NW-Germany, has been conducted by pine needle (Pinus nigra) biomonitoring at high spatiotem- poral resolution of 71 samples per 3600 km 2 . Prior to analysis and interpretation of spatial variability trends, the systematic and predictable accumulation of a set of air pollutants on pine needles was verified. Air pollutants were investigated using optical determination, major and trace element concentration, enviromagnetic properties and polycyclic aromatic hydrocarbon (PAH) distribution in pine needles. The multiproxy approach allowed for substantially improved source reconciliation. On the regional scale it revealed lignite combustion in power plants to be the dominant emitter of PAH and blow-out from open pit lignite mines to dominate the fine particulate emissions.

On local scale, traffic emissions in the inner city of Cologne were identified as major

pollution source. Traffic emissions though difficult to separate from industrial contri-

butions could be differentiated by trace element indicators, in particular antimony and

by specific PAH, e.g. cyclopenta[cd]pyrene. Atmospheric pollution biomonitoring is of

paramount importance to local population due to the increasing number of reports on

detrimental health effects. In order to guide industrial and political decision makers

when establishing environmental control measures, spatially highly resolved data sets

of atmospheric quality are mandatory for science-based decision making. Active air

quality measurements are too budget and time-intensive to build the base for such de-

cisions. The time-integrated image of air quality derived from biomonitoring at current

provides the best suited approach for regional air quality management.

(5)

Zusammenfassung

Eine Beurteilung der Luftqualit¨ at im Ballungsraum K¨ oln, NW-Deutschland wurde mittels Anwendung eines Biomonitoringansatzes unter Verwendung von Nadeln der Schwarzkiefer (Pinus nigra ) unter hoher raumzeitlicher Aufl¨ osung von 71 Standorten

¨

uber 3600 km 2 durchgef¨ uhrt. Vor der Analyse und Interpretation r¨ aumlicher Varia-

tionsgradienten wurde die systematische Akkumulation einer Suite von Luftschadstof-

fen auf Kiefernnadeln verifiziert. Luftschadstoffe auf Kiefernnadeln wurden analysiert

unter der Anwendung optischer Methoden, Haupt- und Spurenelementverteilungen,

umweltmagnetischer Eigenschaften und der jeweiligen PAH-Signaturen. Der gew¨ ahlte

Multiproxy-Ansatz erm¨ oglichte eine substantiell verbesserte Quellenzuweisung der Luft-

schadstoffe. Auf regionaler Ebene wurde die PAH-Emission aus der Verbrennung von

Braunkohle zur Stromerzeugung als dominanter Prozess identifiziert, w¨ ahrend die Be-

lastung durch Feinst¨ aube in der Region von Auswehungen aus Braunkohletagebauen

gepr¨ agt war. Auf lokaler Ebene wurden in der Innenstadt K¨ olns Verkehrsemissionen

als Hauptquelle der Luftverunreinigung identifiziert. Verkehrsemissionen lassen sich

nur schwer von denen der Industrie trennen, konnten aber von diesen auf der Basis

von Spurenelementindikatoren, pr¨ aferentiell der Antimonkonzentration, oder anhand

diagnostischer PAH wie Cyclopenta[c,d]pyren unterschieden werden. Das Biomonitor-

ing atmosph¨ arischer Schadstoffe ist infolge der zunehmenden Berichte ¨ uber Gesund-

heitssch¨ adigungen f¨ ur die lokale Bev¨ olkerung von entscheidender Bedeutung. Um in-

dustriellen und politischen Entscheidungstr¨ agern eine Grundlage f¨ ur die Etablierung

von Massnahmen zur Luftqualit¨ atsverbesserung zur Verf¨ ugung zu stellen, sind raum-

zeitlich hochaufl¨ osende Datens¨ atze f¨ ur eine wissensbasierte Entscheidungsfindung un-

verzichtbar. Aktive Luftqualit¨ atsanalysen sind zu zeit- und kostenintensiv, um eine

Basis solcher Entscheidungen zu bilden. Die zeitintegrierende und damit hochrepr¨ a-

sentative Luftqualit¨ atsanalyse ¨ uber Biomonitoring bildet zur Zeit den bestgeeignetsten

Ansatz f¨ ur regionales Luftmanagement.

(6)
(7)

CONTENTS I

Contents

1 Introduction 3

1.1 Problem definition . . . . 3

1.2 Aims and scope . . . . 4

1.3 State of the art . . . . 5

1.4 Study area . . . . 6

1.4.1 Topography . . . . 6

1.4.2 Climate . . . . 6

1.4.3 Soil . . . . 7

1.4.4 Land use and emission scenarios . . . . 7

2 Pollutant accumulation on Pinus nigra needles 9 2.1 Accumulation histories of magnetic particles . . . . 9

2.1.1 Sampling methods . . . . 10

2.1.2 Analytical Methods . . . . 11

2.1.3 Results . . . . 13

2.1.4 Discussion . . . . 20

2.1.5 Conclusions . . . . 25

2.2 Accumulation histories of major and trace elements . . . . 26

2.2.1 Sampling methods . . . . 27

2.2.2 Analytical Methods . . . . 27

2.2.3 Results . . . . 28

2.2.4 Discussion . . . . 32

2.2.5 Conclusions . . . . 38

2.3 Accumulation history of airborne phenanthrene derivatives . . . . 39

2.3.1 Sampling . . . . 42

2.3.2 Analytical Methods . . . . 42

2.3.3 Results . . . . 43

2.3.4 Discussion . . . . 47

2.3.5 Conclusions . . . . 53

3 Cologne City - local-scale biomonitoring 54 3.1 Cologne City air quality - optical and magnetic properties . . . . 54

3.1.1 Sampling . . . . 55

3.1.2 Analytical methods . . . . 57

3.1.3 Results . . . . 58

3.1.4 Discussion . . . . 63

3.1.5 Conclusions . . . . 66

3.2 Cologne City air quality - major and trace elements . . . . 67

3.2.1 Sampling . . . . 69

3.2.2 Analytical methods . . . . 69

3.2.3 Results and discussion . . . . 70

3.2.4 Summary and Conclusions . . . . 78

3.3 Cologne City air quality - polycyclic aromatic hydrocarbons (PAH) . . 78

3.3.1 Sampling . . . . 79

(8)

II CONTENTS

3.3.2 Methods . . . . 80

3.3.3 Results and discussion . . . . 81

3.3.4 Summary and Conclusions . . . . 91

4 Cologne Conurbation - regional-scale biomonitoring 94 4.1 Cologne Conurbation air quality - enviromagnetic proxies . . . . 94

4.1.1 Sampling . . . . 94

4.1.2 Analytical methods . . . . 95

4.1.3 Results . . . . 95

4.1.4 Discussion . . . . 97

4.1.5 Conclusion . . . 100

4.2 Cologne Conurbation air quality - major and trace elements . . . 101

4.2.1 Sampling methods . . . 101

4.2.2 Analytical methods . . . 101

4.2.3 Results . . . 102

4.2.4 Discussion . . . 105

4.2.5 Conclusions . . . 116

4.3 Cologne Conurbation air quality - parent PAH . . . 117

4.3.1 Sampling . . . 117

4.3.2 Analytical methods . . . 118

4.3.3 Results . . . 119

4.3.4 Discussion . . . 125

4.3.5 Conclusions . . . 137

4.4 Cologne Conurbation air quality - parent and alkylated three-ring PAH 138 4.4.1 Sampling . . . 139

4.4.2 Analytical methods . . . 139

4.4.3 Results and Discussion . . . 140

4.4.4 Conclusions . . . 146

4.5 Cologne Conurbation air quality - a synthesis . . . 146

4.5.1 Sampling and Analysis . . . 147

4.5.2 Results . . . 147

4.5.3 Discussion . . . 152

4.5.4 Conclusion . . . 159

5 Synthesis and outlook 160

Appendix 212

(9)

LIST OF FIGURES III

List of Figures

1 Topography and soils of the Cologne Conurbation. . . . 6

2 Land use and emission characteristics of the Cologne Conurbation. . . . 7

3 Land use and locations of temporally-resolved sample set in the Cologne Conurbation . . . . 10

4 Biplots of physiological versus enviromagnetic properties. . . . 14

5 Electron microprobe scan of needle surface. . . . 15

6 Mineral and grain size diagnostic enviromagnetic parameters . . . . 16

7 Magnetic concentration parameters on pine needles in the Cologne Conur- bation . . . . 18

8 Temporal accumulation trends of magnetic parameters. . . . 19

9 Variations of enviromagnetic grain size and oxidation parameters versus time. . . . 21

10 Schematic diagram displaying hypothetical end-member grain size dis- tribution curves . . . . 24

11 Element concentrations of Pinus nigra needles versus exposure time. . . 29

12 Element enrichment factors for summer and winter samples. . . . 32

13 Element enrichment factors of pine needles versus exposure time. . . . . 33

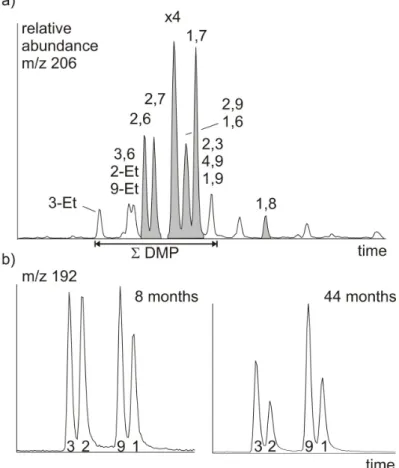
14 Identification of dimethylphenanthrenes . . . . 43

15 PAH-3 concentrations versus needle exposure time. . . . 48

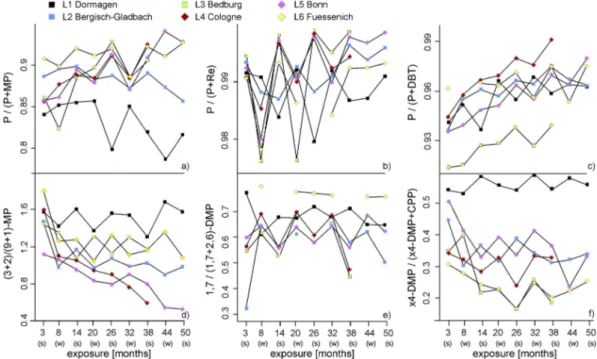
16 Phenanthrenes ratios versus needle exposure time. . . . 51

17 Land use and sampling sites in Cologne City. . . . 56

18 SEM and microprobe analysis of pine needle surfaces. . . . 57

19 Sample treatment: cleaning with water and organic solvents. . . . 60

20 Correlation of iron and magnetite concentration of pine needles. . . . . 60

21 High temperature susceptibility curve. . . . . 61

22 Magnetic properties of pine needles in Cologne City. . . . 62

23 Grain-size effects on susceptibility and ARM analysis. . . . 63

24 Seasonal changes in enviromagnetic properties of needles. . . . 64

25 Enviromagnetic isopleths maps of Cologne City, I . . . . 65

26 Enviromagnetic isopleths maps of Cologne City, II . . . . 66

27 Trace element concentration ranges of pine needles in Cologne City. . . 70

28 Trace element and sulfur concentrations of pine needles in Cologne City. 72 29 Seasonal variations of elements on a pine in Cologne City. . . . 74

30 Annual variations of elements in pine needles in the D¨ ubener Heath, NE-Germany. . . . 75

31 Biplots of traffic pollution proxy iron against lead, cadmium and zinc. . 76

32 Isopleths maps of Cd and Pb in Cologne City . . . . 77

33 Generalized model of PAH transportation and deposition. . . . 80

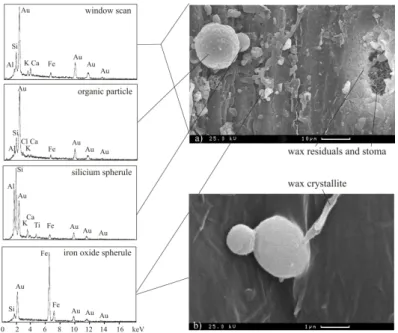
34 SEM scans of Pinus nigra needle surfaces. . . . 82

35 Seasonal variation in wax and PAH content of pine needles. . . . 83

36 Relation between wax content and total PAH load of pine needles. . . . 86

37 PAH distribution profiles of pine and spruce needles. . . . . 88

38 Bivariance plots of selected PAH ratios. . . . 89

39 Correlation of a magnetic concentration parameter to pyrene. . . . 90

(10)

IV LIST OF TABLES 40 Isopleths maps of PAH concentrations and isomer ratios in Cologne City. 92 41 Enviromagnetic properties on pine needles in the Cologne Conurbation. 97

42 Isopleths maps of enviromagnetic proxies in the Cologne Conurbation. . 99

43 Element enrichment (EF) on pine needles in the Cologne Conurbation. 105 44 Elements of geogenic origin in the Cologne Conurbation. . . 108

45 Elements attributed to local geogenic sources and mineralic input. . . . 109

46 Elements attributed to traffic emissions. . . . 112

47 Elements attributed to industrial emissions. . . . 113

48 Elements attributed to municipal waste incineration. . . . 115

49 Accumulation trends of PAH on pine needles in the Cologne Conurbation.126 50 Isopleths maps of PAH on pine needles in the Cologne Conurbation. . . 128

51 Spatial distribution of Ip, BeP, BbjFla, Py, BaA, and CpcdPy in the Cologne Conurbation. . . 130

52 Trends of PAH ratios versus time of needle exposure. . . 134

53 Bivariance plots of source indicative PAH. . . 136

54 Isopleths maps of PAH ratios. . . 137

55 Locations, emission characteristics and spatial analyses of PAH-3 in the Cologne Conurbation. . . 142

56 Biplots of selected phenanthrenes concentrations. . . . 143

57 Bivariance plots of PAH, elements and enviromagnetic proxies. . . 151

58 Pollutant distribution characteristic for urban emissions. . . 154

59 Pollutant distribution characteristic for lignite combustion and geogenic dust. . . 156

60 Pollutant distribution characteristic for waste incineration and industrial emissions. . . 158

61 Molecular structure of parent and alkylated PAH . . . 191

62 Land use and emission characteristics of the Cologne Conurbation (trans- parency). . . 218

List of Tables 1 Emission scenarios in the Cologne Conurbation . . . . 11

2 Statistical analyses of enviromagnetic parameters . . . . 12

3 Spearman’s rank correlation of enviromagnetic and plant physiological parameters. . . . 13

4 Weighted means of element concentrations on pine needles. . . . 30

5 Kruskal-Wallis-H test for major and trace elements. . . . 30

6 Element enrichment factors. . . . 31

7 Factor analyses of major and trace element EFs. . . . 35

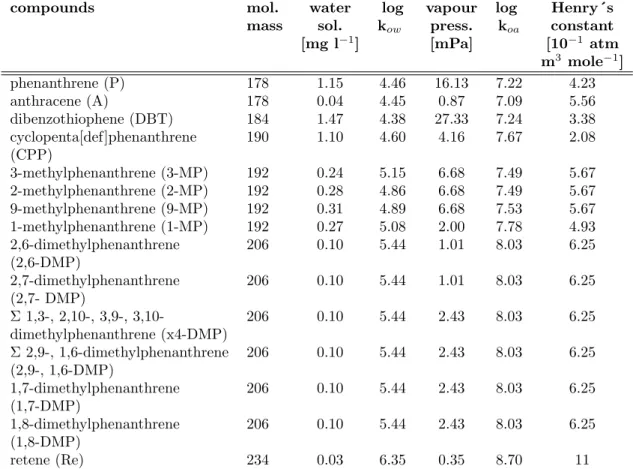
8 Physico-chemical properties of PAH-3. . . . . 41

9 Statistics of PAH acccumulation on pines. . . . . 45

10 Linear regression parameters for PAH-3 versus time. . . . 45

11 Compilation of trace element data for pine needles. . . . 71

12 Compilation of PAH biomonitoring data for pine needles. . . . 85

(11)

LIST OF TABLES V 13 Source diagnostic potential of enviromagnetic biomonitoring in the Cologne

Conurbation . . . 100

14 Element loads on pine needles in the Cologne Conurbation. . . 102

15 Factor analyses of element loads on pine needles in the Cologne Conur- bation. . . 104

16 Sources for major and trace elements in the Cologne Conurbation. . . . 116

17 Abbreviations and classification of PAH. . . 118

18 Statistics of PAH accumulation on pine needles. . . 120

19 PAH median concentrations on pine needles in the Cologne Conurbation. 121 20 Factor analysis of PAH concentrations on pine needles in the Cologne Conurbation. . . . 131

21 Source diagnostic potential of PAH biomonitoring in the Cologne Conur- bation. . . 138

22 Factor analysis of PAH-3 concentrations on pine needles. . . 140

23 Source diagnostic compounds and proxies established on pine needles in the Cologne Conurbation. . . . 148

24 Spearman´s rank correlation of organic, inorganic and enviromagnetic air quality proxies. . . 150

25 Abbreviations . . . 190

26 Enviromagnetic and physiological parameters, temporal study, I . . . . 192

27 Enviromagnetic and physiological parameters, temporal study, II . . . . 193

28 Enviromagnetic and physiological parameters, temporal study, III . . . 194

29 Averaged magnetic properties for sampling sites . . . 195

30 Mean, medians and standard deviation of magnetic properties . . . 196

31 Enviromagnetic and physiological parameters for each needle cohort . . 197

32 Major and trace element concentrations temporal study . . . 198

33 Enrichment factors (EF), temporal study . . . 199

34 Concentration of 3-ring PAH on pine needles, temporal study . . . 200

35 Enviromagnetic parameters on pine needles in the Cologne Conurbation. 201 36 Major and trace element concentrations and enrichment factors (EF) on pine needles in the Cologne Conurbation (data sheet 1-10). . . 202

37 Major and trace elements in the Cologne Conurbation, II . . . 203

38 Major and trace elements in the Cologne Conurbation, III . . . 204

39 Major and trace elements in the Cologne Conurbation, IV . . . 205

40 Major and trace elements in the Cologne Conurbation, V . . . 206

41 Major and trace elements in the Cologne Conurbation, VI . . . 207

42 Major and trace elements in the Cologne Conurbation, VII . . . 208

43 Major and trace elements in the Cologne Conurbation, VIII . . . 209

44 Major and trace elements in the Cologne Conurbation, IX . . . 210

45 Major and trace elements in the Cologne Conurbation, X . . . 211

46 Parent PAH on pine needles of different age needle age, sheet I. . . . . 212

47 Parent PAH on pine needles of different age needle age, sheet II. . . 213

48 Parent PAH in Pinus nigra needles of the Cologne Conurbation, I. . . . 214

49 Parent PAH in Pinus nigra needles of the Cologne Conurbation, II. . . 215

50 Three-ring PAH in Pinus nigra needles of the Cologne Conurbation, I. . 216

51 Three-ring PAH in Pinus nigra needles of the Cologne Conurbation, II. 217

(12)
(13)

3

1 Introduction

1.1 Problem definition

Air is regarded an essential commodity, mandatory for all human beings and its com- position and changes thereof will globally affect the entire system Earth. Increasing awareness of this fundamental role of the atmosphere for mankind is well documented by the broad public interest in global or climate change issues [99]. The attention paid to global-scale atmospheric quality issues, however, should not lead to neglecting air quality problems occurring on national or even smaller scale levels. Despite its ele- mental function for human life, air quality today is under threat on local and regional scales and thus deserves monitoring and protection. This study aims at a compre- hensive characterisation of air quality in the Cologne area of NW-Germany using two different scaling approaches, a local and a regional level of investigation. A need for action to improve air quality was perceived in the 1960s by the public and by political organization that lead to world-wide legislative engagement. International conventions on transboundary atmospheric pollutant transport were established in 1979. In Ger- many the regulation of traffic and industrial emissions started in 1976, mainly with a focus on sulphur and nitrogen oxides which lead to ”acid rain” and its detrimental effects on vegetation and human health. A further major incentive of that time was di- rected towards minimization of traffic related lead emission that ultimatively lead to a complete lead-additive ban for petrol. Several German and other national actions were followed by EU-wide directives in the 1980s. Today, many European cities actively regulate traffic, to keep urban air within limits set in particular for fine particulates.

This goal often can only be met by restricting traffic density, i.e. issuing driving bans in total or for selected vehicle types. In Germany citizens can hold their cities re- sponsible for air quality, as supported by a legislative decision in 2007 [219]. However, environmental regulations only focus on the monitoring and reduction of a small set of pollutants that firstly are known to have the most severe health effects. Secondly, however, pollutants subjected to monitoring often are selected based on the easiness of, mostly continuous, analytical measurement thus neglecting compounds of adverse health effects that can only be determined using more sophisticated, time-consuming and costly techniques.

Despite of these shortcomings, active monitoring methods have been established

that are cost-intensive and require continous maintenance. Because of the high associ-

ated costs, monitoring is often spatially limited to regions of known high anthropogenic

emissions, e.g. inner city streets with high traffic density or municipal waste incinerator

sites. The advantage of active air sampling lies in the detection of absolute concentra-

tions of pollutants in air. Exposure to such concentrations can be directly transformed

into risk assessment for human health. The atmosphere comprises an extremely dy-

namic system characterized by sudden but mostly temporally limited occurrences of

peak values that can only be detected by such active air measurements on a scale level

of minutes or hours. Due to the massive efforts required and for budgetary reasons,

permanent and spatially highly-resolved monitoring of atmospheric quality using active

air sampling, however, is prohibited and alternative approaches have been developed

and partly implemented. One major approach is the numerical modelling of atmo-

(14)

4 1 INTRODUCTION spheric pollution [107], a technique mainly successful for prediction of behaviour of atmospheric gases. A second approach utilizes the advantages of passive sampling of atmospheric pollutants. The cost-effective passive samplers bear the potential for high spatial resolution in combination with acquisition of time-integrated pollution signals, covering exposure periods of days to months or even years. In particular, the use of bioreceptors as air quality indicators has an unlimited spatial potential, covering pol- lution episodes that are reflecting a long-time exposure of citizens to the surrounding environment. European environmental organizations and the United States Environ- mental Protection Agency have designed lists of priority pollutants, building the base for environmental regulations referred to as EPA list and the EFSA list. Until now mon- itoring standards are based on the EPA list, but an expansion is highly recommended.

Today, toxidity equivalence factors (TEF) are used to classify health affecting pollu- tants. In the case of the potentially carcinogenic compound class of polycyclic aromatic hydrocarbons (PAH), the lead compound benzo[a]pyrene was assigned a TEF value of 1, to which other components are normalized. This approach is superior to simple concentration analyses as for example the PAH dibenz[a,h]pyrene was assigned a TEF

= 10. Though the PAH chrysene reveals a TEF of only 0.01, its methylated analogue 5-methylchrysene is given a TEF of 1.0, equivalent to the toxicity and carcinogeneity of benzo[a]pyrene [238]. The use of TEF thus allows establishing more adequate risk exposure assessments.

1.2 Aims and scope

This atmospheric quality study was conducted on two scale levels, a local one covering the City of Cologne, and a regional one, compassing the Greater Cologne Conurbation, comprising 3600 km 2 . Both areas are subject to multiple emission sources. The study is based on a spatially high resolved biomonitoring set, to investigate long-term average air quality. A multi-proxy analysis of organic and inorganic pollutants and particulate matter fractions (PM 10 , PM 2.5 ) is employed comprising compounds included in the US EPA list and additional pollutants with high source characteristic potential and high TEF [24]. Needles from robust and evergreen Pinus nigra trees were chosen as bioreceptors due to the high spatial availability in the Greater Cologne Conurbation.

At first, the study addresses the systematic accumulation behaviour of pollutants on

Pinus nigra needles. This is followed by a detailed description of pollutant dispersal

and sources in i) Cologne City, an area of heterogeneous urban emission mixes, and ii)

the Greater Cologne Conurbation with additional and spatially differentiated emission

sources. Reliable source identification and allocation for various pollutants was based

on three different approaches: i) statistical treatment, in particular factor analyses to

unravel contribution from different sources, ii) relation of pollutant patterns to known

specific emitters, and iii) construction of isopleths maps for pollutant concentration or

diagnostic pollutant ratios using a GIS-software. The suite of atmospheric pollution

indicators included in the investigation scheme encompasses environmental-magnetic

properties, major and trace element composition, and concentrations of polycyclic aro-

matic hydrocarbons on pine needles. The combination of independent air quality in-

dicators in conjunction with spatial high-resolution biomonitoring provides a powerful

tool for identification of problem areas, potential emitters, and dispersal pathways of

(15)

1.3 State of the art 5 atmospheric pollutants in a time-integrative manner that can serve the public, politi- cians, and industrial decision makers to improve environmental health regulation.

1.3 State of the art

The scientific record of air pollution considering fine to ultrafine particulate matter (PM 10 , PM 2.5 ), major and trace elements, and pollution with carcinogenic organics started in the 1980s [77, 229, 198, 178]. Pollutant capture and analysis was mostly achieved by high volume active air sampling, allowing for a sampling of PM and as- sociated material on filters of specific diametre (PM 10 , PM 2.5 ) or a direct analysis of pollutants in the gas phase, often in real-time mode employing spectroscopic methods.

For a minimization of maintenance and purchasing costs, and a simultaneously rising potential of a spatially high resolved documentation of pollutant dispersal, passive sam- pling devices and biomonitoring techniques were established [11, 185]. Often lichens and mosses have been used as bioreceptor for air pollutants, but they are relatively sen- sitive to environmental stress and do not appear in heavily polluted areas [11]. Thus, less sensitive plants were investigated for their use as bioindicators. A biomonitoring approach considering pollutant uptake via the food chain concentrates on the analyses of vegetables [61, 142], and is mainly focussed on heavy metal deposition and up- take. Several studies deal with pollutant uptake of plants, being of critical importance for mobile and essential trace elements [11, 142] and volatile (VOC) or semi-volatile organic compounds [233, 149, 105, 266]. As a result several uptake models were es- tablished covering equilibrium conditions preferrentially for gaseous pollutants, a two- compartment model and models based on bidirectional exchange between vegetation and atmosphere including active participation of the vegetation [105, 266]. Uptake and atmospheric concentration of semivolatile organic pollutants utilizing coniferous trees was investigated with a special emphasis on source characterisation [77, 231, 233, 115].

Nevertheless, most of the PAH studies are based on the US-EPA list comprising 16

PAH, but miss most toxic and source indicative compounds [168, 56]. Methylated

PAH and attributed parent compounds, e.g. phenanthrenes are highly recommended

for source differentiation purposes [15] as well as the application of source indicative

ratios between single PAH [287]. Enviromagnetic biomonitoring approaches first aimed

at a recognition of coal fired power plants [58] and then considered monitoring of high

traffic areas [91, 223, 160, 161, 156, 147, 137, 222, 284], coal power plants [74], and in-

dustrial emissions [103]. In general, major efforts in biomonitoring of urban pollution

was done in Asia [66, 240], Italy [5, 44, 127, 133, 156], Spain [148, 136], and Poland

[153, 154, 63]. In Sweden, Finland, and UK, large-scale studies covering transects

from heavy pollutant sources to remote areas of about several 100 km were conducted

[249, 200, 241]. The dispersal of gaseous pollutants can be effectively approached by

modelling as previously shown for the Cologne Conurbation by Bruecher et al. [26]. In

contrast spatial distribution patterns of particle-bound and particulate PAH and major

and trace elements can only be achieved via high resolution sampling and subsequent

spatial interpolation. Nevertheless, spatial mapping is rarely utilized in pollutant dis-

persal studies [82, 5, 156, 34], and often compensated by transect studies or factor

analysis [249, 200, 241, 51].

(16)

6 1 INTRODUCTION

1.4 Study area

All pine needle samples were collected in Cologne City and the surrounding Greater Cologne Conurbation (GCC). Most important issues for a biomonitoring study are climatic conditions in terms of pollutant dispersal, deposition and plant physiological aspects, e.g. water availability and substrate. Details that are of importance in the discussion of pollutant sources and dispersal are described where needed in the following chapters. An transparency overlay, provided in the appendix (Fig. 62) shows simplified attributes of the GCC, that are of highest importance for the analysis of air quality.

1.4.1 Topography

The Greater Cologne Conurbation is located in the Lower Rhine Embayment in the north-western part of Germany. The valley of the river Rhine is the most striking morphological feature of the GCC, building out flatly decreasing gravel terrasses into a relatively plain areal to the north-west. Cologne City in the central study area lies on average 50 m a.s.l (Fig. 1). The southern most part of the GCC is tangent to the Eifel mountains with highest elevations of approximately 300 m. To the east the Bergisches Land, part of the Rhenic Massif reaches heights up to 200 m in the sampling area. The Rhine Valley is parted from the plain Zuelpicher Boerde through a local upheaval, the Ville Ridge, tending NW-SE in the central GCC with maximum elevations of 130 m above sea level (Fig. 1). From east to west following river systems occur besides the Rhine. The river Rur drains the SE Eifel mountains and runs north through the town Dueren, parallel the Erft drains the Zuelpicher Boerde in northern direction. In the east the Sieg cuts a relatively steep valley into the Rhenic Massif opening out into the Rhine south of Cologne City.

Figure 1: a) Morphological features of the Cologne Conurbation and local designations, highways were provided for orientation, b) dominant soil types in the Cologne Conurbation.

1.4.2 Climate

Meteorological data of the Greater Cologne Conurbation is provided by the Deutsche

Wetterdienst (DWD). For interpretation of time-integrated pollutant signals on pine

needles in the study area, a yearly average value calculated from 1961 to 1990 is

(17)

1.4 Study area 7 considered to be sufficient to represent the climatic conditions in the GCC. Thus, precipitation given for 18 weather stations in the region is shown to be highest in the eastern Bergisches Land (1000 mm a −1 ), followed by the Rhine Valley with about 800 mm a −1 and lowest precipitation in the western Zuelpicher Boerde (600-700 mm a −1 ). Temperature data reveals on average 10.5 C for the urbanized Rhine Valley and approximately 1 C less in the adjacent areas. Prevailing wind directions in the Greater Cologne Conurbation follow morphological patterns. Thus, the Rhine Valley with cities Bonn, Cologne and Leverkusen are mostly affected by NW-winds, whereas the eastern Rhine Valley and the rise of the Bergisches Land is characterized by upcurrent winds.

In the western Zuelpicher Boerde west winds are dominant [26].

1.4.3 Soil

Soils in the study area show a homogenous pattern reaching from preferentially luvisols in the west of the Rhine Valley to cambisols in the east (Fig. 1). Deposits of loess occur in the western Rhine Valley and lead to a substantial increase in soil nutrition status and agricultural land use, whereas the poorer and sandy soils of the Bergische Land are a perfect substrate for pines. About 10 % of the soils in the GCC are anthropogenic land fills, especially soils in Cologne City and former and active mining areas, which make the estimation of soil influence on biomonitoring difficult.

Figure 2: Land use and emission characteristics of the Cologne Conurbation, simplified according to data from CORINE landcover and the NRW Emission Register [69, 118].

1.4.4 Land use and emission scenarios

The Greater Cologne Conurbation is highly urbanized with Cologne and Bonn City

having 1,300,000 citizens plus inhabitants of 8 smaller towns and rural areas. Alto-

gether, this makes approximately 2,000,000 citizens in the GCC, contributing to air

(18)

8 1 INTRODUCTION quality with domestic heating and traffic activities. In addition, there is substantial shuttle traffic in the rush-hours into and from the highly industrialized Rhine Valley.

This is reflected by a multitude of highways in the GCC, forming a nearly ubiquitous

pattern with two major highways tending S-N, two E-W and a highway ring around

Cologne and Bonn (Fig. 2). Major industrial complexes are found south and north of

Cologne City and in the Sieg Valley. Here, large refineries, municipal waste incinera-

tors and inorganic chemical production sites are located. Most dominant emitters are

listed by the Emission Register NRW [118], above all the lignite fueled power plants

(LFPP) in the north-western part of the GCC. One smaller capacity plant is lying

directly west of the Cologne City limit close to a former open pit mine. The LFPP in

the north-west are spatially attributed to two large open pit minings covering an area

of 100 km 2 . Waste incineration is concentrated on two major plants in the Cologne

Conurbation, located in the north of Cologne and in Bonn with capacities for 590,000

t a −1 and 245,000 t a −1 waste, respectively. Five minor municipal waste incinerators

(MWI) are situated along in the Rhine Valley. Large areas in the south-west are used

as agricultural crop lands, the former lignite area in the Ville Ridge is now charac-

terized by successful forest recultivation zones and the eastern Bergisches Land shows

predominantly forested zones (Fig. 2).

(19)

9

2 Pollutant accumulation on Pinus nigra needles

The use of vegetation surfaces as biomonitors for air quality is dependent on the plants ability of pollutant uptake and capture. Therefore, it is important to take a closer look at the Pinus nigra surface properties and the properties of the investigated pollutants before an interpretation of air quality can be approached.

Thus, a detailed analysis of pollutant accumulation is done in this chapter, using electron microscopy for needle surface analysis, enviromagnetic methods for estimation of ultrafine and fine particulate matter loads (PM 0.1 , PM 2.5 , PM 10 ), and analysis of deposition and uptake of organic gaseous and particle-bound polycyclic aromatic hy- drocarbons (PAH) and inorganic major and trace elements. A systematic accumulation is here shown on a temporally resolved data set based on consequent needle generations covering a time-span of 4 years.

2.1 Accumulation histories of magnetic particles

It is now well established that particulate matter (PM) in urban air contribute sig- nificantly to adverse health effects [190, 274, 256]. The European Community (EC) and authorities of the World Health Organisation (WHO) have consequently developed strategies for monitoring and reducing particulate matter in urban air [49, 50, 275].

Ultrafine (< 0.1 µm, PM 0.1 ) and aggregate (< 1 µm, PM 1.0 ) particulates are proven to have worse health effects than fine (< 2.5 µm, PM 2.5 ) materials [87, 276].

Particulate matter sampling can be achieved by active collection onto filters, with the advantage that different size classes can be differentiated. This method is time and cost intensive and, therefore, limited with respect to highly resolved spatial monitor- ing or for reconstruction of past pollution trends for a given location. Environmental magnetics offer a means of PM analysis of urban air and has been applied to the study of filter-collected particulates [58, 223, 285, 160, 162, 103, 222]. Alternatively, biomon- itoring, employing passive accumulation of PM on plant surfaces, has been introduced as an air quality indicator. In biomonitoring studies the spatial mapping of PM loads via environmental magnetic techniques has been shown to be rapid, non-destructive and affordable [147, 103, 156, 82, 255, 66]. Conifers were proven to be more reliable than broadleaf trees due to higher deposition velocities for fine to ultrafine particulates and higher capture efficiency [13, 62]. Seasonal broadleaved trees or grasses only yield short-lived PM accumulation histories in the order of months. Evergreen broadleaves serve as pollutant collectors for up to 3 years and allow investigating temporal dis- tribution trends [156]. Whereas temporal variations over the vegetation period are known to strongly affect the concentration of volatile and semivolatile pollutants in plants [115, 173], effects of seasonality have not been studied for PM accumulation.

Here, the accumulation histories for PM on Pinus nigra needles with maximum expo-

sure of 5 years applying environmental magnetic techniques are investigated. Summer

and winter samples were collected for 5 needle generations at 6 locations with different

emission background in the Cologne Conurbation and adjacent rural areas. Magnetic

mineral composition, concentration, and magnetic PM grain sizes can be analysed

using enviromagnetic methodology. The magnetic properties are compared to needle

surface structure as well as the physiologically and seasonally controlled water and wax

(20)

10 2 POLLUTANT ACCUMULATION ON PINUS NIGRA NEEDLES content. The influence of seasonal variation and of non-linear accumulation histories needs to be investigated in order to select most representative needle cohorts suitable for spatial monitoring studies. In order to verify whether the variability inherent in natural systems allows for assemblage of a representative biomonitoring data set the problem of intra-site versus inter-site variability is further addressed [222]. The results discussed in this chapter have been published by Lehndorff et al. [126].

Figure 3: Simplified map of land use and traffic infrastructure with location of sampling sites. Insert at lower right depicts location of Cologne Conurbation in NW-Europe. Insert at upper right shows simplified morphology, prevailing wind directions and location of lignite mines.

2.1.1 Sampling methods

The Cologne Conurbation is situated in the western part of Germany, close to Belgium

and the Netherlands (Fig. 3). Dominant morphological features generally trend NW-

SE and include the Lower Rhine Valley. The adjacent slopes of the Rhenic Massif

reach elevations of 200 m above sea level (a.s.l.) in the East and 300 m a.s.l. in the

West. The Lower Rhine Embayment cuts a triangular plain into the Rhenic Massif

with average elevations around 50 m a.s.l. in the Cologne Conurbation, flanked by the

Ville Ridge (130 m a.s.l.) and the Zuelpich Plain (80 m a.s.l.). The western part is

characterised by mining of Tertiary lignite deposits in two open cast pits, which cover

a total area of 60 km 2 . Lignite comprises a major regional energy source, generated

in three lignite fueled power plants (total capacity 10,000 MW/a). Prevailing wind

directions are north-north-westerly in the South, changing to a westerly direction in the

North of the Lower Rhine Embayment (Fig. 3). Principal land use includes urbanised,

industrialised and rural areas (Fig. 3). An industrial corridor along the river Rhine

(21)

2.1 Accumulation histories of magnetic particles 11

Location Pine tree environment Emission Scenario

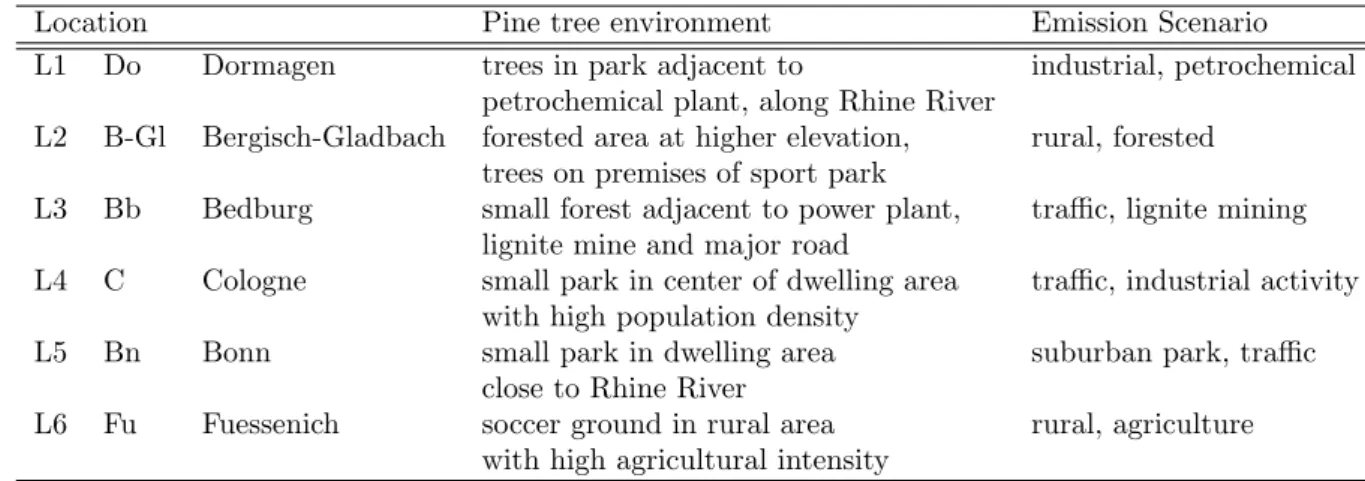
L1 Do Dormagen trees in park adjacent to industrial, petrochemical petrochemical plant, along Rhine River

L2 B-Gl Bergisch-Gladbach forested area at higher elevation, rural, forested trees on premises of sport park

L3 Bb Bedburg small forest adjacent to power plant, traffic, lignite mining lignite mine and major road

L4 C Cologne small park in center of dwelling area traffic, industrial activity with high population density

L5 Bn Bonn small park in dwelling area suburban park, traffic

close to Rhine River

L6 Fu Fuessenich soccer ground in rural area rural, agriculture with high agricultural intensity

Table 1: Characteristic land use and emission scenarios for sampling sites investigated.

shows the highest population and traffic density. With respect to specific emission characteristics six sites were chosen as depicted in Table 1.

All sampling sites were selected to provide pine needles with minimal influence from near point sources (particularly traffic). To best represent the local atmospheric situa- tion, only pines fully exposed to all wind directions were chosen. Needle samples were taken from three trees per location to study the inter-site consistency of accumulated pollutants or pollutant proxies. In order to evaluate accumulation rates, needle cohorts of the past four growth periods were taken during two sampling campaigns in February and August 2004, 3 to 8 months after needle shoot respectively. This allows investi- gating seasonal variation in pollutant concentrations, resulting from temperature and emission changes or plant physiological reactions. Averaged needle density of the first and second needle generation of each tree was estimated against a reference, as de- scribed by the Federal Research and Training Centre for Forests, Natural Hazards and Landscape, Austria (http://bfw.ac.at/rz/wlv.lexikon, 2004). Samples were collected from 3 sides of a tree at 3 to 5 m height and combined to composite sample cohorts using extendable pruning shears. Needles were cut directly from the branch, at about 1 cm from the needle base and stored deep frozen prior to analyses.

2.1.2 Analytical Methods

Microscopical and microprobe analyses Needle surfaces of different age and

pollution background after gold sputtering was investigated with a scanning electron

microscope (CamScan44, Cambridgeshire, UK). One centimetre was cut off of the cen-

tre of three needles per sample and arranged on the sampler holder with both the

abaxial and adaxial side exposed. SEM-scans allow identification of epicuticular wax

structure (crystalline shape and surface wax film), needle surface properties (polluted

and unpolluted stomata) and particles of diverse shape and size. Electron optical res-

olution was limited to a magnification of 25,000 times allowing the detailed inspection

of particles to a minimum size of ∼1 µm. For identification of the elemental composi-

tion, electron microprobe analysis was applied using a JEOL JXA-8900RL Superprobe

(JEOL, Peabody, USA).

(22)

12 2 POLLUTANT ACCUMULATION ON PINUS NIGRA NEEDLES

a) H-value p critical

(n = 36) H-value

water loss 11.46 0.04298 11.07

wax 5.77 0.32933 9.24

χ 29.51 0.00002 25.74

SIRM 25.40 0.00012 20.52

ARM 18.34 0.00255 15.09

B cr 18.72 0.00217 15.09

s-ratio 13.75 0.01727 11.07

b) loc. water loss wax χ SIRM ARM B cr s-ratio

L1 13.25 2.50 23.67 24.50 27.33 20.00 12.33

L2 11.83 7.00 14.67 10.50 12.33 32.67 23.17

L3 9.67 7.50 24.33 22.33 26.67 13.00 20.50

L4 23.40 4.50 33.17 33.17 23.50 13.00 8.83

L5 19.75 7.00 10.50 11.67 8.83 22.17 28.33

L6 9.33 10.50 4.67 8.83 12.33 10.17 17.83

n 28 12 36 36 36 36 36

Table 2: Statistical analyses of pine needle populations at 6 locations by non-parametric Kruskal-Wallis-H test. a) mean ranks for parameters at individual locations, b) H-values for individual parameters (df = 5, n = 6), p = asymptotic significance at a 99% confidence level.

Means used for calculation are given in Table 29 in the appendix.

Magnetic analyses Environmental magnetic analyses (n=143) was carried out fol- lowing procedures given detailed by Urbat et al., [255]. In brief, bulk magnetic suscep- tibility χ was measured at room temperature on a KLY-2 susceptibility bridge (noise level 4 × 10 −8 ; AGICO, Czech Republic). Susceptibility gives the magnetizability of the sample and is likely to be dominated by ferrimagnetic particles. Anhysteretic Re- manent Magnetization (ARM) was imparted using peak alternating fields (AF) of 100 mT, with a biasing field of 40 µT superimposed. The ARM is interpreted as a concen- tration parameter and is particularly sensitive to the content of stable single domain (SSD) ferrimagnets (for magnetite these are grain sizes between 0.03 - 0.4 µm). The Isothermal Remanent Magnetization (IRM) was imparted at progressively higher pulse fields up to 1.5 T, followed by a stepwise acquisition of the backfield curve to 0.3 Tesla.

This measurement provides information about mineral composition, particle size and relative concentration of remanent magnetic particles (Saturation IRM (SIRM)). The backfield curve gives additional information about the mineral magnetic composition and grain size ranges from the calculation of the coercitivity of remanence (B cr ) and s-ratio (s = [1 - (IRM −300mT / SIRM)] after Bloemendal et al. [21]). ARM and IRM measurements were carried out using the respective in-line solenoids and pulse magnet of a three-axis DC-SQUID magnetometer (noise level 5 × 10 −12 A m 2 ; model 755R, 2G Enterprises, USA).

Organic geochemical analyses Organic solvent extraction and clean up of needle

wax was applied on each needle cohort. In order to minimise analytical costs and

efforts a composite sample was prepared for each needle cohort from all individual

locations sampled in triplicate. Recovery of waxes also yields the polycyclic aromatic

(23)

2.1 Accumulation histories of magnetic particles 13

water loss wax χ SIRM ARM B cr s-ratio

water loss 1

wax -0.35* 1

χ -0.34** 0.50** 1

SIRM -0.34** 0.52** 0.98** 1

ARM -0.43** 0.44** 0.88** 0.89** 1

B cr -0.26** 0.54** 0.77** 0.76** 0.60** 1

s-ratio 0.25** 0.05 -0.02 -0.01 -0.25** 0.03 1

Table 3: Spearman’s rank correlation coefficients (n = 142 for magnetic parameters, n = 134 for water loss, n = 47 for wax concentration, raw data given in Table 26 in appendix).

Values are significant at * p < 0.05, ** p < 0.01.

hydrocarbons (PAH) on the pine [123] and the extraction process was optimised for full recovery of the PAH. The needle surface was extracted by accelerated solvent extraction (DIONEX ASE 200, p=75 bar, T=120 C) with hot n-hexane:dichloromethane 99:1 (v/v). Plant waxes are insoluble in n-hexane at room temperature and precipitated upon cooling to form crystalline aggregates. These were separated by centrifugation and the amount determined gravimetrically. Water content of needles was determined after drying for one week in an oven (50 C).

Statistical analyses Data were analyzed statistically using SPSS 12.0 for Windows.

Nonparametric analysis of variance was performed by the Kruskal-Wallis-H test to identify significant variations between the 6 sampling sites (n = 36, Table 2 and Ta- ble 29 in appendix). Normal distribution of sample populations (n = 142, Table 26 in appendix) was tested by the Kolmogorov-Smirnov procedure. Spearman’s rank correla- tion coefficients were determined to evaluate relationships among magnetic parameters (Table 3).

2.1.3 Results

Wax and water content Magnetic particles accumulate on the outer surface of pine needles and in stomatal cavities with no translocation to the needle interior or volatilisation loss reported. Generally, the amount of PM accumulated on vegetation surface is reported normalized to the dry weight of the whole needle or leaf. The amount and surface area of waxes in relation to the total needle weight varies season- ally and between locations depending on environmental factors including temperature, humidity, or wind stress. Thus, waxes are subject to ongoing degradation but are pe- riodically renewed by the plant. Wax abrasion and dissolution may remove previously wax-embedded magnetic PM. Hence, the wax content has to be considered to properly evaluate accumulation histories for magnetic PM on pine needles.

Wax concentrations per cohort for the 6 locations increases during the first 20

months after bud break (Fig. 4a; Table 26 in appendix) and then reach equilibrium. On

average 50 months old needles reveal concentrations 3 times higher than needles with

a lifetime of 3 months. Mean concentrations differ depending on location with highest

wax contents occurring in Bedburg and low concentrations in Bergisch-Gladbach. The

(24)

14 2 POLLUTANT ACCUMULATION ON PINUS NIGRA NEEDLES

Figure 4: Physiological and enviromagnetic properties. a) wax content vs. exposure time, b) water loss vs. exposure time, c) wax content vs. magnetic susceptibility χ, samples from metropolitan Cologne grouping separately are highlighted, d) needle density vs. difference in χ determined for 2 nd and 1 st needle cohort, sampled in winter.

initial water content of young needles varies between 55% and 62% for the six locations (Fig. 4b) and than gradually decreases to about 50% over the next 50 months. The needle density noted for summer and winter samples is location specific (Fig. 4d) and reveals a negative correlation to the gain in susceptibility ∆χ comparing first to second year needles (displayed as ∆χ = χ needle cohort 2 - 1; Fig. 4d). Cologne shows the lowest needle density for the first and second cohort but the highest increase in susceptibility for these needle generations. In contrast, rural Bonn and Fuessenich pines maintain approximately 100% needle density and correspondingly low differences in susceptibility.

PM composition, concentration and grain size For the Cologne Conurbation

it is shown by electron microscopy with EDX that pine needle surface and stomatal

cavities show predominantly spherical iron-bearing particles up to 2.5 µm that result

from combustion processes [255]. This could be confirmed by environmental magnetic

analysis indicating the presence of almost exclusively magnetite, predominantly in a

size class <2.5 µm [255]. In contrast to the previous study, the pine needles analyzed

in this investigation, except for one sample, are not restricted to metropolitan Cologne

(25)

2.1 Accumulation histories of magnetic particles 15 but derive from 5 locations in its vicinity (Fig. 3). Pine needles are thus expected to have been exposed to different emission scenarios and to show variable accumulation histories reflected in the magnetic PM composition.

Microscopical PM identification Needle surface investigation by SEM showed highest relative particle density and size in samples from Cologne, whereby needle wax deterioration and number of particles increased with needle age. The rural station Fuessenich revealed the lowest number of particulates on needle surfaces, whereby particles were restricted to finer grain sizes. Structural integrity of waxes was highest for needles from the Fuessenich location. In contrast to the study of pine needles from Cologne City [255], where only spherical iron particles were observed, this study also revealed the presence of irregularly shaped iron-bearing PM reaching sizes up to 30 µm (Fig. 5). Sharp-edged particle fragments are commonly attributed to abrasion in vehicles, especially brake wear [244, 86]. Fig. 5 shows such a particle with a dimension of about 15 µm accompanied by an iron-bearing spheroid of 2.5 µm diameter and irregular, eventually fragmented dust particles.

Figure 5: Electron microprobe scan of needle surface. Third year needle sample from Cologne exhibits different particles: a) sharp-edged particle ∼ 15 µm in size, composed of Fe, Si, O, b) spherulite ∼ 2.5 µm in diameter, composed of Fe, Si, O, Al, c) irregular shaped particle

∼ 2 µm in diameter, composed of Si, Al, O, K.

Magnetic mineral and grain size identification Magnetic mineral composi-

tion of actively sampled PM or vegetation surfaces has previously been shown to be

dominated by magnetite [160, 162, 156]. In agreement with the results from Cologne

City [255] the present mineral magnetic measurements also identify magnetite (Fe 3 O 4 )

as the dominant ferrimagnet at all locations. While the mineral magnetic parameters

yield a rather uniform picture with respect to the type of the magnetic mineral, major

differences in between the locations derive from varying concentrations and grain size

distributions. Typical for fine grained magnetite (i.e. <0.4 µm) the IRM acquisition

curves are initially flat (<10 mT) and generally approach saturation in fields of 200

mT (Fig. 6a [248]). The incomplete saturation at 200 mT points to a minor deviation

from stochiometric magnetite, likely due to a slight mineral oxidation. A ferrimagnetic

dominance in all samples is further supported by s-ratios >0.94 (Fig. 9d). B cr values

(26)

16 2 POLLUTANT ACCUMULATION ON PINUS NIGRA NEEDLES generally range from 30 - 53 mT, except for the youngest needles (3 months) having coercivities of remanence of 16 - 30 mT. Under the assumption that dominantly mag- netite is present in the samples the B cr values can be regarded as grain size sensitive.

Note, that the B cr range viewed per location is even more restricted (Fig. 9a).

Figure 6: Mineral and grain size diagnostic enviromagnetic parameters: a) acquisition curves of IRM normalised to saturation IRM (SIRM); insert displays spread in backfield curves, only minimum and maximum B cr yielding curves are shown; b) binary plot of volume magnetic susceptibility κ versus SIRM with data points coded according to location, triplicates for each needle cohort per location are averaged; c) bivariance plot for identification of magnetic minerals [187] with indication of magnetite domain status, SDM = single domain magnetite, MDM = multi domain magnetite and SPM = superparamagnetic magnetite; d) binary plot of κ versus ARM, data points can be grouped according to location and dominant emission scenario. For details see text.

From the significant linear correlation of SIRM and κ r 2 = 0.98; Fig. 6; Table 3), it is inferred that the susceptibility is predominantly controlled by the amount of mag- netite on the pine needles. A bivariate plot combining SIRM/κ and B cr illustrates the dominance of magnetite in the single domain grain (SDM) size range (Fig. 6c; [187]).

Locations are grouped with respect to SIRM/κ, indicating additional contributions of

coarser multi domain magnetite (MDM) for the stations at Cologne, Bergisch-Gladbach

and Bonn as well as finer superparamagnetic magnetite (SPM) on Bonn and Cologne

(27)

2.1 Accumulation histories of magnetic particles 17 needles. Only one sample from the Fuessenich location yields an exceptionally high ratio, typical of iron sulfides like pyrrhotite. There is, however, no further support- ing evidence for this notion. Samples from Cologne, Bedburg and Dormagen display SIRM/κ lower than would be expected for magnetite grains >0.03 µm. It is con- ducted that κ in these samples is relatively increased over SIRM due to the admixture of ultrafine (<0.03 µm) magnetite. Such ultrafine particles (SPM) are characterised by high susceptibilities, but, do not contribute to SIRM due to their short relaxation times. Ultrafine magnetite is further supported by a comparison of ARM intensities (sensitive to SSD magnetite) and susceptibilities (Fig. 6d; [89]). Dissimilar to SIRM vs. κ the overall linear correlation for the entire data set is lost (Table 3). Instead, dif- ferent slopes of linear regression lines separate the respective locations. Samples from metropolitan Cologne are characterized by relatively elevated susceptibilities, again confirming ultrafine magnetite admixtures. In contrast, rural site Fuessenich displays the opposite trend towards decreased ultrafine contributions.

Magnetic mineral concentration The concentration of magnetic PM on pine needles serves as a proxy for atmospheric particle loading in Europe [103, 156, 82] and Asia [66]. In Kathmandu a concentration range of χ in broadleaved trees of 0.01 - 54

×10 −8 m 3 kg −1 was determined [66]. Moreno et al. [156] determined a range in χ of 0.2 - 49 ×10 −8 m 3 kg −1 on evergreen broadleaved trees. No detailed information on exposure times and composition of leaf cohorts analysed was given.

For this study, no sites with direct point source exposure (e.g. traffic) were cho- sen. Values for χ vary between -0.5 and 8 ×10 −8 m 3 kg −1 for the entire data set (n=143; Table 26 in appendix). If susceptibility is averaged using weighted contribu- tions of every needle cohort, the range in susceptibility for a given location including summer and winter collected needles is 0.03 - 6 ×10 −8 m 3 kg −1 (Fig. 7; Table 31 in appendix). Weighting factors of 1 : 0.9 : 0.5 : 0.2 were utilized for 4 consecutive needle generations. Highest mean concentrations were detected in Cologne, followed by Bed- burg and Dormagen. The lowest concentrations were measured for Bergisch-Gladbach, Bonn and Fuessenich. In general, elevated concentrations are associated with a higher spread in total susceptibility values (Fig. 7). The ranges in the upper to lower quar- tile remain similar for stations Dormagen, Bergisch-Gladbach, Bonn and Fuessenich, whereas stations Bedburg and Cologne reveal broader ranges (Fig. 7). The SIRM values reveal tendencies similar to the susceptibility (Fig. 6b; Table 26 in appendix) with only slightly higher SIRM values observed for the Dormagen location (Fig. 7).

When compared to χ and SIRM, the ARM shows a different distribution pattern, with enhancement for stations Dormagen and Fuessenich, contrasted by a significant decline in Cologne (Fig. 7; Table 29 in appendix). ARM data differentiate two groups, the one with lower ARM signals is represented by more rural stations in Bergisch-Gladbach, Bonn and Fuessenich, the second with higher ARM intensities includes urban locations in Dormagen, Bedburg and Cologne (Fig. 7).

Magnetic mineral accumulation history Concentration dependent parame-

ters χ, SIRM and ARM increase with needle exposure time (Fig. 8a-c). Gradients in

accumulation rate vary between locations and for χ and SIRM increase in the order

Fuessenich, Bonn, Bergisch-Gladbach, Dormagen, Bedburg, and finally Cologne (Fig.

(28)

18 2 POLLUTANT ACCUMULATION ON PINUS NIGRA NEEDLES

Figure 7: Ranges in magnetic concentration parameters, triplicate analyses averaged for each tree. Boxes indicate upper and lower quartile, whiskers encompass maximum and minimum values and horizontal bar gives median value. Locations: Do = Dormagen, B-Gl = Bergisch- Gladbach, Bb = Bedburg, C = Cologne, Bn = Bonn, Fu = Fuessenich. For discussion see text.

8a,b; Table 26, 31 in appendix). A deviation is noted in lower ARM intensities for Cologne and a minor enhancement for Fuessenich. This allows samples to be grouped into two clusters according to their ARM intensities (Fig. 7; Table 29 in appendix).

The increase in PM accumulation, as determined by enviromagnetic proxies is not linear but occurs at higher rates during the first 20 months followed by establish- ment of equilibrium concentrations after approximately 26 months. The highest PM accumulation is measured between the first two needle generations of each sampling campaign (∆χ, Fig. 4d). Non-linear increase occurs two-fold, in a non-systematic manner, as observed for the Cologne station with strongest excursions observed for exposure months 26 and 44 (Fig. 8a,b). Systematic alternations between summer and winter collected samples occur in Bedburg and Fuessenich, whereby it is important to note the alternation pattern is directly opposed and, thus, not a function of seasonality.

Statistical results Physiological and enviromagnetic data (n = 143) are normally

distributed as indicated by the Kolmogorov-Smirnov test (χ: p = 0.24; SIRM: p =

0.4; ARM: p = 0.7). Nonparametric analysis of variance by the Kruskal-Wallis-H test

(29)

2.1 Accumulation histories of magnetic particles 19

Figure 8: Accumulation curves for averaged needle cohorts analysed in triplicate. Samples representing 3, 14, 26, 38, and 50 months of exposure were taken in summer 2004, remaining samples were collected in winter season of 2004. For discussion of trends in accumulation curves see text.

is commonly used for data sets with high variability between groups [75, 222]. For

all enviromagnetic parameters the test proves significant inter-site variability between

locations, whereas wax and water content are close to or below the critical H-value

(Table 2). Spearman’s rank correlation coefficients determined to evaluate relation-

ships among different magnetic parameters (Table 3) show significant correlation at

the p <0.01 level, except for wax vs. water loss with p <0.05 and the s-ratio showing

no significant correlation with the remaining parameters.

(30)

20 2 POLLUTANT ACCUMULATION ON PINUS NIGRA NEEDLES 2.1.4 Discussion

Prior to the discussion of magnetic properties as proxies for atmospheric PM loads, seasonal variations thereof and source allocation of PM, it is required to demonstrate that the differences in magnetic properties are systematically influenced by air quality and not dependent on sampling procedures or strategies. It is of importance to interpret only those enviromagnetic signals that are clearly differentiated from the variability inherent in natural systems. The systematic variations observed in this study are above natural background variability and thus represent air quality.

Enviromagnetic techniques are most sensitive to ferromagnetic particulates and, thus, preferentially characterise the fraction of atmospheric particulates that derives from combustion processes or metallic wear and abrasion. In the presence of magnetite, needle bound minerogenic dust contributes only subordinately to the total magnetic susceptibility. Importantly, application of more sophisticated IRM and ARM tech- niques exclusively records combustion derived ferrimagnetic particles. These occur mainly in the PM 2.5 fraction or as nanoparticles and, thus, have strong adverse health effects [276]. Enviromagnetic techniques, therefore, provide the “most wanted” atmo- spheric quality information, though they are incapable of reflecting the total suspended particle loads.

Inter- and intra-site variation At each location a pine needle composite from three trees was taken to fully represent local conditions in atmospheric particle loadings. The Kruskal-Wallis-H test proves significant inter-site variability of enviromagnetic param- eters between all locations, whereas water loss and wax content are not significantly dissimilar (Table 2a). Location Fuessenich has the lowest mean rank (Table 2b) due to

“a high noise” at an unpolluted background site. The box and whisker plots in figure 7 indicate that the variability at a given location is smaller than in between locations.

This is confirmed by the low coefficients of variation (Table 29 in appendix) and mean ranks (Table 4b) per site.

The excellent correlation between χ and SIRM (Fig. 6b, 7; Table 3) indicates that the susceptibility almost exclusively reflects ferrimagnetic pollutant concentrations.

As shown in figure 7 and Table 4, the ARM displays a pattern different from χ and SIRM. The box and whisker plots show much higher intra-site variability for stations Dormagen, Bedburg and Cologne. The larger spread at these sites is due to the twofold influence of magnetic mineral concentration as well as grain size on ARM intensities, whereas χ and SIRM are less susceptible to variation in grain size composition. This can be taken as evidence for a preferentially urban or industrial emission scenario characterised by high magnetic particle loadings dominated by fine, single domain magnetite. In contrast the Bergisch-Gladbach, Bonn and Fuessenich locations exhibit a predominantly rural particle loading with a smaller fraction of fine PM.

Accumulation processes Since vegetation surfaces constantly interact with the

surrounding environment, a linear accumulation of particles with time is not to be

expected. Additionally, variation in emission patterns contributes to local variabil-

ity. Understanding of the accumulation behaviour of a monitored pollutant is of great

importance for sampling strategy and interpretation of the acquired data. The dis-

(31)

2.1 Accumulation histories of magnetic particles 21 cussion of accumulation controlling processes is based on needle cohorts sampled in winter (n=4) and summer 2004 (n=5), altogether revealing the accumulation history of 4 years for each station (Fig. 8a-c, Table 31 in appendix).

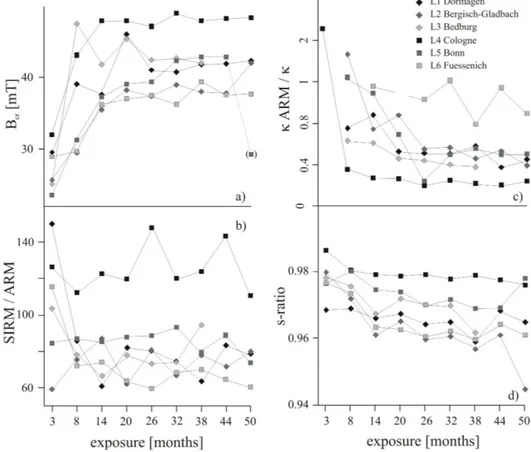
Anthropogenically induced accumulation The magnetic susceptibility of 3 months old pine needles is below zero for all locations, except Cologne, revealing a dominance of diamagnetic plant material and only a minor contribution of magnetite for the most polluted station in the city of Cologne (Fig. 8a). The continuing increase in the accumulation curve is location-specific and clearly separates every location after 20 months of needle exposure. Systematically growing differences in concentration of χ show that no saturation for particle enrichment on the needles surface is reached.

Curve shapes detected by SIRM analysis are similar to χ and reveal the metropolitan station in Cologne as having the steepest accumulation rate, being higher by a factor of 4 compared to rural Fuessenich. Therefore, the concentration of SIRM and χ, for needles older than 2 years in general, is a function of cumulative and time-averaged atmospheric pollution. Additionally, ARM intensities (Fig. 8c) rise with increasing needle exposure time but reflect higher concentrations of the fine magnetic mineral fraction. The distinction between two types of atmospheric environments, one with a higher amount of small grain sizes and one with lower contributions of fine magnetite, is established after 8 to 14 months of needle exposure and remains until needle senescence.

Figure 9: Variation of grain size and oxidation indicative enviromagnetic parameters versus

needle exposure time, averaged for needle cohorts analysed in triplicate. Diamagnetic samples

excluded in panel c).

(32)

22 2 POLLUTANT ACCUMULATION ON PINUS NIGRA NEEDLES The s-ratio emphasizes an anthropogenic induced accumulation process. Small variances from 0.95 to 0.99 (Fig. 9d) are interpreted as an increasing oxidation of the magnetite over a period of four years [113]. Although a fraction of the magnetite accumulated in the first year(s) of exposure may be removed from the needle by rain or wind abrasion, the magnetic PM is not seasonally eroded and renewed in total.

Natural accumulation factors The non-linear accumulation pattern of mag- netite on pine needles is assumed to be controlled by diverse natural processes. A canopy effect, as proposed by Horstmann and MacLachlan [93], is a reasonable ex- planation for a lowered accumulation rate measured for consecutive needle cohorts in this study (Fig. 8a-c). Since first year needles reach an mean twig length of 20 - 30 cm, older generations are successively protected by younger cohorts scavenging most of the airborne pollutants. The needle density noted for cohort 1 and 2 is here used as a proxy for limitation of PM throughfall and shows a significant influence on particle accumulation (Fig. 4d). Additionally, magnetic investigations on trees at urban road sides show a 45 % difference between the road-facing and the road-opposing side due to the filtering capacity of the road-exposed foliage [147].

Chemical and physical alterations of vegetation surfaces also have to be considered to contribute to a loss of particles. Degradation and renewed production of epicuticular waxes, abrasion or wash-off may lead to an equilibration level of particle accumulation and degradation. As discussed by Urbat et al. [255] temperature induced seasonal decline of surface wax concentration does not influence magnetic properties of needles.

In this study no reduction in wax concentration with increasing needle age was observed (Fig. 4a). As waxes are assumed to sorb magnetic PM their degradation would lead to a more effective particle abrasion. In contrast, waxes reveal an accumulation trend over four years that is comparable to the particle enrichment (Fig. 4a and Fig. 8a,b). The lack of correlation between wax amount and magnetite concentration for the locations (Fig. 4c) indicates particle accumulation is not only a function of the integrity of the epicuticular wax layer. It is important to note that needles from Cologne pines deviating from the general trend of covariance seen in figure 4c, show an exceptionally high magnetite but low epicuticular wax concentration. Covariance is assumed to result from the time dependence of both processes, i.e. wax production or particle accumulation.

As discussed by Kylin and Sj¨ odin [115] changes in needle diameter may exert an influence on particle concentration, which is primarily a function of surface area. Water loss of pine needles investigated is supposed to reflect a decrease in needle surface area with age (Fig. 4b). The biannual changes in magnetic properties behave contrary to a reduction in water content and surface area, implying that effects of needle surface area are of minor importance.

Seasonal variation in accumulation Seasonal effects on deposition, removal

or transport of PM result from natural, mainly climatic processes, as well as from

changes in anthropogenic emissions [160]. Monthly resolved sampling campaigns and

investigations of particulate pollutants, in general, show seasonal shifts to higher at-

mospheric pollution in winter [85, 252, 276, 255], due to higher traffic density and

domestic heating.

Abbildung

Table 1: Characteristic land use and emission scenarios for sampling sites investigated.
Figure 9: Variation of grain size and oxidation indicative enviromagnetic parameters versus needle exposure time, averaged for needle cohorts analysed in triplicate
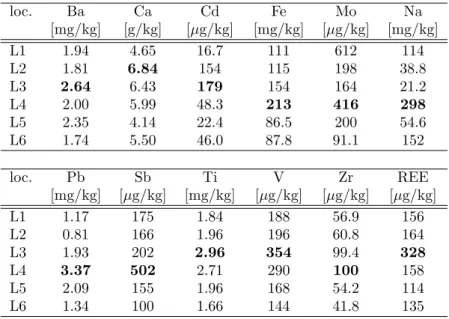
Table 4: Element concentrations shown as weighted means for each location (2 x 4-5 needle generations; n ≤ 9; maximum concentrations in bold).
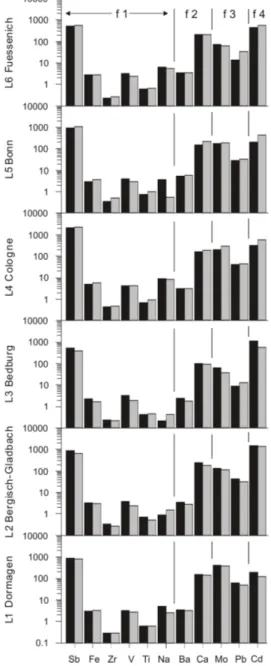
Figure 12: Element enrichment factors for summer and winter samples at each location.
+7

Referenzen

ÄHNLICHE DOKUMENTE

Indian firms can make use of emerging trends in Germany’s processed food market (e.g. organic, fair trade and vegetarian/vegan products with health and wellness components) as

Im Zuge der Rekrutierung wurden zum Schulanfang ausgewählte Schulen (Direktorinnen und Lehrerinnen) per E-Mail bzw. telefonisch kontaktiert, und über die mögliche

Welche Biologischen Grenzwerte oder sonstigen Werte zur Beurteilung existieren für diesen

Nach Kurzzeitexpositionen kann mit Biomonitoring nur eine Aussage darü- ber gemacht werden, ob eine Exposition stattgefunden hat oder nicht [1, 2].. Ob diese hoch oder niedrig

Darüber hinaus zeigen diese Daten, dass bei wechselnden Arbeitsplätzen, wie sie ja auf Baustellen üblich sind, die Gefahrstoffbelastung nur beurteilt werden kann wenn

Bei mehreren Untersuchungen einer Person darf die mittlere Konzentration des Parameters den BGW nicht überschreiten; Messwerte oberhalb des. BGW

13:35 Bystander-Exposition – Konsequenzen für den Arbeitsschutz, Chris-Elmo Ziener, Peter Kujath 14:00 Diskussion der Session.

• Under what conditions can biological monitoring of exposed workers reduce the requirements for inhalation and dermal exposure assessment?. • Is biomonitoring a task reserved