Immune Surveillance of Cancer-
Molecular and Translational Aspects of Cytotoxic Effector : Target Cell Interactions
Inaugural-Dissertation
zur
Erlangung des Doktorgrades
an der Mathematisch-Naturwissenschaftlichen Fakultät
der Universität zu Köln
vorgelegt von
Nikola Baschuk
aus Bochum
Köln 2009
Berichterstatter: Prof. Dr. Martin Krönke Prof. Dr. Jonathan Howard
Tag der Disputation: 29.Juni 2009
1. Introduction...………...1
2. Material and Methods………...8
2.1. Material 2.1.1. Cell lines………. ...8
2.1.2. Mice………..8
2.1.3. Plastic ware………. ...8
2.1.4. Technical equipment……….9
2.1.5. Chemicals and reagents……… ..9
2.1.6. Cell culture medium, reagents and buffers……….10
2.1.7. Reagents for molecular biology………... .12
2.1.8. Antibodies………13
2.1.9. Primers……… .13
2.1.10. Plasmids...…… .13
2.1.11. Kits………14
2.2. Methods 2.2.1. Cell Culture……… 14
2.2.2. In vitro differentiation of ES cells into embryoid bodies………14
2.2.3. Cloning efficiency assay……… 15
2.2.4. Production and purification of recombinant T-Ag……….. 15
2.2.5. Treatment of ES cells……… 15
2.2.6. PCR………. 15
2.2.7. Treatment of mice……….. 17
2.2.8. Isolation of effector cells……… 18
2.2.9. Magnetic cell sorting………. 19
2.2.10. Chromium release cytotoxic assay……….19
2.2.11. Flow cytometry ………. 20
2.2.12. Quantification of cytokines and cells secreting cytokines ……… 21
2.2.13. Quantifying enzymatic activity ………..……… 21
2.2.14. Transient down regulation of Serpin-CI in ES cells by RNAi……… 21
2.2.15. Stable down regulation of Serpin-CI in CGR8 cells……… 22
2.2.16. In vivo bioluminescence imaging………...26
2.2.17. Cytotoxic in vivo assay……… 27
2.2.18. statistical Analysis………. 27
during antigen- specific rejection of mKSA tumor cells………..28 3.2. IL-4 is not required for the rejection of mKSA tumor cells
by TAg-immune BALB/c mice...29 3.3. Enhanced resistance of naive IL-4 -/- mice to challenge with
low doses of mKSA cells………32 3.4. IL-4-deprivation results in enhanced TAg-specific cytotoxic
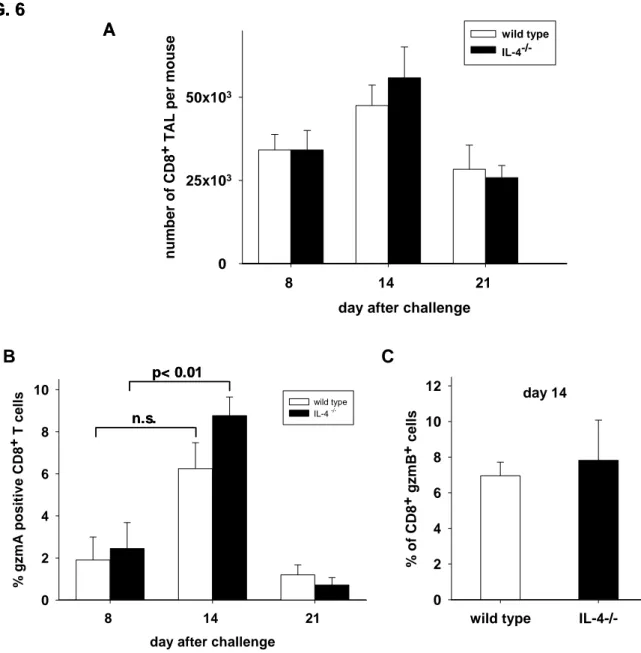
a activity, ccompanied by an increase in the fraction of tumor associated CD8 + T cells expressing granzymes A and B…………35
Results II
3.1. Accelerated rejection of mKSA tumor cells by
TAg-immune IL-10 -/- mice………42 3.2. Absence of TAg-specific CD8 + CTL in the peritoneal
cavity of TAg-immune IL-10 -/- mice………48 3.3. Cytotoxicity of TAg-specific CD8 + intestinal
intraepithelial lymphocytes in TAg-immunized IL-10 -/- mice………51 3.4. Intravenously transferred CD8 + intestinal IEL from
TAg-immunized L-10 -/- mice protect naïve wt mice
against lethal challenge with mKSA cells………...54 3.5. T cell-derived IL-10 is not significantly involved in
suppressing TAg- specific CD8 + intestinal IEL………..56 Results III
3.1. Murine embryonic stem cells are lysed less efficiently than
YAC cells by resting or activated natural killer cells………..62 3.2. Expression of MHC class I molecules by ES and EB cells………...65 3.3. Murine ES cells and EB cells are properly recognized by
resting or activated NK cells………67 3.4. Lysis of ES and is perforin dependent……….68 3.5 Expression of cathepsin B and Serpin 6 does not contribute
to reduced susceptibility of ES cells to NK cell mediated lysis……69
3.6. Resting and activated NK cells express Granzyme M………….. ...72
Cytotoxic Inhibition (SPI-CI), a specific inhibitor of granzyme M….74
3.8. SPI-CI protects ES cells from NK-cell mediated lysis in vivo….…..78
3.9. Expression of SPI-CI contributes to the tumorigenicity of ES cells in vivo………...82
4. Discussion………..84
5. References……….96
6. Abstract……….105
Erklärung...109
Abbreviations
mAb monoclonal antibody
CPM counts per minute
CTL cytotoxic T lymphocytes
DC dendritic cell
E:T ratio effector : target ratio
EB embryoid body
ELISA enzyme linked immunosorbent assay ES cell embryonic stem cell
Fig. figure
FCS fetal calf serum
gzm granzyme
HLA human leukocyte antigen
ICM inner cell mass
IFN-γ Interferon-gamma
IL-4 interleukin-4 IL-10 interleukin-10 ko knock out
IU infectious unit
LCM virus lymphocytic choriomeningitis virus LIF leukaemia inhibitory factor
MEF mouse embryonic fibroblasts MHC major histocompatibility complex MOI multiplicity of infection
mRNA messenger RNA
NK cells natural killer cells
Oct octamer-binding transcription factor PBS phosphate buffer saline PEC peritoneal exudate cells
PFU plaque forming unit
RT-PCR reverse transcriptase PCR
Serpin serine protease inhibitor
shRNA small hair pin RNA
siRNA small interfering RNA SPI serine protease inhibitor SSEA stage specific embryonic antigens T-Ag SV40 large tumor antigen
TAL tumor associated lymphocytes TIL tumor infiltrating lymphocytes.
TCR T cell receptor
TU transducing unit
wt wild type
1.Introduction
1.1 Principles of antigen specific immunotherapy of tumors
A thorough understanding of the immuno-regulatory pathways supporting or suppressing the generation of CD8 + CTL is of utmost relevance for the implementation of immunotherapeutic approaches against tumors for several reasons: (i) CD8 + T cells are presumably the most important effector cells for immunotherapeutic approaches against cancer; (ii) endogenous as well as vaccine- driven immune responses of CD8 + T cells against tumor-specific antigens are often rather weak, such that they can be measured only after several rounds of restimulation in vitro (Muul et al. 1987), (iii) tumor patients often suffer from immunosuppressive effects directly and indirectly caused by the tumor. If it were possible to counteract adverse immunoregulatory effects and to promote endogenous immunostimulatory mechanisms in tumor patients, the use of tumor- specific CD8 + CTL could be established as a potent additional modality in tumor therapy.
Massive clonal expansion and acquisition of effector functions of CD8 + T cells requires induction by fully matured DC which are able to provide to naïve CD8 + T cells beyond the inductive signals 1 and 2 an additional signal 3 (reviewed in Mescher et al.). So far, as signal 3 the cytokines IL-12 and type I interferons (IFN) have been identified. DC can be induced to secrete these cytokines in either an antigen-specific or a non-specific fashion. Antigen-specific “licensing” of DC to produce IL-12 can be achieved by ligation of CD40 on DC by CD40L (CD154) on CD4 + T helper cells. As a consequence of this insight, a recent improvement in tumor-specific vaccination was to mix MHC class II-restricted peptides with MHC class I-restricted peptides so that specific CD4 + T helper cells are induced in parallel to CD8 + T cells. The strength and quality of the CD8 + T cell response was further improved by linking MHC class I- and II-restricted epitopes so that processing and presentation of both epitopes by the same antigen-presenting cell (APC) was warranted.
Despite these improvements, even T cell responses against definitely foreign, virus-
derived tumor-associated antigens were mostly too weak or short-lived to achieve
control of tumor cells. One approach to strengthen the antigen-specific CD 8 + CTL is
to optimize the quality of the CD4 + T helper response, e.g. by enhancing their Th1
and suppressing their Th2 activities (Pardoll et al., 2002; Rosenberg et al., 2008;
Figdor et al., 2004).
But even antigen-specific, fully competent effector CD8 + CTL induced by fully inflammation-matured DC did not necessarily achieve effective control of tumor cells, because these CTL accumulated largely in the lymph nodes draining the vaccination site instead of patrolling through the systemic circulation (van der Burg et al., 2006;
Welters et al., 2007). Finally, even if antigen-specific effector CD8 + CTL might infiltrate the tumor tissue, they can be blocked or inactivated by tumor cells via various mechanisms (Blattman and Greenberg, 2004; Melief, 2008). One of the most recently discovered is the expression of specific inhibitors of cytotoxic effector molecules (Abdullah et al., 2007; Bots et al., 2005).
1.2. Expression of specific inhibitors of cytotoxic effector molecules in tumor cells
Cells of various murine tumor types express the serine protease inhibitor 6 (SPI- 6), the specific inhibitor of granzyme B (grzB). Serpin PI-9, the human homolog of SPI-6, was previously shown to be expressed by dendritic cells, which prevents premature destruction of these professional antigen-presenting cells (APC), and by cells at immune-privileged sites, where degranulation of CTL is potentially deleterious (Bladergroen et al., 2001; Medema et al., 2001). In addition, murine SPI-6 was reported to play a crucial role in the protection of CTL against the suicidal effects of their own grzB (Zhang et al., 2006). Expression of the human serpin PI-9 and its murine homologue SPI-6 has been detected in various types of melanoma, carcinomas, and lymphomas (David-Watine et al., 1987; Medema et al., 2001; Bots etal., 2005) and was realized to be linked with the escape of tumor cells from immunosurveillance.
Altogether, the experiences acquired in tumor immunology within the previous
two decades indicate that an improved understanding of the function and regulation
of T cells within the microenvironment during induction, homing and execution of
effector functions is a prerequisite for establishing protocols for reliable and sustained
control of tumors by the immune system.
1.3. The experimental system to study immuno-regulatory mechanisms
To understand immunoregulatory mechanisms in weak tumor-specific immune responses, we study the simian virus 40 (SV40) large tumor antigen (TAg)-specific rejection of syngeneic TAg-expressing mKSA tumor cells in BALB/c mice (J. Zerrahn et al., 1996; Utermöhlen et al., 2001) The mKSA cells form in syngeneic mice fibrosarcomas after s.c. injection and produce severe peritoneal carcinosis after i.p.
inoculation. We chose this murine tumor model because it exhibits features resembling the clinical situation with regard to the extremely weak reactivity of the immune system towards tumor-specific antigens. With respect to the generation of TAg-specific CD8 + CTL, BALB/c mice were characterized in the literature as low- or even non-responders (Bright et al., 1996; Gooding et al.,1977; Knowles et al., 1997;
Newmaster et al., 1998, Schirmbeck et al., 1996; Tevethia et al., 1990, Pfizenmaier et al., 1980) This is nicely documented by the fact that so far only a single subdominant H-2K d -restricted epitope of TAg was identified after several rounds of restimulation in vitro of T cells from SV40-immune BALB/c mice (Newmaster et al., 1998), while in C57BL/6 mice, known to mount a strong CTL response against TAg, five immunodominant MHC class-I-restricted epitopes have been identified (Tevethia el., 1990).
However, our group detected a small but highly cytotoxic population of TAg-specific CD8 + CTL among the peritoneal exudate cells of TAg-immune BALB/c mice challenged i.p. with TAg-expressing mKSA tumor cells (Baschuk et al., 2007). These TAg-specific CTL depend on the support of CD4 + T helper cells over the whole course of tumor cell rejection (Utermöhlen et al., 2001). In TAg-immunized BALB/c mice challenged with mKSA cells, CD4 + tumor-associated lymphocytes (TAL) secrete both typical Th1 cytokines as IFN-γ and IL-2 and typical Th2 cytokines, e.g. IL-4 and IL-10, over the whole course of tumor rejection.
1.4. Effects of IL-4 on CD8 + CTL
Interleukin-4 (IL-4) is a prototypic type 2 T helper (Th2) cytokine. Its major effects
are to promote differentiation of Th2 cells, thereby supporting humoral immune
responses. Moreover, IL-4 is a strong antagonist of Th1 cells and thus of cellular
immune responses (Seder et al.,1994). Despite these clearly defined functions of IL- 4, the effects of this cytokine upon antigen specific CTL are still ambiguous, because IL-4 has been reported to either promote or inhibit the generation of antigen-specific CD8 + cytotoxic T cells in different systems (Utermöhlen et al., 2001; J. Zerrahn et al., 1996, Miller et al., 1990; Erard et al., 1993; M. Croft et al., 1994; Noble et al., 1995;
Moran et al., 1996; Aleman et al., 2002; Bright et al 1996; Gooding et al., 1977;
Knowles et al., 1979; N. Kienzle et al 2002, 2005; Schuler et al., 2001, 1999). The most prominent example of unpredicted effects of IL-4 on CTL was reported by Jackson et al. who generated an ectromelia virus encoding murine IL-4 (Jackson et al., 2001). This IL-4-expressing virus caused acute mousepox accompanied by high mortality even in mouse strains which are resistant to wild type ectromelia virus. The massive increase in pathogenicity was found to be due to suppression of the CTL response by IL-4. Less dramatic suppressive effects of IL-4 upon CTL function during infection were observed in other systems when mice were treated either with exogenous IL-4 or with recombinant vaccinia virus expressing IL-4 (Aung et al., 2000). Mice treated with mAb neutralizing IL-4 during immunization mounted an enhanced CTL response following challenge with RSV (Tang et al., 1994). During Sendai virus infection IL-4 deficient (IL-4 -/- ) mice showed a potent response of cytotoxic T lymphocyte (CTL) recovered by bronchoalveolar lavage, while in the same animals the prevalence of virus-specific CTL precursors was consistently diminished in the spleen and in regional lymph nodes (Mo et al., 1997). On the other hand, no alterations in T cell activation or virus clearance could be detected in IL-4 -/- mice during infection with vaccinia virus or Lymphocytic Choriomeningitis (LCM) virus (Bachmann et al., 1995). Additionally puzzling was the observation that IL-4 can act as a growth factor for CD8 + T cells in vitro ( Miller et al., 1990; Noble et al., 1990)].
1.5. Effects of IL-10 on CD8 + CTL
IL-10 is of outstanding interest with regard to the modulation of CD8 + CTL, because this cytokine acts in many different systems as an inhibitor of cellular
immune responses, but it has also been reported to be a maturation factor for CTL in
other systems (Chen et al., 1991; Wang et al., 1994; Goillot et al., 1994; Giovarelli et
al.,1995; Sharma et al., 1999; Santin et al., 2000; Fujii et al., 2001).
Interleukin 10 (IL-10) acts strongly anti-inflammatory on cells of both the innate and the acquired immune system. It is secreted not only by various cell types of the innate and adaptive immune system but also by keratinocytes and intestinal epithelial cells (for review (Moore et al., 2001)). This puts IL-10 as a major player into the highly complex regulatory networks of immune responses. The most important function of IL-10 seems to be the inhibition of the production of pro-inflammatory cytokines by macrophages and dendritic cells. Thereby IL-10 acts at the interface between innate and adaptive immune responses as a regulator suppressing or down- modulating immune responses to microorganisms. This is most prominently proven by the phenotype of IL-10 deficient mice: IL-10 -/- mice develop severe immunopathology in response to colonization of their intestines by the physiologic gut microflora. Conventionally housed IL-10 -/- mice develop chronic enterocolitis within the entire intestinal tract, with the duodenum, proximal jejunum, and proximal colon being most severely affected by mucosal inflammation with extensive lymphoplasmocytic and histiocytic infiltration of the lamina propria (Kuhn et al., 1993).
IL-10 -/- mice kept under specific pathogen free (SPF) conditions lack inflammatory alterations in the small intestine and show lesions mainly in the proximal colon which are less severe than in conventionally housed mice (Kuhn et al., 1993). These data suggest that the inflammatory disease is triggered by enteric microorganisms.
Importantly, IL-10 -/- mice do not show spontaneous lymphoproliferative or inflammatory activity without contact to microorganisms or their products, as observed for example in FoxP3-deficient mice lacking regulatory T cells (Treg) (Fontenot et al., 2003). Thus, IL-10 is a main factor that fine tunes the delicate balance between sufficiently effective immune responses against microorganisms and immunopathologic damage of host tissues.
On T lymphocytes, IL-10 can act in at least two fashions: In an indirect mode, IL-10 inhibits in immature DC the expression of costimulatory and MHC class II molecules.
The resulting lack of inflammatory DC may inhibit Th1 inflammatory responses or even end in the induction of anergy in T cells. In a direct mode, IL-10 can inhibit production of cytokines and chemokines as well as chemotaxis of T lymphocytes.
However, even some stimulatory effects of IL-10 on T cells have been described
(Groux et al., 1998; Santin et al., 2000), so that the net effect of IL-10 or of IL-10
inhibition cannot easily be predicted in a given immunologic situation.
1.6. The experimental system to study the effects of inhibitors of cytotoxic effector molecules
Target cell resistance against CTL or NK cell mediated cytotoxicity of embryonic stem ES cell-derived teratomas is of particular interest for several reasons: For example, ES cell derived teratomas can be viewed as a model for the cancer stem cell hypothesis which became accepted for a growing list of tumors over the last few years (Andrews, et al. 2005). Thus, a stem cell-dependent tumor-model appears more physiologic than a model relying on a virus-transformed tumor cell line.
Teratomas are tumors that comprise disorganized tissue derived from all three embryonic germ layers. Undifferentiated ES cells were reported to form teratomas not only in immuno-defficient mice, but also in immunocompetent syngeneic and in immunocompetent allogeneic recipients (Koch, et al. 2008).
While transplants of undifferentiated ES cells will probably not be used for therapeutic purposes, a few contaminating undifferentiated ES cells in transplants of more differentiated ES cell-derivatives cannot be neglected, because as few as two ES cells (Lawrenz et al., 2004) can give rise to teratomas. Cancer stem cells are defined by the capacity for self-renewal (Thomson et al., 1998; Evans et al., 1981) and the potential to differentiate into any cell type of the specific tumor-type. Cancer stem cells are supposed to persist in tumors and survive conventional tumor therapy, giving rise to relapsing tumors. Therefore, development of specific therapies targeted at cancer stem cells may eradicate the truly tumorigenic cell type, preventing relapse.
We also resorted to this system, because our group already detected the expression
of cathepsin B, the specific inhibitor of perforin, and SPI-6, the specific inhibitor of
granzym B, in ES cells, and characterized the effects of these inhibitors in the
interaction of ES cells and CTL in vitro (Abdullah et al., 2007). In the present study
the interaction of ES cells with NK cells, i.e. the innate cytotoxic effector cells type, in
vitro and in vivo, was analysed. A better understanding of NK cell interactions with
tumors, recently attracted fast growing interest for several reasons. The most obvious
explanations are: (i) Use of NK cells against tumor cells does not require
identification of tumor-specific antigens, or antigen-specific immunization. (ii) Being
triggered by recognition of cells with low surface expression of MHC class I
molecules, NK cells might become the therapeutic approach to eliminate tumor cells
that lost MHC class I due to selective pressure of antigen-specific CTL therapy.
ES cells are known to express none or low levels of MHC class I molecules on their surface (Drukker et al., 2002, 2006; Bonde et al., 2006; Abdullah et al., 2007).
According to the “missing self hypothesis“ of NK cell activation (Ljunggren et al., 1990) ES cells should be ideal targets for NK cells. However, human (Drukker et al., 2002, 2006) or murine ES cells (Bonde et al., 2006) were reported to be poorly lysed by NK cells in vitro. Our group recently reported that ES cells, despite being fully recognized, are not susceptible to cytolysis by CD8 + CTL. Having revealed that ES cells express high levels of cathepsin B and SPI-6, the specific endogenous inhibitors of the cytotoxic effector molecules perforin and granzyme B, respectively, protecting them against lysis by CD8 + CTL.
This project aimed at revealing the involvement of SPI-6 and cathepsin B in the low susceptibility of ES cells to NK cells.
1.7. Objective
The aim of this project was to elucidate different approaches to enhance the effectiveness of tumor-specific immune responses and to further characterize
molecular and translational aspects of cytotoxic effector : target cell interactions
concerning the immune surveillance of cancer.
2. Materials and Methods I
2.1.Material
2.1.1. Cell lines
CGR8 ES cells were obtained from the European collection of cell culture (ECACC), ECACC No: 95011018.
HEK293T cells, L929 cells NCTC clone L13, C57SV and BALB/cSV fetal fibroblasts, SV40-transformed mKSA tumor cells and methylcholanthrene-induced MethA tumor cells are from the Institute for Medical Microbiology, Immunology and Hygiene, Medical Centre, University of Cologne.
2.1.2. Mice
Six to eight weeks old C57BL/6 and BALB/c mice were obtained form Charles River (Sulzfeld, Germany). 129P2/OlaHsd and Beige Mice were obtained form Harlan Laboratories (the Netherlands). Breeding pairs of IL-10 deficient (IL-10 -/- ) mice of the BALB/c strain were kindly provided by Werner Müller, Institute for Genetics, Cologne, Germany, and Donna Rennick, DNAX, Palo Alto, California (Kuhn et al., 1993). The mice were heterozygously mated so that wt littermates were used as controls.
Breeding pairs of perforin-deficient mice on the C57BL/6 background were a kind gift of Hans Hengartner, Institute of Experimental Immunology, University Hospital Zürich, Switzerland (Kagi et al., 1994). Mice with a T cell-specific inactivation of the IL-10 gene (IL-10 FL/FL CD4-Cre + ) were described previously (Roers et al., 2004).
Perforin-deficient and IL-10 FL/FL CD4-Cre + mice were backcrossed ten times to the BALB/c background in the animal facilities of the Center for Molecular Medicine Cologne. All mice were bred and kept strictly under barrier conditions and were used when 8 to 12 weeks old. Mice were housed under specific pathogens free conditions at the animal facility of IMMIH and fed with standard pellet food. Animal experiments were approved by the ethics committee of the Bezirksregierung Köln and were performed in accordance with the German animal protection law.
2.1.3. Plastic ware
Cell culture dishes Nunc
Pipettes CELLSTAR
Pipette tips CELLSTAR
Centrifugation tubes Falcon and Eppendorf
Glass materials Schott
2.1.4. Technical equipment
Appliance Name Supplier
Centrifuge 5417 R Eppendorf
Centrifuge Megafuge 1.oR Heraeus
ELISA reader MRX TC Dynex
Fluorescence microplate reader victor 1420 Wallc
Flowcytometer FACSCalibur BD
Gama counter COBRA II Canberra-P
Gel chamber Agagel Midi Biometra
Gel documentation apparatus Chemidoc BioRad
Incubator Heracell Heraeus
Microscopes TC SL Leica
Photometer Smart BioRad
Power supply EPS-3501 XL Pharmacia
Shaker Bühler Schüttler Johanna Otto
Sterile hood Herasafe (vertical) Heraeus
Thermocycler T3-Thermocycler Biometra
Ultracentrifuge Discovery 90SE Sorvall
2.1.5. Chemicals and reagents
All chemicals were off research grade. All Buffers and solutions were prepared by using deionised or bidistilled water from an EASYpure UV/UV water purification unit (Werner Reinstwassersysteme. Leverkusen), sterilized by autoclaving or sterile filtered with a 0,2 μm filter if necessary and stored at room temperature.
Acetic acid Sigma
Agar Neuform
Agarose BMA
CA-074 Bachem
CA-074Me Bachem
Crystal violet Merck
CTL BioRad
Dithiothreitol (DTT) Sigma
DMEM (Dulbecco MEM) Invitrogen
DMSO (dimethylsulfoxide) Sigma
DNA ladder 1kb plus Fermentas
DNA loading buffer (6x) Fermentas
dNTPs Peqlab
EDTA Sigma
EGTA Merck
Ethanol Merck
Ethidiumbromide Sigma
Fetal calf serum (FCS) Invitrogen
G418 PAA Lab
Gelatine type A Sigma
Glycerin Merck
Glycerol Sigma
Hanks’ Balanced Salt Solution Sigma
HEPES Serva
Hoechst 33258 Sigma
Isopropanol Sigma
KCl Sigma
L-glutamine Invitrogen
LIF ESGRO; Chemicon
Methyl cellulose Merck
MgCl 2 Invitrogen
Moninsin Sigma
mrIFN-γ R&D
Na 2 HCO 3 Sigma
NaCl Merck
NaHCO 3 Sigma
Non-essential amino acids Invitrogen
Paraformaldehyde Sigma
PBS (for cell culture) Invitrogen
Penicillin/Streptomycin Invitrogen
Polybren Sigma
Reverse Transcriptase Roche
RNAse inhibitor Roche
RT-buffer Roche
SDS Sigma
Sodium pyruvate Invitrogen
Taq DNA polymerase Invitrogen
TEMED Merck
Triton-X-100 Sigma
Trypsin-EDTA (10x) Invitrogen
Trypton Neuform
Tween Merck
Yeast extract Neuform
β-Mercaptoethanol Invitrogen, 0,02 in water, stored at 4°C
2.1.6. Cell culture medium, reagents and buffers
All buffers and reagents were made using deionised double distilled water from the EASY-pure UV/UF water purification unit.
2.1.6.1. Cell culture media
Cultivation medium for ES cells Glasgow MEM 90% (v/v) FCS 10% (v/v) L-glutamine 2 mM
ß-mercaptoethanol 50µM LIF 100U/ml
Cultivation medium for EB (EB medium) Iscove’s MEM+GlutaMAX 80% (v/v)
FCS 20% (v/v)
β-mercaptoethanol 100 µM
non-essential amino acids
Cultivation medium for C57SV, DMEM 95% (v/v) BALB/cSV fibroblasts, MethA tumor cells FCS 5% (v/v) mKSA tumor cells Penicillin 50mg/ml
Streptomycin 50mg/ml Freezing medium for cells Glasgow MEM 70% (v/v)
DMSO 10% (v/v) FCS 20% (v/v)
2.1.6.2. Cell culture reagents
Gelatine type A for coating cell culture plastics Gelatine type A 0.1% in dd H 2 O Incubation: 30 min, 37°C
Trypsin 1x 10ml of Trypsin 10x made up to 100ml using dd H 2 O
2.1.6.3. Bacteria culture media and reagents
LB (Luria-Bertani) medium 10g/l trypton, 5g/l yeast extract and 5g/l NaCl
LB agar: 10g/l aga, 10g/l trypton, 5g/l yeast extract and 5g/l NaCl
S.O.C medium (Invitrogen)
2.1.7. Reagents for molecular biology
Tris-EDTA (pH 8.0) Tris 10 mM, EDTA 1 mM in dd H 2 O
TAE (pH 7.8) Tris-HCl 40 mM, Acetic acid 5 mM, EDTA 1 mM,
in dd H 2 0
2.1.8. Antibodies
Antibody Application Provider Ms. Anti SSEA-1 (clone MC-480) FACS 1:1000 R&D PE-anti-H-2Kb clone AF6-88.5 FACS BD mAb GB12 against human granzyme B FACS Caltag CD3, CD8a, CD8b, TCRα/β, FACS BD TCRγ/δ, CD44, CD62L, CD69,
CD103
2.1.9. Primers for real time PCR GranzymeM
Grz.M Fr. 5’ TTG AGA CCC AGA TCA TTG 3’
Grz.M Rev. 5’ ATA CCC ACT TCC GAT GCA CA 3’
Grz.M P (6-FAM)CAC TCC CGC CCA TAC AT(TAMRA-6-FAM) (Operon) Serpin 6 gene expression assay (Appliedbiosystems)
Serpin9b gene expression assay (Appliedbiosystems) 18s rRNA gene expression assay (Appliedbiosystems) β-actin gene expression assay (Appliedbiosystems)
GAPDH gene expression assay (Appliedbiosystems) 2.1.10. Plasmids
Entry vector pENTER/siH1 Size: 4636 bp
Resistance gene: Kanamycin.
Destination vector pLPac/EGFP Size: 9564bp
Resistance gene: Blasticidin
(all plasmids were kindly provided by B. Yazdanpanah from IMMIH) pLPac/EGFP/sh-SPI-6 (kindly provided by Zeinab Abdullah) Packaging vectors
pLP1, pLP2 and the envelope plasmid pLP/VSVG (Invitrogen)
2.1.11. Kits
NK1.1. cell Isolation kit Miltany Biotec
ELISA mouse IFNγ OptEIA kit Becton Dickinson RNeasy Mini kit Qiagen
Quantitect reverse transkription kit Qiagen RiboGreen RNA quantification kit Molecular Probes QIAprep spin Minipräp kit Qiagen
Plasmid Maxi präp kit Qiagen PKH67 green Fluorecent Cell Linker kit Sigma for general cell membrane labeling
2.2. Methods 2.2.1. Cell Culture
Cell culture was performed under sterile conditions in a sterile hood with sterile media and plastics. Cells were cultivated in an incubator at 37°C, 5% CO 2 and humidified air.
CGR8 cells were maintained in tissue culture flasks coated with 0,1% gelantine in ES cell medium. Medium was changed daily and ES cells were passaged every 3-4 days.
Balb/cSV fibroblasts, C57BL/6 fibroblast , YAC cells, mKSA tumor cells and MethA tumor cells were maintained in tissue culture flasks in 5% DMEM.
2.2.2. In vitro differentiation of ES cells into embryoid bodies
For the in vitro differentiation of CGR8 ES cells into embryoid bodies, a single cell suspension of ES cells was adjusted to a final concentration of 2,5x10 4 cells/ml in EB medium.
20μl drops containing 500 cells were placed on the cover of petri dishes. After two
days the ES cells had formed cell aggregates that were transferred into bacterial petri
dishes to avoid adherence.
2.2.3. Cloning efficiency assay
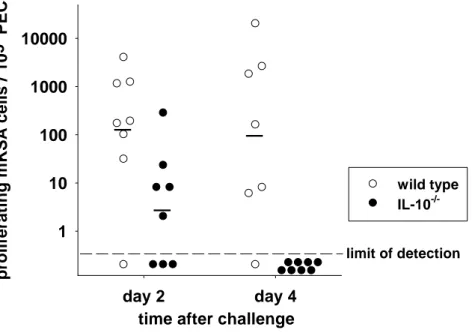
The elimination of mKSA tumor cells from the peritoneal cavity was assessed by a cloning efficiency assay. Briefly, peritoneal exudate cells were collected at the indicated days after challenge, adjusted to 10 6 Trypan blue excluding cells per ml and serially ten-fold diluted. Aliquots of each dilution were plated in 6-well plates and cultivated in complete medium for 8 days. Afterwards, the cells were fixed and stained with Crystal violett. Clonally expanded mKSA colonies were counted to calculate the number of proliferating mKSA cells that were contained within 10 6 peritoneal exudate cells at the day of the peritoneal lavage.
2.2.4. Production and purification of recombinant T-Ag
T-Ag was produced by infecting Sf 158 cells with recombinant baculovirus coding for full length SV40-T-Ag (Lanford et al., 1988), kindly provided by Dr. Ellen Fanning.
T-Ag was purified from cell lysates by immunoaffinity chromatography using PAb 108 coupled to CNBr-Sepharose. The purified protein was dialyzed against PBS/40%
glycerine and stored at -70oC.
2.2.5.Treatment of ES cells
2.2.5.1. Induction of MHC class I molecules on the surface of cells
To induce expression of MHC class I on the cell surface, cells were incubated with 20ng/ml IFNγ for 48 hours before the experiment. The expression of MHC class I molecules on the cell surface was measured by flow cytometry.
2.2.5.2. Blocking of Cathepsin B
ES cells were pre-treated with 10μM CA074 16 h prior to experiment.
2.2.6. PCR
2.2.6.1. RNA isolation
Total RNA was extracted from approximately 2x10 6 ES cells, day 5 EB cells, Balb/cSV fibroblasts, resting NK and activated NK cells using the RNeasy mini elute kit (Qiagen) according to manufacturers instructions (spinning protocol).
For the isolation of RNA from Placenta the RNeasy midi kit was used (Qiagen).
2.2.6.2. RNA quantification
Isolated RNA was quantified using the RiboGreen RNA quantification kit (Molecular Probes) in a 96-well microplate. 5μl RNA and 95μl TE buffer were distributed per well. RiboGreen reagent was diluted 1:200 and 100μl was added per well. Plates were incubated 2 min at room temperature and then excited at 458 nm.
The fluorescence emission intensity was measured at 525 nm using the fluorescence microplate reader (Wallac victor multilabel counter 1420). RNA concentrations were measured by comparing with a standard curve.
2.2.6.3. cDNA synthesis
To circumscribe RNA into cDNA the reverse ranscription kit Quantitect (Qiagen) was used according to the manufactures instructions.
2.2.6.4. Real time PCR (TaqMan)
Quantitative real-time PCR was performed with the TaqMan ABI-Prism 5700 Sequence Detection System (Applied Biosystems). Following the instructions of Applied Biosystems the optimal concentration for each primer pair and probe were determined. In each PCR-reaction negative and positive control templates were included. Reactions were carried out in 25μl mixture using the TaqMan Universal Master Mix (Applied Biosystems) according to the manufacturers instructions.
Components of the real time PCR reaction mixture were as follows:
2,5μl cDNA (final concentration: 5 ng/ml) 12,5μl PCR Master Mix
250μM Forward Primer 250μM ReversePrimer 300μM Fluorogenic Probe 8,5μl water
Total volume: 25μl
Individual steps:
50°C 120sec UDG PCR decontamination
95°C 120sec Taq start activation 40 Cycles :
95°C 15sec Denaturation
60°C 60sec Annealing and Extension
mRNA was calculated for each gene by using a standart curve. The value obtained for each gene was normalized to that of the housekeeping gene encoding GapDH and β-actin. Then the fold change was calculated using crossing threshold (Ct) values.
2.2.7.Treatment of mice
2.2.7.1. Immunization of mice with recombinant T-Ag and challenge with mKSA cells
Ten μg of purified T-Ag in PBS were injected twice i.p. in a one-week interval (days -14 and -7). Seven days after the second immunization (day 0), the animals were challenged by i.p. injection of 106 viable mKSA cells, which equals the 10,000- fold LD 50 of these tumor cells (Baschuk et al., 2007).
2.2.7.2. Depleting mice of CD4+ or CD8+ T lymphocytes
Groups of mice were i.v. treated with either a mixture of each 250µg rat mAb YTS191.1 and YTA3.1(Qin et al., 1987), or 500 µg rat mAb YTS169.4 (Cobbold et al., 1984) to deplete CD4+ or CD8+ T lymphocytes, respectively. As a control purified rat IgG (Sigma, Deisenhofen, Germany) was administered in some experiments. The time of the Ab injection relative to tumor challenge is given in the results section. mAb were produced, purified, used, and efficacy-controlled as described (Gegin et al., 1992).
2.2.7.3. Activation of NK-cells
To otain activated NK cells adult mice (6-8 weeks of age) were infected with the
LCMV, strain WE. Plaque forming units (PFU) were converted into infectious units
(IU) by multiplying PFU with a factor of 10. Mice were infected by intravenous (i.v. )
inoculation of 1x10 5 IU of the LCMV in 0,3 ml PBS with 5% penicillin/streptomycin (PS) and 1% fetal calf serum (FCS) into the tail vain.
Or Mice were intraperitonelly (I.p.) injected with 250 μg polyI:C in 500μl PBS. 48 hours later mice were sacrificed and activated NK cells were isolated.
2.2.8. Isolation of effector cells
2.2.8.1. Preparation of resting and activated NK cells from spleens
Mice were sacrificed and their spleens were removed. Single cell suspension was optained by passing spleens through a 70μm pore size cell mesh in cold RPMI.
Cell suspensions were centrifuged at 1000 rpm for 5 min at 4°C. Cell pellet was resuspended in 10 ml cold 0,2% NaCl to lyse erythocytes and after 20 seconds the lysis was stopped with 1,6% NaCl. Cells were pelleted again by centrifugation and resuspended in RPMI. Cell number was determined using trypan blue exclusion method in a Neubauer chamber. NK cells were enriched from the splenic cell suspension using anti NK monoclonal antibodies conjugated to magnetic beats (Miltany Biotec) following manufactures instructions. Following the incubation time cells were washed 3 times and loaded on large MACS columns under a magnetic field. The columns were rinsed several times, removed from the magnetic field and NK cells were eluated in sorting buffer. Cells were pelleted in RPMI and cell number was determined using trypan blue exclusion method in a Neubauer chamber.
2.2.8.2. Isolation of Tumor Associated Lymphocytes ( TAL)
T-Ag-immunized or naive mice were inoculated i.p. with 106 mKSA tumor cells.
Peritoneal exudate cells (PEC) were recovered by rinsing the peritoneal cavities with cold PBS.
2.2.8.3. Isolation of mouse small intestinal intraepithelial lymphocytes (IEL)
IEL were prepared according to Montufar-Solis et al. with minor modifications. In
brief, after removal of small intestines, Peyers patches were dissected. Fecal material
was flushed off with RPMI 1640 supplemented with FCS (10% v/v), 100 U/ml
penicillin-streptomycin and 5x10 -5 M 2-ME. Subsequently, intestines were opened
longitudinally and cut into pieces of 0.5cm length. The tissue fragments were rinsed
several times in Ca 2+ /Mg 2+ -free PBS and stirred at 37°C for 20 min in Ca 2+ /Mg 2+ -free
PBS containing 5mM EDTA and 2mM DTT. The resulting cell-suspensions were
vortexed for 15 seconds, and supernatant was collected. The last step was repeated and supernatants were combined before centrifugation at 1000 rpm, 4°C for 5min.
Cells were filtered through a 10 ml syringe barrel containing wetted nylon wool and centrifuged again. The cell pellet was suspended in 40% isotonic Percoll, layered on top of a 70% Percoll cushion, and centrifuged for 20 min at 600xg. IELs were harvested from the Percoll interface and suspended in complete RPMI.
2.2.9. Magnetic cell sorting
NK cells, TAL or IELs were enriched from the splenic cell suspension, peritoneal exudates cells or intestinal single cell suspension using anti NK monoclonal antibodies, CD4 or CD8 mAb conjugated to magnetic beats (Miltany Biotec) following manufactures instructions. Following the incubation time cells were washed 3 times and loaded on large MACS columns under a magnetic field. The columns were rinsed several times, removed from the magnetic field and NK cells were eluated in sorting buffer. Cells were pelleted in RPMI and cell number was determined using trypan blue exclusion method in a Neubauer chamber.
2.2.10. Chromium release cytotoxic assay 2.2.10.1.Effector cells
Effector cells were magnetically enriched as described in 2.2.9. Effector cell number was adjusted to 3x10 6 cells/ml in RPMI, 200μl were dispensed in U-bottom 96 well plates in four replicants and serial dilutions of 1:2 in RPMI were made three times.
2.2.10.2. Target cells
To obtain the specific cytotoxic activity of effector cells, target cells were
adjusted to 10 6 /ml and then incubated with 50μCi 51 CR for 60minutes at 37°C. Cells
were washed three times to remove the extra cellular 51 Cr. Cell numbers were
adjusted to 3x10 4 /ml and 100μl of the target cell suspensions were dispensed to the
previously distributed efector cells in the 96-well plate to obtain Effector : Target cell
ratios of 100:1, 50:1, 25:1and 12,5:1. The spontaneous release of each 51 Cr-labeled
target cell was determined in 8 wells without effector cells. In these samples the
spontaneous release was less than 9% of the maximum release. The maximal
release was determined by the total target cell lysis in 1,6% Triton-X-100 in water.
After 4 h incubation at 37°C, cells were spun down and 100μl of the cell-free supernatants were harvestet. A probe from each well were measured in a gamma- counter to detect the amount of 51 Cr as counts per minute (cpm). Mean of the four replicates were calculated with correction for background lysis, as followes for esch effector to target cell ratio:
% specific lysis = (cpm sample -cpm spontan ) / (cpm maximal -cpm spontan ) x 100 2.2.11. Flow cytometry
2.2.11.1. Surface staining
CD8 + IEL, were phenotypically characterized by surface staining with mAb specific for CD3, CD8a, CD8b, TCRα/β, TCRγ/δ, CD44, CD62L, CD69 or CD103. A total of 1x10 6 cells was washed with PBS, 0,5% BSA and stained for 15 min with 1μg of fluorochrom-labeled monoclonal antibody.
2.2.11.2 Flow cytometry analysis of MHC class I expression
Flow cytometry analysis of MHC class I expression on the surface of cells. Single cell suspensions of ES or EB cells were stained with monoclonal antibody specific for H-2K b or isotype control antibodies and were analyzed by FACScan and CellQuest software.
2.2.11.3. Flow cytometric analyses, quantification of cytokines and of cytokine- secreting T cells, and histopathology
For detection of intracellular IFN-γ , granzyme B and A CD8 + T-cells were immunomagnetically enriched from PEC and were incubated on a confluent monolayer of mKSA cells in six-well plates (Nunc, Roskilde, Denmark) for 1 h.
Thereafter Golgi-Stop reagent was added, and the cultures were incubated for further
5h (only for IFN-γ). The T cells were harvested by gently rinsing the plates with
medium, stained with anti-CD8 mAb, fixed, permeabilized and stained for intracellular
IFN-γ, granzyme B or granzyme A. The frequency of CD8 + IFN-γ + or CD8 + granzyme
B + or A + T-cells was determined with a FACSCalibur (BD Biosciences, Heidelberg,
Germany) flow cytometer. TAg-expressing mKSA tumor cells were visualized in
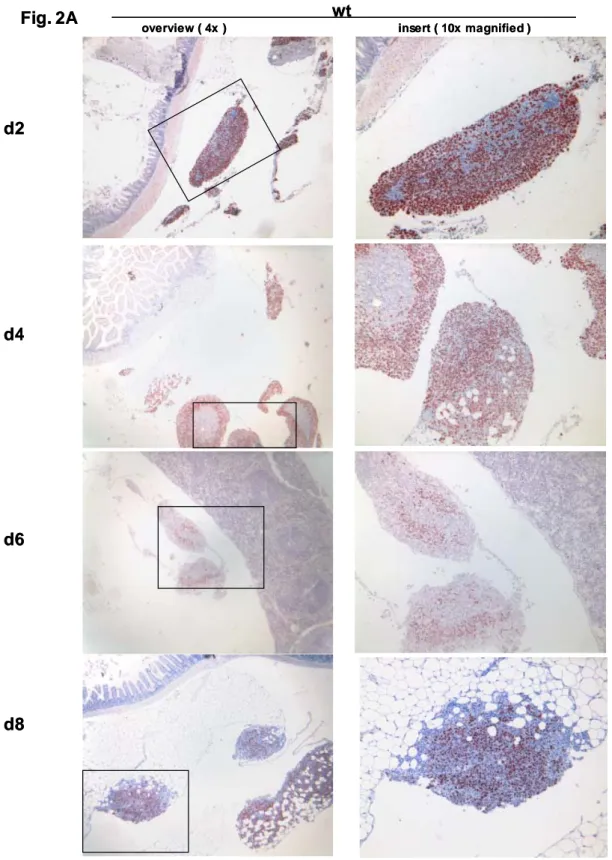
specimens of intraabdominal tissues and organs by immunostaining with polyclonal
rabbit antiserum R15 against Tag or CD8-specific mAb.
2.2.12. Quantification of cytokines and cells secreting cytokines
For the quantification of IFN-γ, IL-4 or IL-10 secreted by resting or activated NK cells or TAL, IFN-γ, IL-4 or IL-10 specific ELISA kits (R&D) were used following the manufacturer's instructions. Cocultures were centrifuged for 3 min at 310 g at 4°C and cell-free supernatants were collected and stored at -80°C if test was not performed immediately.
The fraction of CD8 + TAL or IEL secreting IFN-γ in response to mKSA tumor cells was determined by an IFN-γ-specific Elispot assay (R&D systems) on day 8 or 2 after challenge of TAg-immune mice with 10 6 mKSA cells. The immunomagnetically enriched CD8 + TAL or IEL were incubated at graded densities with 10 5 mKSA cells and the assays were developed according to the instructions of the manufacturer.
2.2.13. Quantifying enzymatic activity 2.2.13.1. GzmM specific activity
Enzymatic activity of granzyme M in the lysates of 5x10 5 resting NK cells, poly I:C activated NK cells and of CD8 + CTL on day eight after LCMV infection was analysed by cleavage of the chromogenic substrate Boc-Ala-Ala-Met-SBzl. Substrate cleavage was followed by using absorption 405nm.
2.2.13.2. GzmA- and -B-specific enzymatic activity
In lysates of CD8 + TAL the gzmA- or -B-specific activity was determined by using substrate H-D-Pro-Phe-Arg-p-nitroanilide (S2302; manufactured by Chromogenix, Lexington, MA, USA) or N-acetyl-Ile-Glu-Pro-Asp-p-nitroanilide (Biomol, Exeter, UK), respectively, according to instructions of the manufacturers.
2.2.14. Transient down regulation of Serpin-CI in ES cells by RNAi 2.2.14.1. Preparation of siRNAs
Two different siRNAs coding for SPI-CI and negative controls, including Alexa Fluor 488 at the 3’ prime end of the sense stand (Qiagen) with the following Target sequences were used:
1.) TAA ATT TAA ATT TAC AAA CAA
Sense : r(AAU UUA AAU UUA CAA ACA A)dTdT
Antisense : r(UUG UUU GUA AAU UUA AAU U)dTdT
2.) TGC AAC TTA TCT TGT AAC AAA
Sense: r(CAA CUU AUC UUG UAA CAA A)dTdT Antisense: r((UUU GUU ACA AGA UAA GUU G) dTdT
Both siRNAs were diluted in siRNA suspension Buffer to a final concentration of 20μM and stored at -20°C according to the manufacturers instructions.
2.2.14.2. Transfection of ES cells with siRNAs
On the day of transfection 5x10 5 CGR8 cells were plated on a 6cm gelantine coated plate. Immediately 0,5μg siRNA was diluted in ES cell medium, mixed with Hyperfect (Qiagen) as a transfection reagent and incubated 10 min at room temperature. After the incubation time the transfection mix was distributed drop wise on the cell suspension.
After a 24 h incubation time the medium was changed, and 48 h later ES cells were trypsinized and analysed for the down regulation of SPI-CI by TaqMan-PCR or used as target cells in the chromium release assay.
2.2.15. Stable down regulation of Serpin-CI in CGR8 cells
For stable expression of siRNA in ES cells a Lentiviral vector was constructed.
2.2.15.1. Design of shRNA constructs
The murine SPI-CI specific and the murine specific small hairpin RNA were designed following the pSUPER RNAi system of OligoEngine. Targeted sequences are specific for murine SPI-CI and SPI-6/SPI-CI as no other matche was found using the BLAST database of the national Center for Biotechnology Information (htt://www.ncbi.nlm.nih.gov).As a negative control non specific shRNA (scrSPI-CI) was designed. The oligonucleotides were as follows:
for SPI-CI
M_Serbin9b_si-SP: 5’-GAT CCC CCA ACT TAT CTT GTA ACA AAT TCA AGA GAT TTG TTA CAA GAT AAG TTG TTT TTA-3’
M_Serbin9b_si-ASP: 5’-AGC TTA AAA ACA ACT TAT CTT GTA ACA AAT CTC
TTG AAT TTG TTA CAA GAT AAG TTG GGG-3’
Serpin_scr_SP: 5’-GAT CCC CAT ACT AGA ATT CAT CAA CTT TCA AGA GAA GTT GAT GAA TTC TAG TAT TTT TTA-3’
Serpin_scr_ASP: 5’-AGC TTA AAA AAT ACT AGA ATT CAT CAA CTT CTC TTG AAA GTT GAT GAA TTC TAG TAT GGG-3’
For SPI-6/CI
M_Serbin6/9b_si-SP: 5’-GAT CCC CCT TGT GAA GTC CTC CAA ACT TCA AGA GAG TTT GGA GGA CTT CAC AAG TTT TTA-3’
M_Serbin6/9b_si-ASP: 5’-AGC TTA AAA AGA ACA CTT CAG GAG GTT TGT CTC TTG AAC AAA CCT CCT GAA TGT TTC GGG-3’
Each sense an anti-sense primer pair was annealed to generate a double-stranded oligonucleotide by mixing 3 μg of each oligo with 5μl of 10x annealing buffer and PCR water to a final volume of 50μl. The mixture was incubated 4min at 95°C, 10min at 70°C, slowly cooled down to room temperature and then stored at-20°C.
2.2.15.2. Ligation of the complementary DNA into the pENTR/siH1 plasmid Following linearization of the pENTR/siH1 plasmid by BglII and HindIII restriction enzymes, the linearized plasmid was purified on 1% agarose gel (fragment size 4,400 bp) using gel extraction kit (Qiagen) and concentration was adjusted to 500 ng/µl. For the ligation of the annealed oligos into the linearized plasmid 2 µl of the annealed oligos were mixed with 1 µl T4 DNA ligase (Invitrogen), 1 µl of the ligase buffer (Invitrogen), 1 µl of the linearized plasmid and 5 µl water. Mixture was then incubated overnight at room temperature.
Recombinated vectors were then transformed into chemically competent DH5α by adding 5 µl of the ligation reaction to one aliquot (100 µl) of cells and incubated for 30 min on ice, 95 sec at 42°C and finally for 3 min on ice. Cells were centrifuged for 2 min at 1000 g and 500 µl of the supernatant was discarded. The pellet was resuspended in the rest of the supernatant and plated on LB agar containing 50 mg/ml kanamycin and incubated for 24 h at 37°C.
On the next day several colonies were picked and 3ml of LB broth containing
50 mg/ml kanamycin were inoculated for each colony and grown overnight at 37°C
with shaking. Plasmids were purified using the mini prep kit (Qiagen), eluted in water
and stored at -20°C. Positive clones were checked for the presence of the insert by
restriction digestion with the BglII and HindIII enzymes. Positive clone gives rise to two fragments 227 bp and 4 kb.
Fig.1. pENTR/siH1 vector
pENTR/siH 4636bp
kanR/neoR
mDD-Stuffer
SV40 polyA HSV-TK
attL1
attL2
SV40 prom
P-H1
kanR prom SV40 ori
pUC
attL1
attL2
subcloned region
Hi dII BglI
2.2.15.3. Construction of the destination vector
For the construction of the destination vector the Lentiviral vector pLenti6/EGFP was chosen. EGFP was cut out and firefly luciferase was cloned in. The oligonucleotides for firefly luciferase were as follows:
fw primer ffluc: 5 -GAT CGC TAG CGA GAA CGG TAC CAT GGA AGA - 3 rev primer ffluc: 5 -GAT CCC GCG GTA CAA TTT GGA CTT TCC GCC - 3
2.2.15.4. Recombination of the entry vector into the destination vector using the Gateway system
For a stable transcription of the SPI-CI-specific shRNA, the entry plasmids were cloned into the Lentiviral vector pLenti6 /ffluc using the Gateway system (Invitrogen).
In 200 µl PCR microtubes, 1.5 µg of entry plasmid, 1.5 µg of destination vector, 1 µl
of 5x LR Clonase II enzyme (Invitrogen) and 1 µl TE-buffer pH 8 were incubated
overnight at room temperature. On the next day 1 µl of proteinase K was added and
tubes were incubated at 37°C for 15 min.
Fig.3. shRNA expr
essing Lentiviral vector pLPac/ffluc/sh-SPI-CI
pLPac/EGFP/sh-SPI-6 8411 bp
blaR
EGFP PAC
RSV/5' LTR
deltaU3/3' LTR
V5
HIV-1 packaging RRE
SV40 pA
SV40
CMV bla
pUC Donor
acceptor acceptor
attB1 attB2
pLPac/EGFP/sh-SPI-6 8411 bp
blaR
EGFP PAC
RSV/5' LTR
deltaU3/3' LTR
V5
HIV-1 packaging RRE
SV40 pA
SV40
CMV bla
pUC Donor
acceptor acceptor
attB1 attB2
pLPac/ffluc/sh-SPI-CI 9182 bp
ffluc
RSV/5' LTR
pLPac/EGFP
9675 bp CmR
ccdB blaR
EGFP PAC
deltaU3/3' LTR
V5
HIV-1 packaging RRE
SV40 pA
SV40
CMV bla
pUC Donor
acceptor acceptor
attR1
attR2
Fig.2. destination vector
[modified by B. Yazdanpanah from the pLenti/delta UBC/V5-DEST vector from Invitrogen]
pLPac/ffluc 10446 bp
ffluc
For the production of Lentivirus particles the ViraPower TM Lentiviral expression system (Invitrogen) was used. HEK293T cells were detached and single cell suspension was adjusted to approximately 6x10 5 cell/ml in DMEM (without G418). In a 10 cm petri dish, 10 ml of the cell suspension was applied and directly co transfected with 3 µg pLPac/ffluc/sh-SPI-CI or pLPac/ffluc/scr-shSPI-CI, 1 µg of each of the packaging plasmids pLP1, pLP2 and the envelope plasmid pLP/VSVG (Invitrogen).
Supernatants containing the virus were collected after 48 h and 72 h, pooled, centrifuged for 15 min at 600 g at 4°C and filtered using 0.45 µm filters to remove any cells or cell debris. To enrich for virus, supernatants were centrifuged for 2 h at 60000 g at 4°C in an ultracentrifuge (Beckman). Supernatants were discarded and pellets were resuspended in 1 ml PBS for each 20 ml start volume. Aliquots of 100 µl were then stored at -80°C.
2.2.15.5. Transduction of CGR8 ES cells
The day prior to transduction, 5 × 10 5 CGR8 ES cells were plated in 10 cm petri dishes coated with gelatine. The next day, Lentivirus stocks were thawed on ice and virus titers were adjusted to 1x10 5 TU/ml in ES cell medium. 5 ml of the virus solution were added to each plate together with 10 µg/ml of polybren (Sigma). Cells were plated and incubated at 37°C for 48 h, later cells were detached and a single cell suspension of 2.5 x10 3 cell/ml was made in ES cell medium containing 4,5 µg/ml blasticidin. In 96-well plates coated with gelatine 100 µl of the selection medium was dispensed per well. 100 µl of the neat cell suspension was dispensed in the first well 1:2 serial dilutions were made by dispensing 100 µl in each step. Single-cell colonies were isolated and plated in 6 cm plates and selected further for blasticidin resistance.
After 14 days, SPI-CI expression was assessed in different clones using real time PCR.
2.2.16. In vivo bioluminescence imaging
mKSA cells stably expressing luciferase were generated by transduction with a
recombinant lentivirus coding for luciferase of Renilla renifares. This virus was
constructed from a PCR derived fragment encoding the luciferase (Promega GmbH,
Mannheim, Germany) cloned into an entry vector (Invitrogen) and recombined with
the gateway destination vector p-lenti Dest6/V5 (Invitrogen) according to the
manufacturer’s instructions. This construct and packaging plasmids were used to co-
transfect the HEK 293 FT producer cell-line. Supernatant containing lentiviral particles was harvested and used to tranduce mKSA tumor cells from which positive clones were selected with 10μg/ml Blasticidin (Invitrogen).
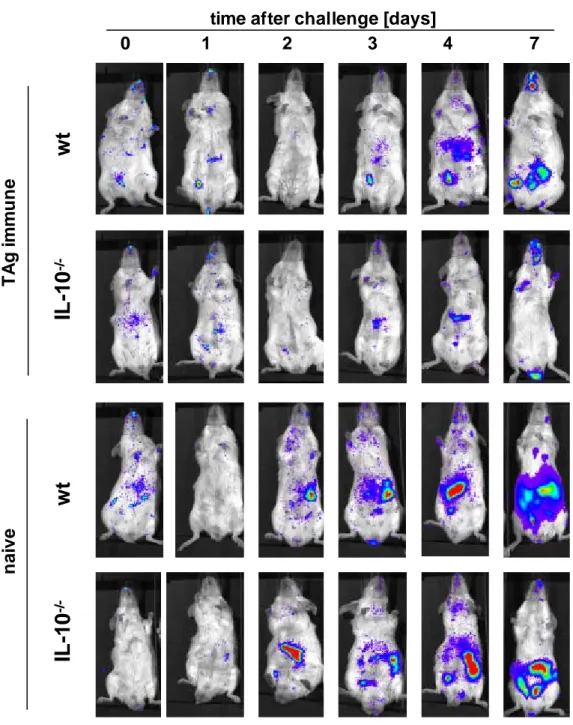
Dissemination of Renilla luciferase-expressing mKSA cells within the peritoneal cavity was monitored non-invasively by bioluminescence imaging with the in vivo imaging system IVIS (Xenogen). Mice were i.v injected with coelenterazine (Promega) at a dosage of 1,5 μg/g bodyweight, anesthetized with isoflurane and imaged for bioluminiscence for 1min exposure time. Optical images were analyzed by IVIS living image software package.
2.2.17. Cytotoxic in vivo assay
Wild type ES cells, shSPI-6 ES cells, shSPI-CI ES cells, shSPI-6/SPI-CI cells, scrambled control ES or YAC cells were labelled with PKH67, according to the manufacturers instruction, and adjusted to 2x10 7 cells per ml. Activated or resting C57BL/6 mice or perforin -/- or beige mice were injected with 1x10 7 cells, of one cell type in 0,5 ml per mouse, by intravenous inoculation. 30 minutes and 4 hours after inoculation, mice were killed and the total number of living fluorescent cells per spleen was ascertained by FACS-Analysis.
2.2.18. statistical Analysis
For statistical Analysis, the data were subjected to two-tailed Student’s t-test. The
survival data were analysed according to Kaplan-Meier and statistical significance
was determined by log-rank tests.
3. RESULTS I
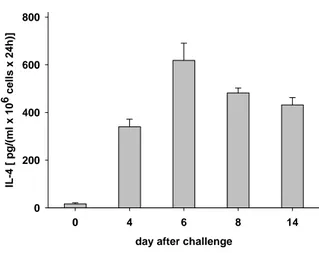
3.1. CD4 + TAL from TAg immune BALB/c mice secrete IL-4 during antigen- specific rejection of mKSA tumor cells
Primary CD4 + T cells, harvested by peritoneal lavage from the tumor site between days 4 to 14 after i.p. challenge of TAg-immune BALB/c mice with 10 6 viable mKSA tumor cells, secrete large amounts of IL-4 (Fig. 1). IL-4 secretion correlates with the immune response mounted against mKSA cells, as CD4 + T cells harvested before challenge with mKSA tumor cells (Fig. 1, day 0 of tumor rejection) secrete only minute amounts of IL-4. Interestingly, CD8 + T cells did neither spontaneously nor in response to stimulation with mKSA cells or with PMA/ionomycin secrete IL-4 as determined by ELISA (data not shown).
day after challenge
0 4 6 8 14
IL-4 [ pg/(ml x 106 cells x 24h)]
0 200 400 600 800
FIG. 1. Primary CD4
+TAL from TAg-immunized BALB/c mice secrete IL-4 after challenge with mKSA.
BALB/c mice were immunized on days -14 and -7 by i.p. injection of 10μg TAg and challenged i.p. on
day 0 with 10
6mKSA cells. CD4
+T cells were immunomagnetically enriched from peritoneal exudate cells
collected prior to challenge (day 0; cells pooled from 15 mice) or on days 4, 6, 8, or 14 after challenge
(pooled from 5 mice per day). The CD4
+TAL were kept at a densitiy of 1 x10 cells/ml in complete RPMI
6medium without any further stimuli for 24h. The contents of IL-4 in the cell-free supernatants of these
cultures were determined by ELISA. Shown are the means and standard error of the mean of three
independent experiments.
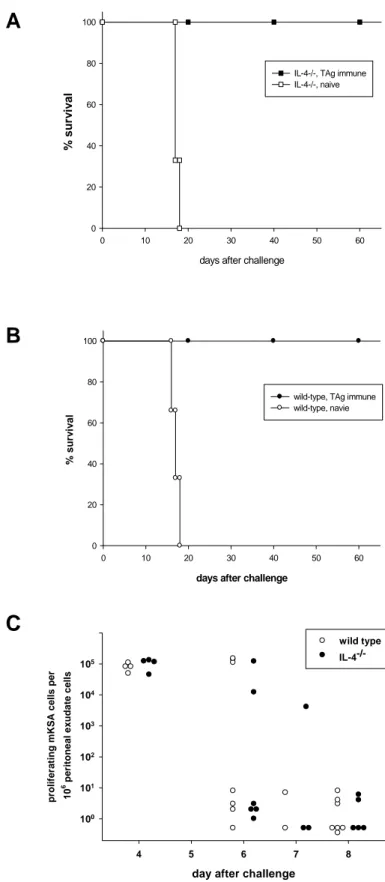
3.2. IL-4 is not required for the rejection of mKSA tumor cells by TAg-immune BALB/c mice
In order to investigate the biological relevance of IL-4 secreted by CD4 TAL during +
TAg-specific rejection of mKSA tumor cells in BALB/c mice, the survival of TAg- immunized IL-4 -/- and wild type (wt) BALB/c control mice was monitored. Both TAg- immunized IL-4 -/- and wt mice survived an i.p. challenge with 10 mKSA tumor cells 6 without any clinical signs of tumor growth for more than 60 days after challenge (Fig.
2A and B). Non-immune IL-4 -/- , as well as wt mice died between days 16 to 20 after
challenge. Similarly, the maximal intraperitoneal tumor burden on day 4 after
challenge as well as the kinetics of tumor cell elimination were comparable for TAg-
immune IL-4 -/- and wt mice (Fig. 2C). These data clearly indicate that IL-4 is not
essential in TAg-immune BALB/c mice for rejection of a dose of mKSA tumor cells
equalling the 10,000-fold LD 50 (data not shown) of these cells in naïve mice, although
this cytokine is secreted in large amounts by CD4 + TAL during this immune
response.
A
B
FIG. 2. TAg-immune IL-4
-/-BALB/c mice are fully protected against challenge with 10
6viable mKSA tumor cells. (legend on next page)
days after challenge
0 10 20 30 40 50 60
% surv iv al
0 20 40 60 80 100
IL-4-/-, TAg immune IL-4-/-, naive
days after challenge
0 10 20 30 40 50 60
% survival
0 20 40 60 80 100
wild-type, TAg immune wild-type, navie
C
day after challenge
4 5 6 7 8
proliferating mKSA cells per 106 peritoneal exudate cells
wild type IL-4-/-
100 101 102 103 104 105
FIG. 2. TAg-immune IL-4
-/-BALB/c mice are fully protected against challenge with 10
6viable mKSA tumor cells.
Groups of IL-4
-/-and wt BALB/c mice were immunized on days -14 and -7 by i.p. injection of 10μg TAg
and challenged i.p. with 10
6mKSA cells on day 0. Survival of (A) IL-4
-/-and (B) wt mice (immune n=5,
non-immune n=3) was monitored daily up to 65 days after challenge. (C) On the indicated days after
challenge, peritoneal exudate cells harvested by peritoneal lavage were plated in ten-fold serial dilutions
on 6-well plates. After cultivation for 8 days the cells were fixed and stained with crystal violett and clonal
colonies of mKSA cells were counted. Shown are cumulative data from three independent experiments
with each symbol representing an individual mouse.
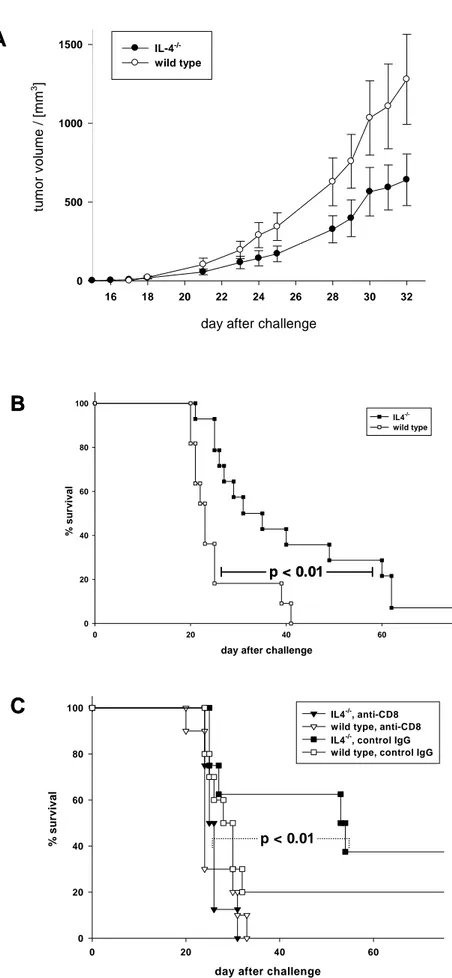
3.3. Enhanced resistance of naive IL-4 -/- mice to challenge with low doses of mKSA cells
To further investigate the biological relevance of IL-4 secreted during rejection of mKSA tumor cells in BALB/c mice, naive mice were challenged with low doses of mKSA cells. In preliminary experiments we established that i.p. inoculation of 100 viable mKSA cells into naive BALB/c mice is lethal for about 50% of the mice between days 30 to 50 after challenge (data not shown). In naïve IL-4 -/- mice challenged s.c. with 10 2 mKSA tumor cells a slightly retarded tumor growth as compared to wild-type mice was observed (Fig. 3A). Naive IL-4 -/- and wild type mice then were challenged i.p. with 10 3 viable mKSA cells. As shown in Fig. 3B, IL-4 -/- mice challenged with this tumor cell dose had a significant advantage in survival time over wild type mice. Furthermore, depleting naive IL-4 -/- mice of CD8 + T cells by injecting a CD8-specific mAb one day prior to challenge with mKSA cells abolished this effect completely as compared to naive IL-4 -/- mice treated with control IgG (Fig.
3C). This finding clearly indicates that the prolonged survival of naive IL-4 -/- mice is
dependent on CD8 + T lymphocytes.
B
day after challenge
0 20 40 60
% survival
0 20 40 60 80 100
IL4-/- wild type
FIG. 3A
C
day after challenge
16 18 20 22 24 26 28 30 32
tu mo r vol u me / [mm
3]
0 500 1000
1500 IL-4-/-
wild type
day after challenge
0 20 40 60
% s u rv iv a l
0 20 40 60 80
100 IL4-/-, anti-CD8
wild type, anti-CD8 IL4-/-, control IgG wild type, control IgG
p < 0.01
p < 0.01
B
day after challenge
0 20 40 60
% survival
0 20 40 60 80 100
IL4-/- wild type
FIG. 3A
C
day after challenge
16 18 20 22 24 26 28 30 32
tu mo r vol u me / [mm
3]
0 500 1000
1500 IL-4-/-
wild type
day after challenge
0 20 40 60
% s u rv iv a l
0 20 40 60 80
100 IL4-/-, anti-CD8
wild type, anti-CD8 IL4-/-, control IgG wild type, control IgG
p < 0.01 p < 0.01
p < 0.01
FIG. 3. Tumor growth following s.c. inoculation and survival of mice after i.p. injection of mKSA
-/-