MEU Programme
Minorities in the EU
The Aspect of Culture in the Social Inclusion of Ethnic Minorities
Evaluation of the Impact of Inclusion Policies under the Open Method of Co-ordination in the European Union:
Assessing the Cultural Policies of Six Member States
Final Report Estonia
An Evaluation Project under the EU’s Social Protection and Social Integration Policy
By Aksel Kirch, Tarmo Tuisk and Mait Talts , Institute for European Studies Audentes University, Tallinn, Estonia
October 2006
EUROPEAN CENTRE FOR MINORITY ISSUES (ECMI) Schiffbruecke 12 (Kompagnietor) D-24939 Flensburg
The Aspect of Culture in the Social Inclusion of Ethnic Minorities
Evaluation of the Impact of Inclusion Policies under the Open Method of Co-ordination in the European Union:
Assessing the Cultural Policies of Six Member States
Final Report Estonia
By Aksel Kirch, Tarmo Tuisk and Mait Talts,
Institute for European Studies Audentes University, Tallinn, Estonia
October 2006
ECMI Working Paper # 30
European Centre for Minority Issues (ECMI) Director: Dr. Marc Weller
© 2006 European Centre for Minority Issues (ECMI)
Published in March 2006 by the European Centre for Minority Issues ISSN: 1435 - 9812
TABLE OF CONTENTS
I. Executive Summary ……….7 II. The main policy direction for employment enhancement and poverty reduction
according to the NAP for Social Inclusion (2004-2006)……….…………..11 III. The preconditions created by Estonia’s economic growth………..16 IV. New Risk Groups: Integration of Russian Unemployed Youth. Study in Tallinn &
Harjumaa area and Ida-Virumaa county………..…..21 V. Estonian Context of Bilingual Education Today………..41 VI. Proposals for improvement of social inclusion action plan for years 2006-
2008………...……...47 Appendixes:
1) Focus Group Inteview: Students of Audentes University……….…59 2) Focus Group Interview: Russians………..………70 3) Interview with the representatives of Ida-Virumaa Labour Market Board 8.5.2006 ...……….……..77 4) Interview with the representatives of Labour Market Board of Tallinn and
Harjumaa18.5.2006...……...…………...83 5) Interview with the leading specialists of the Ministry for Education and Research at Ministry’s Tallinn Representation on 2.6. 2006...……….94 6) The questionnaire of sociological survey “Labour and unemployment 2006” (in
Estonian)...………...…103 7) The correlation matrix of the survey of young unemployed
(N=241)………111
Foreword and Acknowledgements
This Working Paper is one in a series of country reports submitted under the ECMI project “The Aspect of Culture in the Social Inclusion of Ethnic Minorities: Assessing the Cultural Policies of six Member States of the European Union” (hereafter OMC Project).
The OMC Project was conceived by the European Centre for Minority Issues (ECMI) and established with the generous support of the European Commission’s Directorate of Employment, Social Affairs and Equal Opportunities and under the European Union’s Social Protection and Social Integration Policy (Grant Agreement VS/2005/0686). The present Working Paper was researched and authored by colleagues at the Institute for Ethnic Studies, Ljubljana, Slovenia.
The OMC Project evaluates the National Action Plans (NAPs) of the Czech Republic, Estonia, Latvia, the Slovak Republic, Slovenia and Sweden under the European Union’s Open Method of Co-ordination (OMC) on Social Inclusion in terms of cultural policies and their impact on the social inclusion of ethnic minorities. The OMC Project is a twelve-month effort which began in December 2005. It focuses on three domains of social exclusion:
• Education,
• The media, and
• Public participation.
The aim of the OMC Project is to enhance cultural policies and NAPs with the overall goal to promote greater inclusion of members of ethnic minorities and Roma/Sinti groups in the socio-economic life of the European Union. The specific purpose of the OMC Project is to evaluate the effectiveness and cost-effectiveness of these policies in the six member states through the piloting of an index of Common Inter-Cultural Indicators (CICIs).
The problem of indicators has been a central part of the social policies adopted under the Lisbon Strategy (2000) including the OMC on Social Inclusion and ongoing efforts to develop and refine social indicators continue under the auspices of the European Commission. One of the main objectives of the OMC Project is to contribute constructively to this effort in the area of cultural indicators.
The parties most deserving of recognition for the contents of these Working Papers are the members of the six country research teams who are listed on the front page of each report. ECMI would like to thank every member of these teams for their hard work and continued interest and support for the OMC Project. The research teams have benefited from consultation with several external experts during the research. First and foremost, the OMC Project and the research for the country reports could never have been conceived without the unique modelling of effectiveness and cost-effectiveness as well as the personal and energetic dedication of Prof. Francois Grin, Director of the “Economics- Language-Education" Observatory at the University of Geneva, formerly Acting and Deputy Director of ECMI. At the same time, the application of Prof. Grin’s model could
not have been possible without the assistance and ever so patient didactic help of Mr.
Michele Gazzola, of the “Economics-Language-Education" Observatory at the University of Geneva. ECMI owes much to these two experts on the economics of language policies.
Credit also goes to Dr. Andreas Hieronymus of the Institute for Migration and Racism Research, Hamburg and Dr. Deborah Mabbett of the School of Politics and Sociology, Birkbeck College, University of London both of whom showed keen interest in seeing the OMC Project getting off the ground.
Within ECMI a number of dedicated persons who have worked with the OMC Project from the beginning deserve special thanks: Ms. Denika Blacklock, the first Project Manager and Ms. Ulrike Schmidt, the second Project Manager have both been indispensable as have the continued support of Project Co-ordinator Ms. Maj-Britt Risberg-Hansen and IT Manager Matthias Voigt. ECMI’s Deputy Director Ewa Chylinski has been instrumental in both the initial phase of the project design and the implementation phases as well as in the relations to the European Commission, and Senior Research Associate and eminent expert on Roma issues, Dr. Eben Friedman has lend us extensive support in every aspect of the Project. A special thanks goes to ECMI’s Librarian Wes McKinney without whose professional dedication these reports would not reach the public. Finally, a warm thanks to those individuals who seldom get recognized:
the interns who have worked every bit as hard as anyone else attached to this project: Ms.
Jaimee Braun, Ms. Annika Salmi, Ms. Alina Tudose and Ms. Kate Corenthal.
ECMI hopes that these Working Papers will prove useful to researchers interested in or participating in the ongoing research on the social exclusion of ethnic minorities and the development of cultural policies within the European Union. Any inquires related to these reports should be address directly to the main authors of each Working Paper who are also individually responsible for the content of the Papers. A list of contact details as well as further information about the OMC Project can be found by visiting the homepages of the OMC Project at www.ecmi-eu.org.
Dr. Tove H. Malloy
Scientific Director of the OMC Project
I: EXECUTIVE SUMMARY
The situation during preparation of this report:
The Estonian National Report on Strategies for Social Protection and Social Inclusion 2006-2008 has been prepared within the framework of EU Open Method of Co- ordination and in accordance with updated aims and principles adopted by the Council of Europe in March 2006.
On behalf of the Estonian Government, the Ministry of Social Affairs has prepared the above-mentioned national report in co-operation with other ministries and non-profit organizations. Lack of co-operation between trade unions and the Ministry of Social Affairs, and has, however, meant that trade unions have not taken part. The report is thus state centered, though the very active inclusion of several non-profit organizations (such as Caritas-Estonia etc.) has increased social acceptance of the report.
We are pleased to report very good co-operation between the OMC Project’s Estonian partner and the contact person of the Ministry of Social Affairs, Mrs. Anne Rähn, which has resulted in a very profound overview of the work carried out in Estonia. Furthermore, proposals presented by the OMC Estonian partners have been taken into consideration and data regarding the integration of unemployed youth included in the national project report.
According to the treaty of the member states, social inclusion efforts should foucs on three realistic aims. Estonia has chosen two priority aims for the years 2006-2008:
1. Prevention and decrease of long-time unemployment and discouragement in labour market.
2. Prevention and decrease of social discouragement and poverty among families with children
Within our analysis we focus in-depth on the topics related to unemployment, the issues related to families with children and their poverty are not handled so profoundly. Our analysis showed that active employment policy and interference in the labour market processes may have positive effects for the employment sphere.
First. The social inclusion policy ought to be viewed from a number of different aspects that influence the process. For non-Estonians the cultural integration factor plays a much more important role than was expected by researchers. The outcome of our analysis shows that in employment politics practical knowledge of the Estonian language must be considered as one of most important factors together with professional skills and training.
After graduating from secondary educational institutions non-Estonian people should have opportunities for practical use of language, so that this knowledge can be developed.
Knowledge of foreign languages, combined with other skills, is an important prerequisite for obtaining employment in the modern working environment. Young people especially non-Estonians who do not know any foreign language on a satisfactory level think very often about emigration.
Modernizing of working environment should advance together with modernization of labour force skills. This process should involve all parts – employers, employees organizations and the Ministry of Social Affairs (as a state representative). The Ministry of Social Affairs holds a very liberal position about regulation of employment by agreements with employee organizations.
Second. In Estonia there are widespread attitudes about under-representation of non- Estonians in labour and the jobs-related hierarchy. These attitudes are based on misleading stereotypes about unequal possibilities of non-Estonians compared to Estonians. Study results do not show a worse position of non-Estonians or lesser satisfaction with their lives in general.
In Estonia there is indeed disparity between Estonian and non-Estonian young people’s educational competences. These disparities are demonstrated in the analysis of opportunities of making professional careers for Estonians and the Russian-speaking young labour force. Language competences determine professional career sometimes more than other social and demographical factors. In addition there are visible regional differences between North-Estonia (with Tallinn) and other regions. The named disparities should be taken care of by educational (including vocational education) means. Therefore, this is rather a problem for educational institutions to solve than institutions of labour departments.
Third. The Estonian employment situation is analyzed mainly on the basis of economic aspects, using only statistical data about employment/unemployment, poverty rate etc.
People’s welfare situation should be analyzed also by subjective indicators. In the context of the potential labour force emigration situation perspective (concerning especially some particular specialties) it is of utmost importance to know peoples’ expectations towards future job opportunities.
The European Commission orders regular Eurobarometer Studies, which give comparative data for all EU member states. These data and in addition some local sociological studies are a good basis to enrich general economical statistics with indicators of the subjective evaluation of the labour force. The social inclusion development plan for the next period should include analysis of sociological studies. This would give a better overview of the situation as well as offering more complex information for future prognosis.
The peculiarity of Estonia is shown while examining inequality in distribution of incomes. In general this indicator has remained at the same level during recent years. In 2003 the difference between the highest and lowest incomes was 7,1 times. In 2002 it was 6,0 times while EU average was 4,8 times.
In 2003, the average cost of social protection in the EU reached up to 28 per cent of GDP while the distribution of these costs has continuously increased during recent years.
Expenses on social protection in Estonia have increased in 1999-2003 when looking just at absolute numbers, but their share of GDP has decreased. While in 1999, social protection expenses made 16,4% of GDP and in 2003 this share became 13,4 % (in 2005 15%). In 2003, the biggest share of expenses to social protection was assigned to pensions and social security, 44,0% and 31,8 % respectively.
The share of social protection expenses has dropped mostly due to the high growth rate of GDP. As experts, we should also add here that in reality the expenses to social protection have increased so little in the 2000-2005 period because of general liberal attitudes.
Another outcome of such a policy is that monthly social aid to unemployed persons (400 EEK/month) has not increased since it was adopted in 2001. Recently, the increase of this aid has been scheduled to increase to 1000 EEK per month in 2007. It is quite hard to survive on 400 EEK per month, as the minimum monthly living amount for an adult person in Estonia is around 800 EEK.
In Estonia, the unemployment rate declined by about 50% in 2005 and for the first half of 2006. The share of registered unemployed persons today is 1.9% for the entire working population. According to data from the 1st of June there was 15, 725 unemployed persons (compared to 27,500 persons a year ago).
Employment increased due to the decrease of unemployment as well as due to the decrease of inactivity. In the 2nd quarter of 2006, 356,000 people aged 15–74 were economically inactive (students, retired persons, homemakers, discouraged persons, etc.).
Among inactive persons, the number of pension-aged inactive persons and discouraged persons decreased most. The unemployment rate has decreased since 2001; however, the number of discouraged persons has decreased remarkably since the end of 2005. In the 2nd quarter of 2006, 5,600 persons had lost hope to find a job, which is almost three times less than a year ago.
The unemployment rate was 6.2% in the 2nd quarter of 2006, which is smaller than in the first quarter of 2006 (6.4%) and smaller than in the second quarter of 2005 (8.1%). The unemployment rate was the highest in Northeastern Estonia (14%) and the smallest in Western Estonia (2.4%).
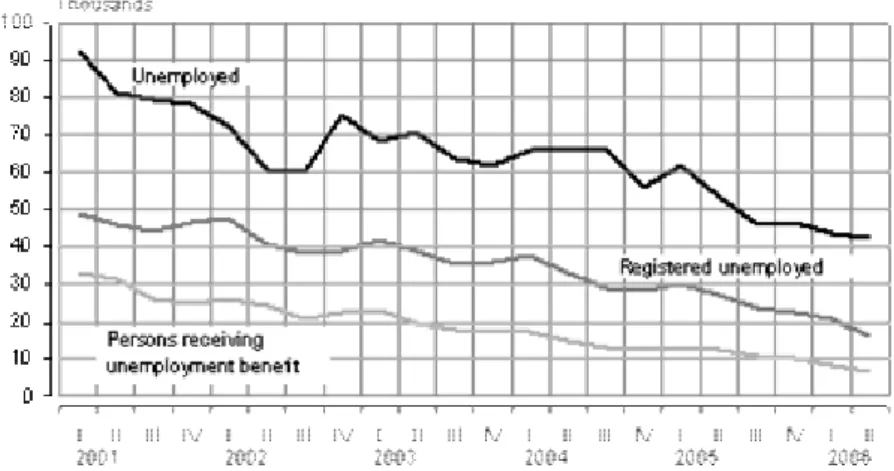
According to the data of the Estonian Labour Force Survey the number of unemployed persons was 43,000 in the 2nd quarter of 2006. According to the data from the Labour Market Board the number of those registered as unemployed was 16,000, while 6,500 of them were receiving unemployment benefits. (See data on Figure 6.1).
Fig 6.1 Unemployed and registered unemployed, 1st quarter 2001 – 2nd quarter 2006*
*data from the homepage of Estonian Statistical Board: compiled (23.8.2006) by Ülle Pettai.
The main reason for not registering for unemployment is due to the opinion by those unemployed that a suitable job is not available in the Labour Market Board. In 2005, 42%
of unemployed and not registered in the Labour Market Board named it as a main reason for not registering. Often these unemployed people who are not entitled to unemployment benefit by not registering. Usually a job can be found without the help of Labour Market Board, mainly through friends and relatives (38%).
But it can be stated that a new social innovation process in labour has emerged in Estonia in the last 2-3 years: the activation of employment of Russian young people has been significant. There were two important factors that fostered the process. One of these was the Unemployment Act, which was renewed (became effective in 2006). Second, was the creation of activation centres for unemployed persons. This was focused on the unemployed Russian-speaking people amongst others. In 2004, training centers were established for unemployed people in Tallinna and Jõhvi, which are regions with a notable non-Estonian population.
During these years, a network for social integration of non-Estonian unemployed young people was created. The training courses consisted of extra state language studies as well as working practice in companies. Due to these training courses, Russian-speaking young people had the opportunity to update their working skills and to practice the state language.
State support for training of a new profession has been carried out through funding from the European Structural Funds. All this activity has changed employers’ attitudes towards newly trained young people. Those who have passed the Labour Department training courses now have high positions within the labour market. Altogether, adaptation to labour market needs, improvement of the knowledge of the state language, offering stable working positions – these have been the positive effects of the EU Social Policy.
II: THE MAIN POLICY DIRECTION FOR EMPLOYMENT ENHANCEMENT AND POVERTY REDUCTION ACCORDING TO THE NAP FOR SOCIAL INCLUSION (2004 – 2006)
Social exclusion is understood as a process by which some people are forced to the margins of society, where they are unable to fully participate in the social life. The exclusion can be caused by poverty, low levels of education, ill health and other social and cultural factors. The situation where a substantial proportion of the society experiences social exclusion in their daily life has negative consequences both for the individual as well for the society at large.
First question: What should be asked is how many people in Estonia live under the poverty line and what is their ethnic origin? During the last years, there some comparative statistical data has been gathered (known as Laeken indicators), which enable us to follow the social trends in Estonia compared with other EU member states.
According to the most commonly used methodology in Europe (which is also used by Eurostat) people whose net income is less than 60% of the country’s median income are officially considered to be poor. This limit is known as the line of poverty risk. At the same time there are two different approaches in income calculation – monthly based and annual calculation. The first of them, the household based monthly income calculation, has established traditions in Estonia and therefore it is natural that further comparisons are made on the basis of monthly incomes.
In Estonia, 18,3% of the total population lives on or under the poverty line, while the same indicator for Czech Republic, Hungary or Slovenia is only about 8%. At the same time the income differences in some ‘old’ member states are much larger – e.g. 19% or more of the total population in Greece, Ireland, Portugal and Italy live under the poverty line, but these countries are in general much more highly developed compared to Estonia as a whole.
The results of the analysis of Estonian Social Survey 2004 (ESU2004) conducted by Estonian Statistical Board
The present report deals with up-to-date methodology, which is taken into account by Eurostat, especially during the EU-SILC comprehensive study. Through the initiative of European Commission and according to the programme EU-SILC, the Estonian Statistical Board organised the Estonian Social Survey 2004 (Eesti Sotsiaaluuring 2004, official abbreviation in Estonian -ESU2004). During this survey the living conditions of more than 8700 households were under investigation.
The results of that comprehensive survey were published in a book entitled “Income and Living Conditions in Estonia” (“Sissetulek ja elamistingimused”, Tallinn 2005).
This survey established the annual income of 23,303 EEK or about 2000 EEK (128 EUR) montly per household member as the poverty line according to the annual
equivalent net income in 2003 (SYE 2006. p 128). According to these criteria, 20.2%
of Estonia’s population was living under the poverty line (at-risk-of-poverty) in the mentioned year (2003). The same methodology was used in 2005 when the Estonian Statistical Board conducted a follow-up survey, but the results of this survey will not be available before October 2006.
According to the Estonian Social Survey of 2004, children under the age of 15 were in the worst position. The poverty risk for these age groups was 23%.
However, the most important result of the Estonian Social Survey of 2004 was the well-known fact that the permanent employment and corresponding regular income were the most important ways of coping with poverty. This was in part approved by the sociological fact that the poverty risk was the lowest among the people with a permanent job (9%), at the same time when 57% of the unemployed had an income, which forced them to live under the poverty line.
The closer focus on the unemployed population of 2004 in Estonia revealed that quite a large portion of people with permanent jobs (30%) belonged to the 45-54 age group. However, the survey also revealed that 41% of those unemployed were non- Estonians. At the same time, the non-Estonian population amounted to only 31% of Estonia’s total population according to the census conducted in 2000. The share of non- Estonians among the unemployed was larger than the total share of non-Estonians in Estonia.
The secondary analysis conducted by the working group of the Institute for European Studies indicated that in 2004 there were only 28% of non-Estonians and 44% of ethnic Estonians who felt satisfied by the level of their income. Concerning the second indicator –contentment with life in general –51% of non-Estonians and 61%
of ethnic Estonians replied that they are content with the country’s general direction. At the same time this analysis proves that the sentiments related to their personal incomes are important and affect people’s perceived contentment with life in general.
The Estonian Social Survey of 2004 also revealed the fact that the average income of Russians and other non-Estonians is slightly lower compared to the ethnic Estonians. At the same time, this tendency was not visible elsewhere in Estonia except for the Northern part of the country (capital Tallinn and its surroundings). The average annual income of the households of ethnic Estonians living in Northern Estonia was 73,380 EEK, at the same time when the same indicator for non-Estonian households in the same area was 50,597 EEK. But this was the only region where such discrepancies were found during the observed survey. Even in the Ida-Virumaa country where the Russian population has a majority there was not a substantial difference in the income levels of the local Russians and the local ethnic Estonians. As we know, the region of Ida-Virumaa has been quite a significant target area for investments for years, which have most likely helped to balance the social environment of that region along with the alleviation of differences in the income structure by ethnicity.
In order to understand the very essence of the project (the influence of cultural factors to the process of social inclusion), one has to describe briefly the population dynamics that have been characteristic for Estonia before and after the restoration of independence in 1991.
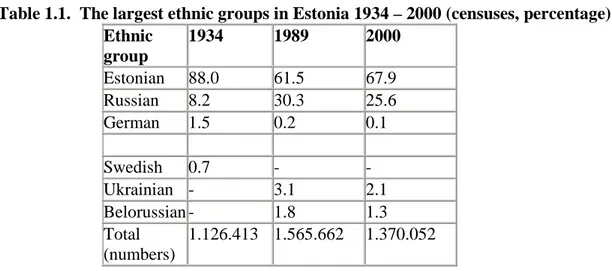
Approximately 32% of the population of Estonia is of non-Estonian origin (table 1.1), the majority (approx. 55%) of whom do not speak Estonian and because of this are not fully integrated into mainstream Estonian political, social and cultural life.
Table 1.1. The largest ethnic groups in Estonia 1934 – 2000 (censuses, percentage) Ethnic
group
1934 1989 2000
Estonian 88.0 61.5 67.9
Russian 8.2 30.3 25.6
German 1.5 0.2 0.1
Swedish 0.7 - -
Ukrainian - 3.1 2.1
Belorussian - 1.8 1.3
Total (numbers)
1.126.413 1.565.662 1.370.052
One of the characteristic features of the main population - ethnic Estonians – is their remarkable stability in terms of migration. At the same time, approximately one third of the non-Estonian (mostly Russian-speaking) population can be characterised as extremely mobile. However, this applies mostly to the elderly generation and goes back to the years spanning 1940-1970, when the vast majority of Russians came from other parts of at that time the Soviet Union to the territory of the occupied country – now the Republic of Estonia. During that period, more than 500,000 Russians and other Slavic people came and settled in Estonia. They were coming from the territory of present day Russia, the Ukraine and Belarus, as well as from other areas inhabited by Russians (i.e. from Siberia, Central Asia, etc.). Along with the Russian population, came some representatives of other ethnic groups, such as Germans from Kazahstan etc. By now the latter ethnic groups have almost entirely left Estonia and settled down in Germany.
Since the restoration of Estonia’s independence, one of the crucial recognised preconditions of the integration of non-Estonians into Estonian society has been the achievement of minimal levels of adaptation in term of language, culture and politics, which could enable Estonians and non-Estonians to cooperate within Estonia’s cultural environment. One can say that during the last ten years such minimal levels have been attained. The loyalty of the non-Estonian population towards the Republic of Estonia has been steadily increasing and there are quite a large number of non-Estonians among Estonian citizenry already. As is known, Estonia has followed a very conservative citizenship policy according to the principles of restitution and therefore, a large number
of those who immigrated to Estonia during the Soviet occupation have not yet received citizenship.
Why is it so important to know the trends of change in regards to the Estonian population’s ethnic composition from the viewpoint of social inclusion? A clearly fixed database could provide us with good comparative data and an additional opportunity to plan new employment policies (including measures for labour market activation of the youngest job seekers who have difficulties in integrating into the labour market mostly due to the poor knowledge of language).
The analysis of the dynamics of welfare and poverty indicators let us assume that these are quite important indicators, which describe the social reality and its changes in Estonia. Without following the dynamics of these indicators, it would be difficult to design social policy and evaluate its effectiveness and cost-effectiveness. Unfortunately, the Estonian NAP for Social Inclusion for 2004-2006 does not pay enough attention to the field of contentment/discontentment with life. At the same time, the sociological data on contentment/discontentment has been gathered during the Eurobarometer surveys arranged by the initiative of European Commission already for decades. In Estonia, the questions concerning contentment have been included in the questionnaires from 2003 forward. Thus, we have an additional indicator for the evaluation of the outcome of the economic and social policy measures and due to the Eurobarometer-type public opinion surveys, we have a relevant time-series.
According to the data from 2003, Estonia’s indicators of economic growth and contentment with life are among the lowest compared to the other new accession countries (see Figure 1.1). However, during the last couple of years, Estonia’s position Figure 1.1. Estonia’s total GDP per capita and contentment with life in 2003 compared with the same indicators of other EU new member states
The contentment with life and the GDP per capita (PPS) in EU accession countries in 2004
19400 15600
13200 12600
11500 10800
8900 8600
7500 6700
56 62 64
53 53 51
82 72
84 82
0 5000 10000 15000 20000 25000
Cyprus Slovenia Czech Republic
Malta Hungary Slovakia Poland Estonia Lithuania Latvia 0 10 20 30 40 50 60 70 80 90
GDP per capita/ in Euros Percentage of people content with life
* Data from book “Estonia on the way to Europe. Developing economic environment and changing identities” (in Estonian) Tallinn, 2004), p.14.
has improved significantly and the country’s GDP per capita exceeds Poland, Slovakia and Hungary (as forecast to 2007).
During the last three years, contentment with life in Estonia has grown significantly: in the fall of 2003, 53% of inhabitants were content with their life. The follow-up survey conducted in the spring of 2005 within the framework of the Eurobarometer indicated that this number had already grown to 70%. The Estonian Social Survey of 2004 obtained similar results. The contentment with life was relatively high (58%) among Estonia’s population. But at the same time, the attitudes of ethnic Estonians and non-Estonians differed substantially. While the percentage of Estonians content with life in Estonia was 61%, the same indicator among non-Estonians was 50%.
When Estonian society was facing the EU-referendum in September 2003, the share of those who voted in favour of the European Union was 66.8 %, while the percentage of those who voted against the membership was 33.2 %. The overall participation rate in Estonia was 64.1 % (Estonian National Electoral Committee, 2003).
Public support for the European Union in Estonia increased from 48% in 2003 (people who answered “definitely support” and “rather support”) to 68% in September 2006. The proportion of opponents to the EU clearly diminished: from 44% in June 2003 to 26% in 2006 (EMOR, EL Seire)
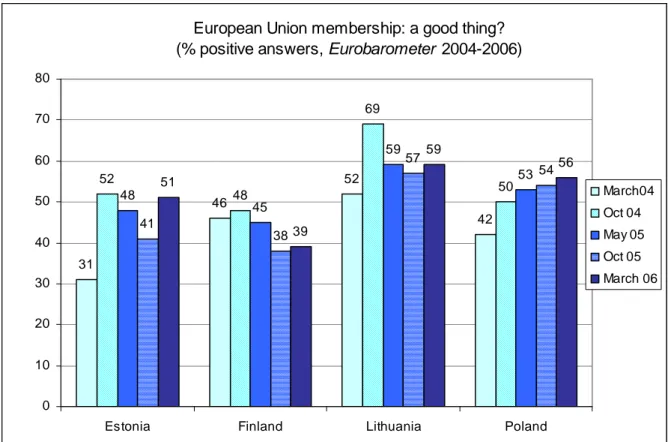
During the debate, which took place the first year after Estonia joined the EU, the majority of citizens realised that EU membership provided new possibilities for defining the country’s position on Europe’s political and cultural map. Eurobarometer Studies data clearly shows willingness with regards to the EU in Estonia. Eurobarometer Studies 62 and 63 reported that the proportion of Estonian people who answered that the “EU is a good thing” had grown as was the case in Estonia`s neighbour countries in Lithuania and Poland. In March 2004, it was 31%, in October-November 2004 - 52%, but in October- November 2005 – 41% and in March 2006 – 51% (according Eurobarometer Study on Figure 1.2).
Fig. 1. 2. EU Eurobarometer Study “EU is a good thing”
European Union membership: a good thing?
(% positive answers, Eurobarometer 2004-2006)
31
46
52
42 52
48
69
48 50
45
59
53
41
38
57
54 51
39
59
56
0 10 20 30 40 50 60 70 80
Estonia Finland Lithuania Poland
March04 Oct 04 May 05 Oct 05 March 06
Source: Eurobarometer Studies 61, 62, 63, 64 and 65
III. THE PRECONDITIONS CREATED BY ESTONIA’S ECONOMIC GROWTH
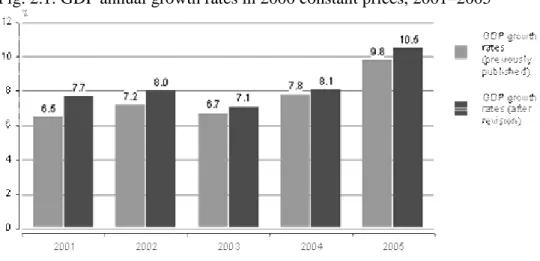
During the years from 2004-2005, Estonia has gained relatively good results in country’s general economic development. According to statistics, by preliminary estimations the economic growth in Estonia was 11.6% in the 1st quarter of 2006 compared to the same period a year earlier. Statistics Estonia has revised the accounting methodology used in calculating the Gross Domestic Product (GDP) since 2000 to match the updated methodology. As a result, the economic growth increased compared to the previously published data.
Supply and use tables (SUT) form a coordinative framework for the regular GDP accounting according to the European Union requirements. In relation to this, Statistics Estonia has updated the GDP accounting methodology according to the SUT system.
GDP annual growth rates calculated according to the updated methodology increased by 0.3–1.2 percentage points in constant prices in 2001–2005 compared to the previously published data, while quarterly growth rates for 2001–2006 have changed from –1.1 percentage points to +2.0 percentage points (see Figure 2.1).
Fig. 2.1. GDP annual growth rates in 2000 constant prices, 2001–2005
This process has created good preconditions for the increase of the welfare of ordinary people. At the same time the average standard of living of the inhabitants of Estonia still remains quite modest compared to the average of other EU member states (and is in most cases lower then compared to other states that joined the EU in 2004). Rapid economic growth creates good preconditions for social integration into society.
The employment trends in 2001-2005
Employment policy is one of the key issues of the Estonian National Action Plan on Social Inclusion. At the same time it needs to be emphasised that the results and the outcomes of the present period must be carefully analysed and the new indicators implemented when designing the new policy measures for 2007-2008.
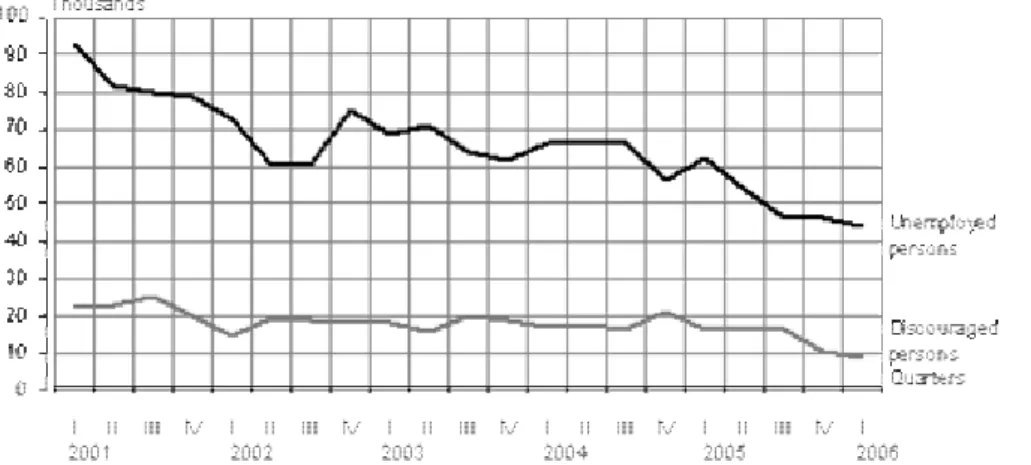
Positive trends in unemployment reduction during the last couple of years in Estonia are presented below (Figure 2.2). Corresponding time-series describes the decrease to the total number of unemployed and the dynamics of so-called discouraged job seekers.
There were 40,000 more people employed in the first quarter of 2006 compared to the situation in Estonia one year earlier. The unemployment rate has fallen to 6.4%. This is a tendency of unemployment reduction characteristic in Estonia for the last five years, which appears to be continuing. The employment rate is correspondingly increasing, especially during the last quarters of 2005 and the first quarter of 2006. While the employment rate grew by 2% during the year of 2005, the total number of employed by the end of the first quarter of 2006 was already 6.8% higher compared to the situation a year earlier. The employment has grown everywhere in Estonia, especially in the Southern part of the country. Even in Northeast Estonia, which is well known as the area of with the highest unemployment, the employment rate grew by 7.5% during one year.
Figure 2.2. The changes of the total number of unemployed and discouraged job seekers in Estonia for the period from first quarter of 2001 to first quarter of 2006 *
Unemployed and discouraged persons, 1st quarter 2001– 1st quarter 2006
* Data from the homepage of Estonian Statistical Board: compiled (29.4.2006) by Ülle Pettai.
NATIONAL ACTION PLAN of social inclusion for 2004 -2006
The Estonian National Action Plan for 2004-2006 is compiled for all states and concerns mainly the aspects related to employment. In this plan, the special segments of society (age groups, regional diversity, ethnic and linguistc origin etc) are not specifically considered. For Estonia, this approach is understandable because the Minister of Population Affairs is responsible for the integration process. There is also a special long- term State Plan for the integration of non-Estonians into society.
It should be examined more closely to what extent the goals of employment increase set for the years 2004-2006 by the National Action Plan are met. In brief one can claim that all of the long-term goals set by the action plan are achieved at least in a satisfactory manner.
First, Estonia has achieved a general increase of employment among people of the best working age. For example, the employment rate for the age group of 15-64 was 62.6% in 2003, but that number had grown to 64.5% by the end of 2005 (1.7% annual growth).
This is modest but steady employment growth. Altogether, by the end of the first quarter of 2006, the number of employed people between the ages of 15-74 was 635,000.
Second, positive shifts in the number of people who have been unemployed long-term, can be seen. This has been a major problem in Estonia since 1999. For example, in Ida- Virumaa county (with mainly a Russian-speaking population) there were 10,600 registered as unemployed (mostly long-time unemployed) in March 2005. During one year, that number has decreased by more than 4000 (or 43% of the total number). In March 2006, the number of registered as unemployed in Ida-Virumaa was as low as 6000
people. The data from the local labour market boards confirm that the general number of those unemployed has decreased at least by one third during the same period.
This is an extremely positive trend in the decrease of the unemployment rate among the youngest population. While the decrease of unemployment for the age group of 15-24, has fallen by one third during the year 2005 (generally in Estonia, the number of young unemployed for Ida-Virumaa County alone decreased more than 50% during the same time). According to the data of Ida-Virumaa labour market board, the number of registered young, unemployed people (aged 16-24) was as low as 826 on May 1 2006.
This is the lowest number for the past decade and it is a clear indicator of positive developments.
Third, at the same time, the unemployment rate has decreased since 2001 (but only from 2005 is it possible to see obvious breakthroughs), the number of the main risk group – discouraged job seekers - has decreased significantly only during the last quarters of 2005 and the first quarter of 2006. By the end of the first quarter of 2006, the total number of discouraged job seekers was 8400, which is two times less than one year ago.
The assistance to the long term unemployed and people who have been excluded from labour market has been quite effective. These results have been achieved by the implementation of new organisational measures, such as the creation of the activation centres of unemployed in four Estonian counties. Implementing these and other social policy measures, the Estonian labour market institutions used effectively significant contributions from ESF and other EU structural funds. For example in Ida-Virumaa county the local labour market board in cooperation with other organisations (employers unions, training centres etc.) spent more than 120 million Estonian kroons during the period of 2004-2006.
Fourth, the increase of general employment and the decrease of unemployment, especially among younger age groups have been attained mostly due to the creation of effective networks between employers and the local labour market boards.
Analysing these four activation measures the obvious growth phase of Estonian economy, it must be taken into account that economic growth itself without proper employment policy measures would not have given such results. This indicates that the labour market of Estonia has left the previous phase of jobless growth.
Since 2005 Estonia has entered a new phase of job creation. One of the most characteristic features of this phase is the fact that during just the last year the total number of employed has grown by 40 000 people. At the moment there is already such a shortage of qualified labour force that the need to import labour force from abroad has been a part of public debate. First of all, it concerns the qualified employers in industry.
The most visible is the case of qualified welders; industry (mostly shipping yards) needs at least 1000 qualified workers. This has created an odd situation when employers demand from government the alleviation of immigration policy, at the same time when
all graduates of Estonian vocational schools are not guaranteed jobs, often due to their poor knowledge of the official state language.
The shortage in the labour force is partly caused by the fact that other EU member states, which initially introduced some restrictions, have opened their labour market to Estonian labour force (in most cases after May 1, 2006). By now only a quite insignificant part of the labour force between the ages of 15-64 has left Estonia. According to the international conference on labour related migration between Estonia and Finland held on April 20, 2006 in Tallinn the total number of people who have permanently or temporarily left Estonia has reached 20 000 people, which means 3% on the labour force of the best working age.
The prognoses of the labour force dynamics made by the Estonian Statistical Board The main question for the strategic development of the Estonian labour market is how to compensate the labour force loss caused by the above-mentioned demographic crisis in such a manner that it will not slow down overall economic growth. The population of Estonia is aging and decreasing in number and therefore, the local labour force can be characterised as an exhaustible resource. It is obvious that in the situation of a demographic crisis all potentially active people living in Estonia should be included in the work force. From the viewpoint of a potential migration risk, one has to consider the possibility that quite a large part of the working-age labour migrants (among them significant a share of non-Estonians) will most probably be able to find a job in the Nordic countries. As unemployment has been higher in some particular regions (North- East, South-East) this problem is related mostly to regional development. The fact that mainly Russian-speaking non-Estonians inhabit many northeastern cities makes employment policy for this region more specific.
However, the trends related to the Estonian labour market have been predominantly positive. Mihkel Servinski from the Estonian Statistical Board has made a prognosis which concerns Estonia’s estimated time schedule of the achievement of the main goal of the Lisbon strategy which is to raise the employment rate of the population aged 15-64 to the point of 70%. However, according to the NAP for Growth, Estonia is striving to reach that goal in 2014, instead of 2010 as was agreed upon by Lisbon strategy. Making this decision in October 2005, the Estonian government assumed that the large number of those that were unemployed long term in Estonia as well as the inactive population would be unable to find employment.
Therefore, in order to design a new set of measures for mployment policy for the period 2006-2008, we need to provide answers to the following questions: how significant is the additional labour force resource required for the achievement of employment rate of 70%
of the working age population, and, second, will this additional resource be sufficient for the achievement of the final goals as assumed by Estonian government?
The forecast of the head of the analytical department of the Estonian Statistical Board notes that if the present quite positive demographic trends continue at least for next decade, the total number of employed will fall below the level of the 70% not earlier than
2015. After 2015 Estonia will definitely lack the resources to keep its total number of the labour force on the level of 2005.
The analysis of the working group of the current project shows that there are still some inner resources unused to enhance employment level. The inner resources are related to the re-training of Estonia’s own young labour force, especially young non- Estonians. The implementation of such an accelerated strategy will undoubtedly be complicated, but according to our understanding its social ‘cost’ will be much lower compared to its alternative – the import of labour force from abroad. The present prognoses related to the labour force import do not pay enough attention on the infrastructure expenditures, which appear sometimes years later.
The analysis indicates that the continuation of present trends in economic growth, labour market activation, use of inner resources and use of the experience of other countries could guarantee quite good results for Estonia’s sustainable development. Ida-Virumaa (North-East Estonia) is also focusing on teaching Estonian, as in these areas unemployment among Russian youth is continuously higher.
IV. NEW RISK GROUPS: INTEGRATION OF ESTONIAN AND RUSSIAN UNEMPLOYED YOUTH: STUDY IN TALLINN AND HARJU REGION AREA AND IDA-VIRU COUNTY.
General thesis
The study in Tallinn and Harju area and the Ida-Virumaa county was carried out a by project team specifically concerned with the purposes and hypothesis of the current project.
During recent years several social groups have emerged (social strata) in Estonian society, which could be called the new risk groups of the social inclusion process. What is this about? Let us examine first the indicators of education of all the population.
Estonia leads among other EU member states because among the age group 25-64 only 12 % do not have a basic education. This represents the success of society as a whole.
However at the same time, the labour mobility of young Russians depends on their knowledge of Estonian (in case they have no knowledge of Estonian, then it is based on their eagerness to learn the language).
Below we will expand upon integration into the labour market of jobless Estonians and Russians by taking into consideration various socio-cultural and ethno-psychological aspects. The purpose of this is to handle more precisely the aspects of social inclusion of unemployed people by trying to create a situation in which knowledge of the language has no role in the formation of social stratification.
Two main obstacles in integration into stable labour environment
The Estonian team was mainly focused on the two issues when studying socio-cultural inclusion: The integration of unemployed youth into a stable working environment and the integration into the social world as a whole.
First. An increase in employment in Estonia takes place due to the improvement in teaching the state language (Estonian) and updating vocational education by upgrading professional levels. This takes place more and more in vocational schools and in vocational secondary schools including regional vocational training centres. The regions such as Harju (surrounding the capital city of Tallinn) and Ida-Viru (North-East Estonia) are also focusing more on teaching Estonian because it is in these areas that unemployment among Russian youth is continuously higher.
The reasons why many Russian youth cannot find permanent jobs were analysed. It became evident that their knowledge of Estonian was insufficient. At the same time it is clear that in addition to the so-called language factor another reason they have become unemployed is due to a lack of work experience and low level of professional skills because the Estonian vocational education system is not able to fully prepare professional workers for the workplace. Here we can notice that the worst “cumulative effect” takes place when both factors (poor knowledge of Estonian and low level of in professional education) are applied to the same person.
Second. In Estonia there are widespread attitudes about under-representation of non- Estonians in labour and job related hierarchy. These kinds of attitudes are based on misleading stereotypes about the unequal possibilities of non-Estonians compared to Estonians. Here it is important to ascertain how and in which direction the social world has changed together with job relations and possibilities for finding a new job during fast economic development.
In order to check validity of the above-mentioned misleading attitudes, we carried out focus group interviews with Estonian and Russian speaking university students on the 20th and 25th of April 2006. Transcribed texts of focus group interviews can be found in Appendix 1 and Appendix 2 of this report. The program of interviews and method of research was based on the results of surveys carried out by the Estonian Department of Statistics in 2004 within the framework of the EU-SILC project, where the main focus was on possible ethnic differentiation of labour and educational spheres in Estonia. It became evident after analyzing the answers of 1700 Russian respondents that there appears to exist certain barriers pertaining to the “national colour” in formation of social stratification regarding education and jobs.
Equal Career Opportunities Index (ECOI) of Russians and other non-Estonians was formed and calculated by the authors of this report based on the above-mentioned data from the Estonian Social Survey 2004. Four indicators were used for this index. The original question asked from all respondents was worded as follows:
Do you estimate that non-Estonians with the same preconditions (i.e. both are citizens, same age, equal educational level, language command, experience) have equal possibilities to gain the following targets compared to Estonians?
Table 3.1. Distribution of the Equal Career Opportunities Index (ECOI)
Mostly yes Often yes Often not
Mostly not 1 To get a job according to his/her specialty 4 3 1 1
2 To get a leading position 4 3 1 1
3 To get higher education 4 3 1 1
4 To get the same salary for the same job 4 3 1 1
The index reflects the education and career possibilities of non-Estonians. ECOI values are analyzed both for Estonian and non-Estonian respondents (see distribution of values in Table 3.2). The distribution of the index shows the socio-cultural differentiation. There appears to be a significant variation regarding the differentiation process among Estonian and Russian respondents.
Table 3.2. Distribution of the ECOI among Estonians and Russians based on data from Estonian Social Survey 2004 (%)
Estonians Russians Total 1 Those who think there is no barriers in Estonia 59 25 50
2 Those who think there are little barriers 26 26 26
3 Those who think there are relevant barriers 8 25 12
4 Those who think there are high ethnical barriers concerning the working career
7 24 12
100 100 100
Most Estonians believe that there are no barriers for non-Estonians within the labour market and regading their careers (59%). Only 15% of Estonians can see such barriers to a smaller or lesser degree. However, Russian responses represent a different attitude about equal possibilities. Only 25% of them believed there exists no barriers and 59%
said that there are barriers.
The results indicated here are essential when describing social differentiation in Estonia common to society based on the principles of the market economy. These results will be used in the students' survey that was carried out in the next stage of the project.
The methodology of the focus group interviews was built upon two measures, both complementing each other significantly. The first measure: based on the social findings described above, the students were asked to comment on this assertion. The second measure: an answer written by a member of the focus group was discussed by participants of this focus group in order to find out the reasons behind why such an answer was written.
The social assertation that was a starting point of the students’ discussion was worded as follows:
The results of a recent social study show that there exists an essential distinction among Estonian and Russian respondents in estimations about possibilities of educational and working career. Those distinctions in attitudes give us a reason to assert that there exists noticeable ethnic differentiation in estimation of educational and labour related opportunitites.
Do you agree with this conclusion?...
Please explain the background for your opinion
...
...
...
What is causing this differentiation – please, point out one of the main reasons ...
...
Short summary of interviews of Estonian and Russian students on 20th and 25th April 2006
(See full text of interviews in Estonian in Annex 1 and Annex 2)
1. The fact that socio-cultural and linguistic differentiation causes obstacles (in Estonian society) in regards to labour mobility, was accepted by more than half of those who were interviewed (8 of 13 students, i.e. 60 per cent).
2. Social outcomes of such a differentiation were observed when more than half of Estonian students did not agree that this differentiation causes very significant outcomes to people's labour career and equal possibilities. Contrary to Estonian students, Russian students mostly claim that ethnic differentiation takes place in Estonia and the main factor of this process is the special status of Estonian language as of national language (i.e. symbolic meaning).
3. We can see that there is a clear difference of opinions. The current educational situation is beneficial for (ethnic) Estonians. Estonians think that linguistic differentiations do not have a fatal influence and knowledge of Estonian depends on eagerness of a particular person himself. But most of the Russian-speaking students who participated in the interviews believe career possibilities are decent and their opinions about gaining higher education in Estonia are pessimistic.
4. During the interview of Russian students it became evident that some interviewees had hostility towards Estonia and rather clearly expressed negativistic chauvinist (obviously Russia-generated) attitudes about Estonia's inner policy measures and about decisions made in regard of national policy carried out after the restoration of Estonian independence. It was possible to feel unfriendliness and little solidarity towards Estonia
as they spoke about ethnic discrimination. Although one can feel about fall back of anti- Estonia attitudes in general, still there are present some young people among students who "have caught the infection of chauvinism." This hysterical attitude concerning Estonia's contemporary history was very well expressed by a female student. We present it exactly has she wrote it down during the interview:
"For many Estonian Russians there was the impression that after the collapse of the Soviet Union they had been persecuted and there exists a big discrimination, that really took place, but for the current moment the schisms have weakened. For the current moment discrimination has weakened a little bit, but it still exists."
Here we would like to produce an evident as a fact about "positive discrimination".
Students in the groups with Estonian language of instruction pay 10 per cent more for tuition fees compared to Russian students. So, there does not exist direct financial discrimination, and probably there will not be, and for Russian students their "diploma costs" are noticeably less compared to the students who have Estonian or English as language of instruction.
5. In summary, "ethnic discrimination" and possible outcome of it, such as under- representation in the social structure is related to knowledge of Estonian language as the state language. Most Russian-speaking students have an exaggerated belief in the key role of Estonian language in formation of Estonia's social structure.
At the same time one of the Russian-speaking interviewees - Vladimir (who has committed some exams during his university studies in Estonian) - says that Estonian as a state language has a significantly wider meaning as a factor of Estonian statehood, economy and political life. Vladimir writes in his comments about differentiation barriers the following: "In our society there arise no barriers. It just depends on a person. We live in a capitalist society, where everybody does everything to become rich. We all have equal possibilities. In fact, in our country knowledge of Estonian or Russian also is not necessary right now. The majority of employers are Germans, Finns and Englishmen."
As we can notice from the student interviews there are some young Russians among others who do overestimate in Estonian fast developing and balanced society the possible negative influence of national values, including the influence of Estonian as state language and as a carrier of culture. But still there were among young students questioned at Audentes University those who had a clearly rational opinion. It is also evident that at the psychological level innovative changes are very slow, but still we can hope that Estonian economic achievements "melt" incredulity about Estonians as a culturally balanced nation. The main reason for interethnic misunderstandings and possible conflicts are probably based on the fact that in the schools with Russian as language of instruction the teaching of Estonian history is still permanently on the "very modest level."
Here we raise the following question about the Estonian school system: should it be divided into two parts on the basis of language of instruction – in Estonian and Russian?
Real school reform is expected next school-year (2007 is deadline for start) i.e. transition from Russian instruction language to Estonian instruction language in certain subjects.
Within the framework of the OMC project there were also carried out two in-depth interviews with leading officials and specialists of Estonian Labour Market Board in Harju county and Ida-Virumaa county. The interview in Ida-Virumaa took place in Jõhvi (8 May, 2006) and the second interview with Tallinn and Harju county leading officials was carried out in Tallinn (18 May, 2006). Transcription is provided in Appendix 3 and 4.
Our investigation of unemployed youth demonstrated that the Tallinn and Jõhvi leading officials presume that there is no significant difference in the level of educational potential among majority and minority nationality, but at the same time the indicators of linguistic competence differ. This determines possibilities to enter the labour market in general. In addition, regional differences are clearly noticeable.
In depth-interview with the Head of National Minorities Department of Estonian Ministry of Education (transcription provided in Appendix 5) took place on 2 June 2006.
Here we asked the question about thed Estonian school system as a whole. Should it still be divided into two on the base of the language of instruction - Estonian and Russian?
When we should expect real school reform in Russian-language i.e. transition into Estonian language in certain subjects.
An amazing matter of fact became evident in this interview. The contemporary Russian younger generation can expect to receive an Estonia-centered, Estonian taught history course in Russian Gymnasiums in four to five years! The reason is that there is a shortage of Estonian-speaking history teachers in Estonia. In addition, Estonian history textbooks (prepared especially for Russian schools) have not been published as yet. At the same time the step-by-step transition into Estonian language can not be referred to as educational reform, it should more correctly be labeled a five-year transition plan.
Summary of results of sociological research carried out in May 2006
Within the OMC Project a profound sociological survey in Tallinn and Ida-Virumaa was carried out in May 2006. The research programme and survey instrument (the questionnaire) including 36 questions were prepared. The full instrument is provided in Estonian and Russian in Appendix 6 of the Report.
The field work areas corresponded to those towns and regions which were populated by Russians. Capital Tallinn with neighboring Harju county and in Northeast Estonia Ida- Virumaa big cities as Narva, Narva-Jõesuu and Kohtla-Järve, Sillamäe and Jõhvi.
Altogether the survey captured 220 young jobless people aged 17-24. In addition 27 students (of Audentes University) were questioned as reference group. This way the number the total number of respondents - 247 - was gained.
In order to characterize the data set of respondents the socio-demographic indicators (gender, age, education, municipality etc.) were first observed. There were 120 male and 126 female respondents questioned. By region the respondents were distributed as follows: 125 from Tallinn and Harjumaa and 122 respondents from 4 largest cities of Ida- Virumaa county (Narva and Narva-Jõesuu - 44, Kohtla-Järve - 46, Jõhvi -22 and Sillamäe 10).
As the first hypothesis when investigating unemployed youth we would postulate:
There is no significant difference on the level of educational potential among the majority and minority nationality, but at the same time the indicators of linguistic competence differ, which determine possibilities to labour career at large and regional differences are clearly noticeable.
From the viewpoint of our topic several indicators with socio-cultural content are significant - command of Estonian among Russians and command of Russian among Estonians. Also English and other languages are important, and in addition multiplicity of social and linguistic contacts, frequency of linguistic communication in a particular language, existence of ethnic stereotypes and some others.
In order to discover the reasons which form social status of jobless we analyzed respondent's self-estimation. We share an understanding that it is not complicated for a long-term unemployed person to determine the reason why he/she became jobless. This kind of jobless person has several times talked about it with a Labour Market Board's consultant or with his/her case manager (new position name instead of Consultant since January 2006).
Figure 3.3 shows the main reasons why a young person has not found a stable job. Based on this figure we can confirm that the reasons why the youth became unemployed are related to vocational training and education and knowledge of language i.e. command of a foreign language that is necessary in a particular environment.
Figure 3.3
Reasons for unstable job status by region Estonians n=85
22
0
37 41
59
5
32
4 0
20 40 60 80
1. No special education
2. No language command
3. No experience 4. Another reason Tallinn & Harju Ida-Viru
Professional preparation of Estonians and Russians could be rather similar in the case of formal observation. Almost 60% of Estonians in Ida-Virumaa think that they are unemployed because they do not have special professional training to get a job while in Tallinn only every fifth person believes this is the reason. Knowledge of the language does not matter at all for Tallinn Estonians, and only 5% of Ida-Viru Estonians see this as a reason. About 1/3 of Estonians, believe that preceding experience is necessary.
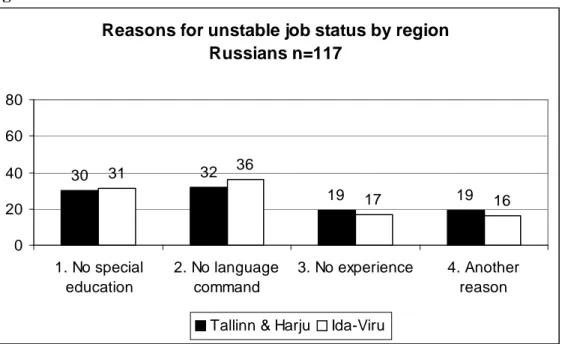
Figure 3.4 shows that approximately 1/3 of jobless Russians’ claims that the lack of professional training is a reason, regardless of whether they settled in Ida-Viru cities or in the Tallinn area. Command of the language has also played a very important role among Russians as about 1/3 said this is a reason. A young Russian without knowledge of Estonian has to take into account that he/she can be "endangered" with jobless status.
For both Estonians and Russians previous experience has become rather dominant. This can be explained by the fact that in our survey we had rather young respondents. Also,
"another reason" was often mentioned that profession requires spell work, but it is not possible to study when you have such a job. Also, women with small children cannot manage with schedules of spell work.
Figure 3.4
Reasons for unstable job status by region Russians n=117
30 32
19 19
31 36
17 16
0 20 40 60 80
1. No special education
2. No language command
3. No experience 4. Another reason Tallinn & Harju Ida-Viru
. There exists a very strong relationship regarding knowledge of foreign languages. In the case of Estonians it is Russian and another third communication language and for Russians this language is Estonian and another third language.