OXFAM ISSUE BRIEFING JANUARY 2015
WEALTH: HAVING IT ALL AND WANTING MORE
Global wealth is increasingly being concentrated in the hands of a small wealthy elite. These wealthy individuals have generated and sustained their vast riches through their interests and activities in a few important
economic sectors, including finance and pharmaceuticals/healthcare.
Companies from these sectors spend millions of dollars every year on lobbying to create a policy environment that protects and enhances their interests further. The most prolific lobbying activities in the US are on budget and tax issues; public resources that should be directed to benefit the whole population, rather than reflect the interests of powerful lobbyists.
EMBARGOED UNTIL 00:01HRS GMT 19 JANUARY 2015
2
1 GLOBAL WEALTH IS INCREASINGLY BEING CONCENTRATED IN THE HANDS OF A
SMALL WEALTHY ELITE
Global wealth is becoming increasing concentrated among a small wealthy elite.
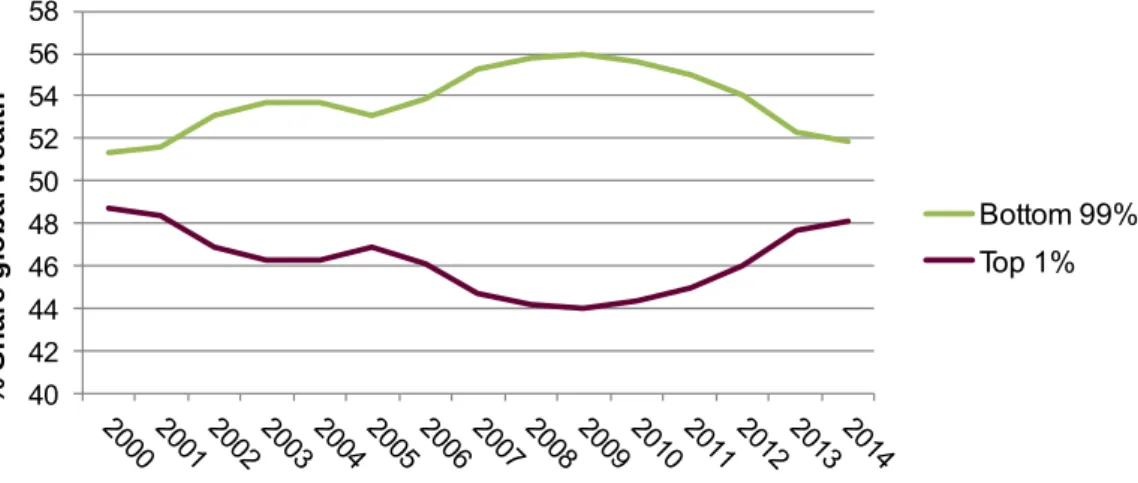
Data from Credit Suisse shows that since 2010, the richest 1% of adults in the world have been increasing their share of total global wealth. Figure 1 shows that 2010 marks an inflection point in the share of global wealth going to this group.
Figure 1: Share of global wealth of the top 1% and bottom 99% respectively; Credit Suisse data available 2000–2014.
In 2014, the richest 1% of people in the world owned 48% of global wealth, leaving just 52% to be shared between the other 99% of adults on the planet.1 Almost all of that 52% is owned by those included in the richest 20%, leaving just 5.5% for the remaining 80% of people in the world. If this trend continues of an increasing wealth share to the richest, the top 1% will have more wealth than the remaining 99% of people in just two years, as shown on Figure 2, with the wealth share of the top 1% exceeding 50% by 2016.
Figure 2: Share of global wealth of the top 1% and bottom 99% respectively; the dashed lines project the 2010–2014 trend. By 2016, the top 1% will have more than 50% of total global wealth.
40 42 44 46 48 50 52 54 56 58
% Share global wealth
Bottom 99%
Top 1%
40 42 44 46 48 50 52 54 56 58
% Share global wealth
Top 1%
Bottom 99%
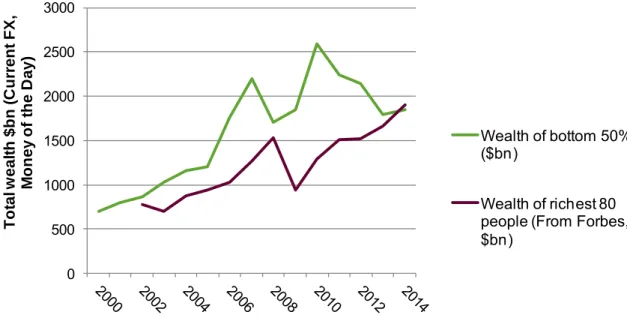
The very richest of the top 1%, the billionaires on the Forbes list,2 have seen their wealth accumulate even faster over this period. In 2010, the richest 80 people in the world had a net wealth of $1.3tn. By 2014, the 80 people who top the Forbes rich list had a collective wealth of $1.9tn; an increase of $600bn in just 4 years, or 50% in nominal terms. Meanwhile, between 2002 and 2010 the total wealth of the poorest half of the world in current US$ had been increasing more or less at the same rate as that of billionaires; however since 2010, it has been decreasing over this time.
Figure 3: Wealth of the 80 richest people3 in the world has doubled4 in nominal terms between 2009 and 2014, while the wealth of the bottom 50% is lower in 2014 than it was in 2009.
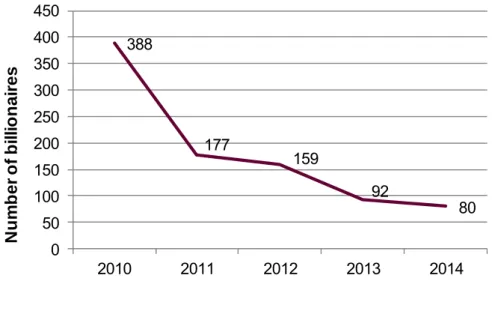
The wealth of these 80 individuals is now the same as that owned by the bottom 50% of the global population, such that 3.5 billion people share between them the same amount of wealth as that of these extremely wealthy 80 people.5 As the wealth of everyone else has not been increasing at the same rate as that for the top 80, the share of total wealth owned by this group has increased and the gap between the very rich and everyone else has also been increasing. As a result, the number of billionaires who have the same amount of wealth as that of the bottom half of the planet has declined rapidly over the past five years. In 2010, it took 388 billionaires to equal the wealth of the bottom half of the world‟s
population; by 2014, the figure had fallen to just 80 billionaires (see Figure 4).
0 500 1000 1500 2000 2500 3000
Total wealth $bn (Current FX, Money of the Day)
Wealth of bottom 50%
($bn)
Wealth of richest 80 people (From Forbes,
$bn)
80 people now have the same wealth as the bottom half of the world’s population, down from 388 in 2010
4
Figure 4: Number of billionaires it takes to have accumulated the same amount of wealth as the bottom 50% of the global population
Box 1: Updating the Credit Suisse wealth data – and Oxfam’s 2014 statistic In January 2014 Oxfam calculated that in 2013, 85 people had the same wealth as the bottom half of the world‟s population, a number that was cited worldwide due to the extreme level of wealth inequality that it illustrated.6 The paper used data from the Forbes list published in March 2013 and from the Credit Suisse Global Wealth Databook with data for „mid 2013‟.
In October 2014, Credit Suisse updated their wealth estimates; the share of wealth held by each global decile and the total global wealth estimates for the years 2000–
2014 at the end of each year. The new estimates include an update to the wealth numbers for 2013, from which Oxfam calculated the 85 statistic. This briefing uses the updated number for 2013 and all other years as published in 2014. Based on these updated figures, in 2013 the number of billionaires holding the same amount of wealth as the bottom 50% was recalculated to be 92.
388
177 159
92 80
0 50 100 150 200 250 300 350 400 450
2010 2011 2012 2013 2014
Number of billionaires
2 WEALTHY INDIVIDUALS HAVE
GENERATED AND SUSTAINED THEIR RICHES THROUGH INTERESTS AND ACTIVITIES IN A FEW IMPORTANT ECONOMIC SECTORS
In 2014 there were 1,645 people listed by Forbes as being billionaires. This group of people is far from being globally representative. Almost 30% of them (492 people) are citizens of the USA. Over one-third of billionaires started from a position of wealth, with 34% of them having inherited some or all of their riches.
This group is predominately male and greying; with 85%7 of these people aged over 50 years and 90% of them male.8
There are a few important economic sectors that have contributed to the accumulation of wealth of these billionaires. In March 2014, 20% of them (321) were listed as having interests or activities in, or relating to, the financial and insurance sectors,9 the most commonly cited source of wealth for billionaires on this list. Since March 2013, there have been 37 new billionaires from these sectors, and six have dropped off the list. The accumulated wealth of billionaires from these sectors has increased from $1.01tn to $1.16tn in a single year; a nominal increase of $150bn, or 15%.
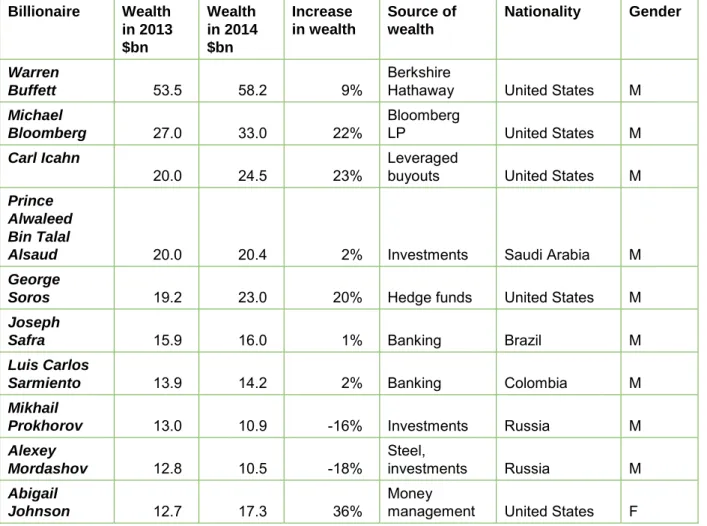
Table 1: Richest 10 billionaires (ranked in 2013) who have made (at least part of) their fortunes from activities related to the financial sector, and their increase in wealth between March 2013 and March 2014.
Billionaire Wealth in 2013
$bn
Wealth in 2014
$bn
Increase in wealth
Source of wealth
Nationality Gender
Warren
Buffett 53.5 58.2 9% Berkshire
Hathaway United States M Michael
Bloomberg 27.0 33.0 22% Bloomberg
LP United States M
Carl Icahn
20.0 24.5 23% Leveraged
buyouts United States M Prince
Alwaleed Bin Talal
Alsaud 20.0 20.4 2% Investments Saudi Arabia M
George
Soros 19.2 23.0 20% Hedge funds United States M
Joseph
Safra 15.9 16.0 1% Banking Brazil M
Luis Carlos
Sarmiento 13.9 14.2 2% Banking Colombia M
Mikhail
Prokhorov 13.0 10.9 -16% Investments Russia M
Alexey
Mordashov 12.8 10.5 -18% Steel,
investments Russia M
Abigail
Johnson 12.7 17.3 36% Money
management United States F
20% of the Forbes billionaires are listed as having interests or
activities relating to the financial and insurance sectors
6
Between 2013 and 2014 billionaires listed as having interests and activities in the pharmaceutical and healthcare sectors saw the biggest increase in their collective wealth. Twenty-nine individuals joined the ranks of the billionaires between March 2013 and March 2014 (five dropped off the list), increasing the total number from 66 billionaires to 90, in 2014 making up 5% of the total billionaires on the list. The collective wealth of billionaires with interests in this sector increased from $170bn to $250bn, a 47% increase and the largest percentage increase in wealth of the different sectors on the Forbes list.
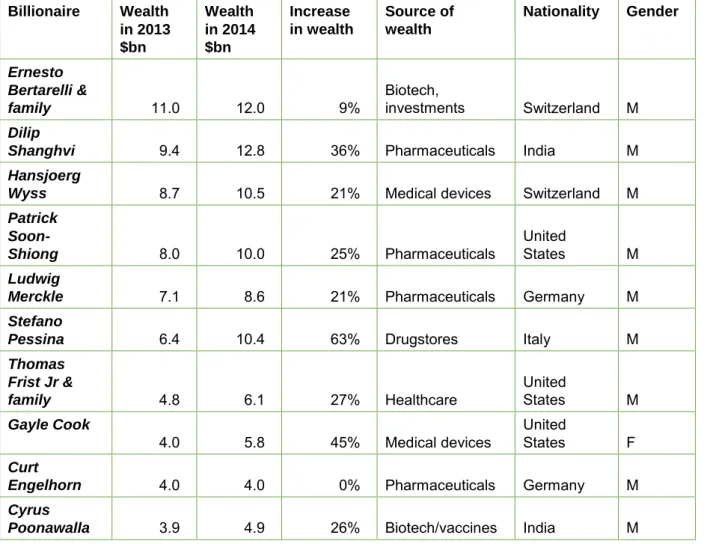
Table 2: Richest 10 billionaires (ranked in 2013) who have made (at least part of) their fortunes from activities related to the pharmaceutical and healthcare sectors, and their increase in wealth between March 2013 and March 2014.
Billionaire Wealth in 2013
$bn
Wealth in 2014
$bn
Increase in wealth
Source of wealth
Nationality Gender
Ernesto Bertarelli &
family 11.0 12.0 9% Biotech,
investments Switzerland M Dilip
Shanghvi 9.4 12.8 36% Pharmaceuticals India M
Hansjoerg
Wyss 8.7 10.5 21% Medical devices Switzerland M
Patrick Soon-
Shiong 8.0 10.0 25% Pharmaceuticals United
States M
Ludwig
Merckle 7.1 8.6 21% Pharmaceuticals Germany M
Stefano
Pessina 6.4 10.4 63% Drugstores Italy M
Thomas Frist Jr &
family 4.8 6.1 27% Healthcare United
States M
Gayle Cook
4.0 5.8 45% Medical devices United
States F
Curt
Engelhorn 4.0 4.0 0% Pharmaceuticals Germany M
Cyrus
Poonawalla 3.9 4.9 26% Biotech/vaccines India M
Billionaires listed as having interests or activities in the pharmaceutical and healthcare sectors increased their collective net worth by 47% between March 2013 and March 2014
3 COMPANIES FROM THE FINANCE AND PHARMACEUTICAL SECTORS SPENT MILLIONS OF DOLLARS IN 2013 ON LOBBYING
The biggest and most successful companies from both the finance and insurance sectors and the pharmaceutical and healthcare sectors achieve extremely high profits and therefore command substantial resources which they use to
compensate their owners and investors, helping to accumulate their personal wealth. But these resources could also potentially be used for economic and political influence. One way that companies explicitly use their resources for influence is through the direct lobbying of governments, particularly on issues and policies which affect their business interests.
During 2013, the finance sector spent more than $400m on lobbying in the USA alone,10 12% of the total amount spent by all sectors on lobbying in the US in 2013.
In addition, during the election cycle of 2012, $571m was spent by companies from this sector on campaign contributions.11 The financial sector is found by the Centre for Responsive Politics to be the largest source of campaign contributions to federal candidates and parties. Billionaires from the US make up approximately half of the total billionaires on the Forbes list with interests in the financial sector. The number of US finance billionaires increased from 141 to 150, and their collective wealth from $535bn to $629bn; an increase of $94bn, or 17% in a single year.
In the EU, an estimated $150m is spent by financial sector lobbyists towards EU institutions every year.12 Between March 2013 and March 2014, the number of billionaires in the EU with activities and interests in the financial sector increased from 31 to 39, an increase in collective wealth of $34bn, to $128bn.
While corporations from the finance and insurance sectors spend their resources on lobbying to pursue their own interests, and as a result go on to increase their profits and the associated wealth of those individuals involved in the sector, ordinary people continue to pay the price of the global financial crisis. The cost to the US taxpayer of the bailout of the financial sector was calculated to be
$21bn.13 While the financial sector has recovered well as a result of this bailout, median income levels in the USA are yet to return to their pre-crisis levels.14 The ongoing cost to the tax payer for „systematically important financial institutions‟ – in other words those that are too big to fail – has been estimated by the IMF to be
$83bn every year.15
During 2013, the pharmaceutical and healthcare sectors spent more than $487m on lobbying in the USA alone.16 This was more than was spent by any other sector in the US, representing 15% of $3.2bn total lobbying expenditures in 2013.
In addition, during the election cycle of 2012, $260m was spent by this sector on campaign contributions.17 Twenty-two of the 90 pharmaceutical and healthcare billionaires are US citizens.
At least $50m18 is spent by the pharmaceutical and healthcare industry on lobbying each year in the EU, where 20 of the 90 billionaires who made their money from pharmaceuticals and healthcare reside, and who together increased their wealth in the last year by $28bn.
During 2013,
companies from the financial and
insurance sectors spent $550m on lobbying policy makers in Washington and Brussels alone.
Companies from the pharmaceutical and healthcare sectors spent more than $500m on lobbying policy makers in Washington and Brussels.
8
While millions are being spent on lobbying by pharmaceutical and healthcare companies and billions being made by individuals associated with these
companies, a health crisis has erupted in West Africa. The Ebola virus has been threatening the lives and livelihoods of millions of people in Guinea, Sierra Leone and Liberia in 2014.
Companies have responded positively to the Ebola crisis: some pharmaceutical companies are investing in research to find a vaccine, the full costs of which are not yet known. The three pharmaceutical companies19 that are members of the International Federation of Pharmaceutical Manufacturers & Associations (IFPMA) and that have made the largest contribution to the Ebola relief effort, have collectively donated more than $3m in cash and medical products.20 But the amount of money that has been spent on Ebola and other activities that have a broader benefit to society needs to be looked at in the context of their expenditure on corporate lobbying to influence for their own interests. These three companies together spent more than $18m on lobbying activities in the US during 2013.
To put the funding for the Ebola crisis in perspective, the World Bank estimates that the economic costs to Guinea, Liberia and Sierra Leone was $356m in output forgone in 2014, and a further $815m in 2015 if the epidemic is slow to be
contained.21 The largest increase in wealth between 2013 and 2014 by a single pharma-related billionaire could pay the entire $1.17bn cost for 2014–15 three times over. Stefano Pessina22 increased his net worth by $4bn, from $6.4bn to
$10.4bn in a single year; the largest single increase in wealth of all the billionaires listed with pharmaceutical and healthcare interests.
4 THE MOST PROLIFIC LOBBYING
ACTIVITIES IN THE US ARE ON BUDGET AND TAX ISSUES
The billions that are spent by companies on lobbying, giving them direct access to policy and law makers in Washington and Brussels, is a calculated investment.
The expectation is that these billions will deliver policies that create a more favourable and profitable business environment, which will more than compensate for the lobbying costs.
In the US, the two issues which most lobbying is reported against are the federal budget and appropriations and taxes.23 These are the public‟s resources, which companies are aiming to directly influence for their own benefit, using their substantial cash resources. Lobbying on tax issues in particular can directly undermine public interests, where a reduction in the tax burden to companies results in less money for delivering essential public services.
Table 3: Number of lobbying cases filed against each issue in the US in 2013.
Issue Number of clients
Federal budget and appropriations 3219
Tax 1951
Health issues 1898
Transportation 1371
Defence 1297
Energy and nuclear power 1238
Source: Centre for Responsive Politics, Opensource.org
5 RISING INEQUALITY IS NOT INEVITABLE
In October 2014 Oxfam launched its Even It Up campaign, calling for governments, institutions and corporations to tackle extreme inequality. This briefing provides further evidence that we must build a fairer economic and political system that values every citizen. Oxfam is calling on world leaders, including those gathered at the 2015 World Economic Forum Annual Meeting in Davos, to address the factors that have led to today‟s inequality explosion and to implement policies that redistribute money and power from the few to the many.
1 Make governments work for citizens and tackle extreme inequality Specific commitments must include: agreement of a post-2015 goal to eradicate extreme inequality by 2030; national inequality commissions; public disclosure of lobbying activities; freedom of expression and a free press.
2 Promote women’s economic equality and women’s rights
Specific commitments must include: compensation for unpaid care; an end to the gender pay gap; equal inheritance and land rights for women; data collection to assess how women and girls are affected by economic policy.
In the US, more companies
engaged lobbyists to work on federal budget and tax issues than any other issue.
10
3 Pay workers a living wage and close the gap with skyrocketing executive reward
Specific commitments must include: increasing minimum wages towards living wages; moving towards a highest-to-median pay ratio of 20:1; transparency on pay ratios; protection of worker‟s rights to unionise and strike.
4 Share the tax burden fairly to level the playing field
Specific commitments must include: shifting the tax burden away from labour and consumption and towards wealth, capital and income from these assets;
transparency on tax incentives; national wealth taxes and exploration of a global wealth tax.
5 Close international tax loopholes and fill holes in tax governance
Specific commitments must include: a reform process where developing countries participate on an equal footing, and a new global governance body for tax
matters; public country-by-country reporting; public registries of beneficial ownership; multilateral automatic exchange of tax information including with developing countries that can‟t reciprocate; stopping the use of tax havens, including through a blacklist and sanctions; making companies pay based on their real economic activity.
6 Achieve universal free public services by 2020
Specific commitments must include: removal of user fees; meeting spending commitments; stopping new and reviewing existing public subsidies for health and education provision by private for-profit companies; excluding public services and medicines from trade and investment agreements.
7 Change the global system for research and development (R&D) and pricing of medicines so that everyone has access to appropriate and affordable medicines
Specific commitments must include: a new global R&D treaty; increased investment in medicines, including in affordable generics; excluding intellectual property rules from trade agreements.
8 Implement a universal social protection floor
Specific commitments must include: universal child and elderly care services;
basic income security through universal child benefits, unemployment benefits and pensions.
9 Target development finance at reducing inequality and poverty, and strengthening the compact between citizens and their government Specific commitments must include: increased investment from donors in free public services and domestic resources mobilization; and assessing the
effectiveness of programmes in terms of how they support citizens to challenge inequality and promote democratic participation.
A full list of Oxfam‟s recommendations to governments, institutions and corporations can be found in the report Even It Up: Time to end extreme inequality published in October 2014.24
NOTES
All URLs last accessed in December 2014 unless otherwise stated.
1 Credit Suisse (2013 and 2014 respectively) “Global Wealth Databook‟, found at
https://www.credit-suisse.com/uk/en/news-and-expertise/research/credit-suisse-research- institute/publications.html
2 Forbes, Billionaires list, available in real time at
http://www.forbes.com/billionaires/list/#tab:overall. Annual data taken from list published in March of each year.
3 These are not the same individuals over time; some billionaires may enter or exit this elite group from year to year.
4 Values given in „Money of the Day‟ for each year, based on current exchange rates against the US$. Value of $970.9bn in 2014 money is approximately $1,042bn; therefore between 2009 and 2014 billionaires increased their wealth in real terms by approximately 82%. Variation in wealth over time can also be driven by exchange rate fluctuations, where assets are owned in currencies other than the US$, but need to be converted to US$ values for the purposes of this Index.
5 For detailed explanation of the calculation, see
http://oxfamblogs.org/mindthegap/2014/11/19/have-you-heard-the-one-about-the-85-richest- people/
6 R. Fuentes-Nieva and N, Galasso (2014) „Working for the Few: Political capture and economic inequality‟, Oxfam, http://oxf.am/KHp
7 Fifty people with no recorded age in the Forbes data set were excluded from the summary statistic.
8 Six people listed as male and female couples and were excluded from the summary statistic.
9 Billionaires were coded as having business interests or activities in the finance sector if the description of the source of wealth was interpreted to be related to the finance sector. In some cases the source of wealth is explicitly listed as „finance‟, in others the company name, such as Bloomberg, a financial sector media service. Some billionaires have interests in more than one sector, including finance.
10 Data from Centre for Responsive Politics,
https://www.opensecrets.org/lobby/indus.php?id=F&year=2013. Total spend for finance, insurance and real estate, minus real estate.
11 Data from Centre for Responsive politics,
https://www.opensecrets.org/industries/contrib.php?ind=F&Bkdn=DemRep&cycle=2012 Total contributions for finance/insurance/real estate, minus real estate.
12 Corporate Europe Observatory (2014), “The Fire Power of the Financial Lobby”,
http://corporateeurope.org/sites/default/files/attachments/financial_lobby_report.pdf. Research finds annual spend of €123m, converted to USD at 1.24 (FX rate as of 10 December). The actual numbers are likely to be far higher. This underestimate is also due to the lack of a mandatory register at the EU level that provides reliable information for a proper monitoring of industry lobbying
13 Congressional Budget Office (2013), “Report on the Troubled assets Relief programme”
http://www.cbo.gov/sites/default/files/cbofiles/attachments/44256_TARP.pdf
14 United States Census Bureau (2014), „Income and poverty in the United States – 2013‟
https://www.census.gov/content/dam/Census/library/publications/2014/demo/p60-249.pdf 15 IMF (2012), “Quantifying Structural Subsidy Values for Systematically Important Financial
Institutions”. Value of subsides calculated into US$ per year terms by Bloomberg
http://www.bloombergview.com/articles/2013-02-20/why-should-taxpayers-give-big-banks-83- billion-a-year-
16 Data from the Centre for Responsive Politics,
https://www.opensecrets.org/lobby/indus.php?id=H&year=2013 17 Data from the Centre for Responsive Politics,
https://www.opensecrets.org/industries/indus.php?ind=H
18 Corporate Europe Observatory (2012) “Divide and Conquer: A look behind the scenes of the EU pharmaceutical industry lobby”,
http://corporateeurope.org/sites/default/files/28_march_2012_divideconquer.pdf
As registration to the Transparency Register is voluntary; many pharmaceutical companies choose not to declare their expenditures. If recorded properly, expenditure on lobbying activities
12
by the industry could be shown to be as high as €91m annually.
19 The three largest cash and in-kind contributors that are members of the IFPMA are GSK, Johnson and Johnson and Novatis
20 http://www.ifpma.org/global-health/ebola-outbreak/ebola-capacity-building.html
21 World Bank (2014) „The Economic Impact of the 2014 Ebola Epidemic‟, World Bank Group, 2 December 2014,
https://openknowledge.worldbank.org/bitstream/handle/10986/20592/9781464804380.pdf?sequ ence=6
22 http://www.forbes.com/profile/stefano-pessina/
23 Data from the Centre for Responsive Politics,
https://www.opensecrets.org/lobby/top.php?indexType=u&showYear=2014
24 E. Seery and A. Arandar (2014) „Even It Up: Time to end extreme inequality‟, Oxford: Oxfam International, http://oxf.am/Ffd
© Oxfam International January 2015
This paper was written by Deborah Hardoon. It is part of a series of papers written to inform public debate on development and humanitarian policy issues.
For further information on the issues raised in this paper please e-mail advocacy@oxfaminternational.org
This publication is copyright but the text may be used free of charge for the purposes of advocacy, campaigning, education, and research, provided that the source is
acknowledged in full. The copyright holder requests that all such use be registered with them for impact assessment purposes. For copying in any other circumstances, or for re- use in other publications, or for translation or adaptation, permission must be secured and a fee may be charged. E-mail policyandpractice@oxfam.org.uk.
The information in this publication is correct at the time of going to press.
Published by Oxfam GB for Oxfam International under ISBN 978-1-78077-795-5 in January 2015.
Oxfam GB, Oxfam House, John Smith Drive, Cowley, Oxford, OX4 2JY, UK.
OXFAM
Oxfam is an international confederation of 17 organizations networked together in more than 90 countries, as part of a global movement for change, to build a future free from the injustice of poverty. Please write to any of the agencies for further information, or visit www.oxfam.org.