Last updated: 13 March 2019 - 1 -
This project has received funding from the European Union’s Horizon 2020 research and innovation programme under grant agreement no 633211.
Project AtlantOS – 633211
Deliverable number D2.7
Deliverable title Report on Tracers, Carbon and ADCPs
Description Report on Tracers, Carbon and ADCPs: Report on transient tracer, carbonate system variables and ADCP data from hydrographic sections and a system to sustain these observations past AtlantOS on key hydrographic sections
Work Package number 2
Work Package title Enhancement of ship-based observing networks Lead beneficiary GEOMAR
Lead authors Toste Tanhua
Contributors Martin Kramp, Pascale Lherminier, Ken Drinkwater Submission data
Due date PM 45
Comments
- 2 -
Stakeholder engagement relating to this task*
WHO are your most important stakeholders?
☐ Private company
If yes, is it an SME ☐ or a large company ☐? X National governmental body
X International organization
☐ NGO
☐ others
Please give the name(s) of the stakeholder(s):
… WHERE is/are the company(ies) or organization(s) from?
X Your own country
X Another country in the EU X Another country outside the EU Please name the country(ies):
… Is this deliverable a success
story? If yes, why?
If not, why?
X Yes, because we reached our goals of better and more efficient coordination, and we showed that a system of European reference laboratories is a useful concept.
☐ No, because …..
Will this deliverable be used?
If yes, who will use it?
If not, why will it not be used?
X Yes, by funding agencies and the GO-SHIP community
☐ No, because …..
- 3 -
D2.7 Report on Tracers, Carbon and ADCPs
Contents
Executive Summary ... - 5 -
1 Introduction ... - 6 -
2 European Reference laboratories: ... - 7 -
2.1 Experience with the European Reference laboratories... - 8 -
2.2 A02 occupation, cruise CE17007 ... - 9 -
2.2.1 Transient Tracers ... - 10 -
2.2.2 Inorganic Carbon System Variables ... - 10 -
2.3 A10.5 occupation, cruise MSM60 ... - 13 -
2.3.1 Preamble... - 13 -
2.3.2 The MSM60 Cruise ... - 14 -
2.3.3 Transient Tracer observations. ... - 14 -
2.3.4 Inorganic Carbon observations ... - 14 -
3 Data from Ship Acoustic Doppler Current Profilers (SADCP) ... - 17 -
3.1 Visit to the “Currents Group” at the University of Hawaii (April 30 to May 13, 2018) ... - 18 -
3.1.1 Objectives ... - 18 -
3.1.2 The Current Group of UH ... - 19 -
3.2 SADCP data acquisition ... - 19 -
3.3 SADCP data processing with CODAS ... - 19 -
3.4 SADCP data format ... - 20 -
3.5 SADCP Best Practices ... - 21 -
3.6 The SADCP processing software CASCADE V7.2 ... - 21 -
3.7 Processing of the SADCP data of 3 Atlantic GO-SHIP surveys ... - 22 -
3.7.1 BOCATS-A25:18 June – 31 July 2016 ... - 22 -
- 4 -
3.7.2 A02 April-May 2017 ... - 24 -
3.7.3 OVIDE-A25 2018 ... - 25 -
3.8 A short list of acronyms ... - 28 -
4 Technical coordination of the Atlantic GO-SHIP activities ... - 29 -
5 References ... - 34 -
- 5 -
Executive Summary
The Global Ocean Ship-Base Hydrographic Investigations Program (GO-SHIP) provides a globally coordinated network and oversight of repeat hydrography. Repeat Hydrography involves a number of core hydrographic sections that are repeated on a decadal time-scale (although a few are “high frequency lines with biennial, annual or bi-annual repeats). These sections are typically full depth CTD stations at high spatial resolution with measurements of a defined set of EOVs (the GO-SHIP level 1 variables), and goes from continent to continent, i.e. crossing ocean basins.
AtlantOS have supported and improved the Atlantic GO-SHIP program in three main ways: 1) AtlantOS supported a coordination office located at JCOMMOPS in Brest, 2) AtlantOS supported the concept of European central laboratories for the observation of not-commonly measured EOVs that are core in GO- SHIP, and 3) by facilitating the observation and delivery of ocean current data from ship-based ADCP systems.
The technical coordination of the program has enabled the GO-SHIP program to be visible on the JCOMMOPS network coordination site, facilitating the overall coordination and assessment of the ocean observing system. The coordination has also made significant progress in tracking the impact of the network in terms of scientific output and has supported the progress of key documentation and support.
AtlantOS supported central facilities for measurements of key GO-SHIP EOVs that are not regularly measured on other platforms of observing systems. AtlantOS decided to support facilities for the inorganic carbon system and transient tracers. Both are EOVs, seldom measured by other networks, and are thus a challenge to maintain facilities for measurements of these in each country. The concept of central European facilities proved to be useful, and a concept that can be used in the future, but requires long-term funding commitments paired with expectation to support GO-SHIP lines.
The improvement of software for processing ADCP data and support for a data management system for these data has showed large potential, and is now ready to deploy on a larger scale for the Atlantic GO-SHIP program.
- 6 -
1 Introduction
The Global Ocean Ship-Base Hydrographic Investigations Program (GO-SHIP) provides a globally coordinated network and oversight of repeat hydrography. The core of GO-SHIP consists of 62 sustained hydrographic reference sections that spans the global ocean. The core sections are continent to continent, or continent to ice, they are sampled at ~30 nm interval, with full ocean depth profiles and observing a well- defined set of variables. GO-SHIP is part of the global ocean/climate observing systems (GOOS/GCOS) for study of physical oceanography, the ocean carbon, oxygen and nutrient cycles, and marine biogeochemistry.
GO-SHIP enables assessment of the ocean sequestration of heat and carbon, the changing ocean circulation and ventilation patterns, and their effects on ocean health and Earth's climate.
GO-SHIP has recently, with AtlantOS support, defined an additional component to GO-SHIP, the associated lines, defined as repeat hydrographic sections of regular GO-SHIP lines but not necessarily coast-to-coast or coast-to-ice, which i) deliver high quality data, ii) establish full depth stations below 2000 m at least every 240 nm, iii) are repeated at least once per decade with sufficient level 1 parameters to quantify decadal change in inorganic carbon and heat inventories, iv) at a minimum resolution of 60 nm, and v) comply with the GO-SHIP data policy.
Although GO-SHIP is a well-recognized program with well formulated goals, methods and work-plan, there exists several temporal and spatial gaps in the GO-SHIP plan for the Atlantic Ocean, for instance in the South Atlantic. A goal for the AtlantOS GO-SHIP task was to engage other (than GO-SHIP) hydrographic efforts to AtlantOS hydrographic observational system with GO-SHIP standards with the objective to improve the temporal and spatial coverage to be sufficient for the integration in the larger Atlantic observing system, including non-European countries conducting hydrographic surveys in the Atlantic Ocean. Physical, biogeochemical and biological observations are all considered.
An additional goal was to establish a coordination office tasked with setting up links to hydrographic programs in the Atlantic Ocean, keep a record of efforts (both past and upcoming) and provide a forum where overlaps, duplications and gaps can be identified (see Section 4).
Rapid quality control and open data release along with incorporation of the GO-SHIP effort in the Joint Technical Commission for Oceanography and Marine Meteorology (JCOMM) in situ Observing Programs Support Center (JCOMMOPS) have increased the profile of, and participation in, the program and led to increased data use for a range of efforts.
- 7 -
2 European Reference laboratories:
GO-SHIP has a well-defined set of level 1 variables that are required to be measured on all GO-SHIP lines.
For biogeochemistry these include: inorganic nutrients, oxygen, inorganic carbonate system, carbon isotopes (14C and 13C), and transient tracers. However, experience has shown that on several of the GO-SHIP lines all level 1 variables are not being measured. Although nutrients and the carbonate chemistry are measured on most (but not all) GO-SHIP lines, the situation is worse for the CFC/SF6 transient tracers where significant observational gaps do exist. Also, for measurements of the carbonate system, several gaps in the
observations exist due to a lack of analytical capacity. The reason for these gaps is most often a lack of resources and/or expertise by the groups organizing these cruises; there are only a hand-full of transient tracer and carbonate system laboratories in Europe set up to do interior ocean accurate measurements.
Transient tracers and inorganic carbon are both identified as an Essential Ocean Variables (EOVs) by the GOOS.
One goal of AtlantOS was to remedy this deficit in the observational system by to setting up network system of demonstrated highly experienced labs in Europa to service the AtlantOS observational system with reference quality measurements of transient tracers and carbonate systems to fill observational gaps. The support lab delivers know-how in form of a skilled sea-going technician, instruments, and data delivery support for 2 of the AtlantOS core-cruises for transient tracer and carbonate system measurements. Due to the relatively few GO-SHIP cruises conducted within the Atlantic in a given time-frame, it is difficult for all involved organizations to support their own laboratories for transient tracers and the carbonate system.
- 8 -
2.1 Experience with the European Reference laboratories
During AtlantOS we had funding to deliver observations of transient tracers (GEOMAR) and inorganic carbon (UNEXE) on 2 Atlantic GO-SHIP cruises where these two variables otherwise would not have been measured.
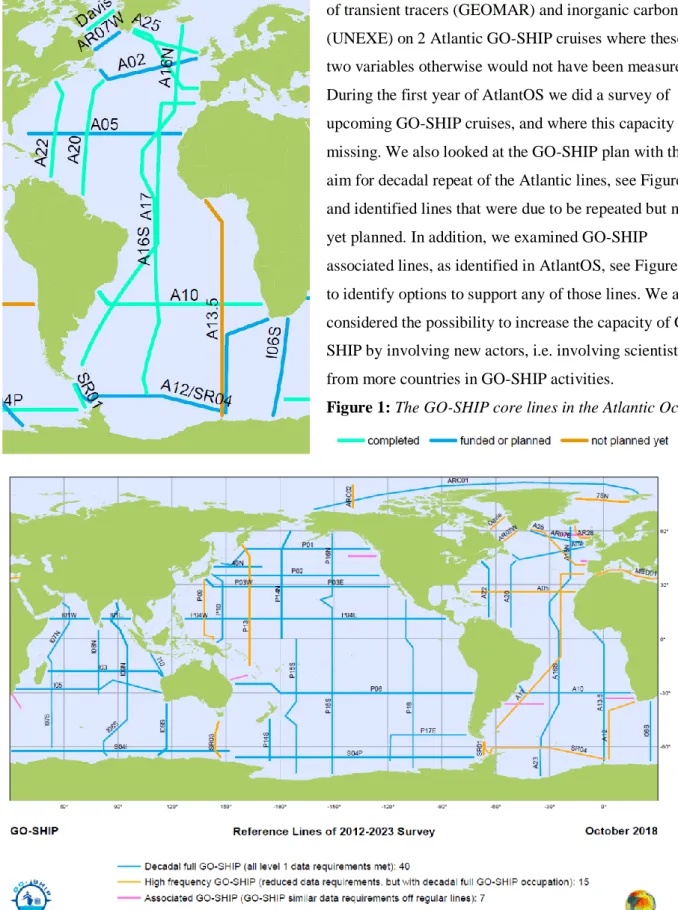
During the first year of AtlantOS we did a survey of upcoming GO-SHIP cruises, and where this capacity was missing. We also looked at the GO-SHIP plan with the aim for decadal repeat of the Atlantic lines, see Figure 1, and identified lines that were due to be repeated but not yet planned. In addition, we examined GO-SHIP associated lines, as identified in AtlantOS, see Figure 2, to identify options to support any of those lines. We also considered the possibility to increase the capacity of GO- SHIP by involving new actors, i.e. involving scientists from more countries in GO-SHIP activities.
Figure 1: The GO-SHIP core lines in the Atlantic Ocean.
Figure 2: Reference lines for GO-SHIP, associated lines in pink.
- 9 -
2.2 A02 occupation, cruise CE17007
After a survey of opportunities and gaps we found out that line A02 in the North Atlantic had not been occupied in full with all GO-SHIP variables for a long time. However, this section in the North Atlantic is key to constrain the transport of carbon and heat in the North Atlantic. An opportunity was taken to engage the AtlantOS partner the Marine Institute in Ireland, Galway, to occupy this section.
The Marine Institute and NUI Galway agreed to commit the Irish RV Celtic Explorer to occupy the A02 section in 2017(cruise CE17007). This was a combined chemical and physical oceanography research expedition that reoccupied the existing A02 section in the North Atlantic as a contribution to the international GO-SHIP program. This expedition marked the first time that Ireland had organized and performed a major international hydrographic study. The work was performed in cooperation with international teams from Canada, Denmark, Germany, the United Kingdom and the United States of America.
The measurements made along the A02 repeat hydrography section included hydrographic measurements (CTD-rosette, Lowered and shipboard ADCP measurements) as well as CFCs, oxygen, nutrient and carbon system measurements. Bad weather during the expedition resulted in unfortunately having to omit 9 of the 67 planned CTD stations, however 58 full depth stations were occupied. All GO-SHIP level 1 parameter
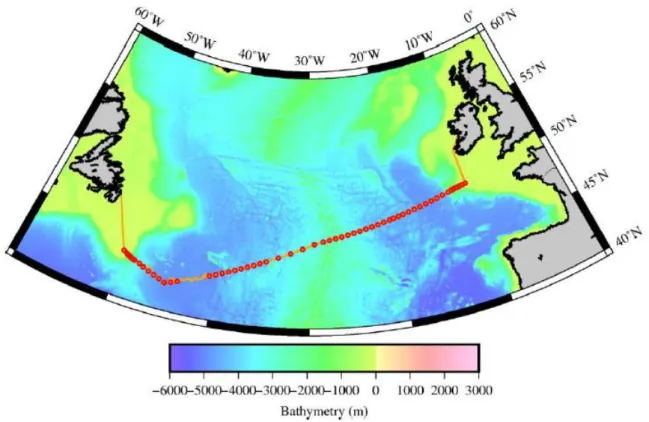
measurements were performed as planned. The cruise track is shown in Figure 3.
Figure 3: The cruise track of cruise CE17007
- 10 -
During this cruise, AtlantOS organized and funded GEOMAR to perform transient tracer analysis (i.e.
CFC12 and SF6), and the University Exeter to perform inorganic carbon measurements. These two important EOVs would not have been measured without the support from AtlantOS.
2.2.1 Transient Tracers
During the cruise, a gas chromatograph purge-and-trap systems was used for the measurements of the transient tracers CFC-12 and SF6. The system was a modified version of the set-up normally used for the analysis of CFCs (Bullister and Weiss, 1988). To cool the traps a system with refrigerated ethanol at -65°C was used.
Because important parts of the trap-cooling equipment broke down as well as the lab technician being ill, the instrument wasn’t deployed for the first 22 stations. With dedicated help by the ship’s crew and using the onboard -80°C freezer, we were able to start sampling every odd station from station 23 onward. Up to 18 depths per station were sampled, depending on freezer capacity, as it had trouble keeping the ethanol cold enough if measurement frequency was too high.
The trap was 100 cm of 1/16” tubing packed with 70 cm Heysep D. The systems used a 1/8” packed main column consisting of 180 cm Carbograph 1AC (60-80 mesh) and a 50 cm Molsieve 5A, heated up to 60°C.
The tracers were trapped at -60° to -68°C; desorption at 120°C. The pre-column was packed with 20 cm Porasil C and 20cm Molsieve 5A in a 1/8” stainless steel column. Detection was performed on an Electron Capture Detector (ECD). This set-up allowed efficient analysis of SF5 and CFC-12.
Samples were collected in 250 ml ground glass syringes. An aliquot of about 200 ml of the samples was injected into the analytical system. Standardization was performed by injecting small volumes of gaseous standard containing SF6 and CFC-12. This working standard was prepared by the company Dueste-Steiniger (Germany). The CFC-12 concentration in the standard has been calibrated vs. a reference standard obtained from R.F Weiss group at SIO, and the CFC-12 data are reported on the SIO98 scale. Another calibration of the working standard will take place in the lab after the cruise. Calibration curves were measured twice to characterize the non-linearity of the detector. Point calibrations were always performed between stations or every 15 samples to determine the short term drift in the detector. Replicate measurements were taken on a couple of stations depending on work load and freezer capacity. The determined values for precision and accuracy are listed in Table 4.3.1.
A total of 301 successful water samples, of which 32 were replicate samples, and 165 calibration measurements were performed during the cruise.
2.2.2 Inorganic Carbon System Variables
The carbon parameter analytical equipment was set up pre-cruise in a seagoing laboratory container
belonging to the University of Exeter, Devon, UK. Discrete CTD samples were analysed for total inorganic carbon (DIC) and total alkalinity (TA).
- 11 - 2.2.2.1 Sampling and Preparation for Analysis
Dissolved Inorganic Carbon (DIC) and Total Alkalinity (TA) measurements were performed on seawater samples collected from 10 L Niskin bottles deployed on a 24 Niskin CTD rosette. 500 ml glass bottles were used to sample the Niskin bottles triggered at the greatest and shallowest depths of each station, in addition to two depths chosen at random, allowing for in bottle replicate measurements to be made. These were used during analysis to indicate the precision of the measurements made by the VINDTA machine at each station.
All remaining Niskin bottles were sampled using 250 ml glass bottles. Following Standard Operating Procedure (SOP) #01 (Dickson et al., 2007), the glass bottles were rinsed with water from the Niskin bottle twice and then a Tygon sampling tube was inserted into the bottle, which was allowed to fill and then overflow for the same amount of time it took the bottle to fill. A glass stopper was then placed into the bottle and immediately after the samples were collected they were ‘fixed’ to prevent the growth of any organic matter. The samples were fixed by removing 250 µL of seawater from each 250 mL sample and adding 50 µL of saturated mercuric chloride. Quantities were doubled for the 500 mL samples. Once poisoned, samples were stored in foam-lined crates in the wet laboratory of the ship until analysis, at which point they were acclimatized to the 25°C air temperature of the laboratory container prior to resting in a 25°C water bath.
Due to inclement weather, the 24 Niskin CTD rosette could not be deployed at stations 15, 16, 17, 18 and 19 and thus no samples could be analysed. Stations 30, 32, 34, 36 and 38 were also missed in order to make up for lost time associated with weather and malfunctions with the CTD tether.
2.2.2.2 Dissolved Inorganic Carbon Analysis
All measurements were completed on two Versatile INstrument for the Determination of Titration Alkalinity (VINDTA, version 3C, SN#064 and #065, Marianda, Germany, Mintrop, 2004) each connected to a
coulometer (SN135015020 and SN135015019 respectively). Water samples were first analysed for Dissolved Inorganic Carbon (DIC). An excess of phosphoric acid (1M, 8.5%) was added to a calibrated volume of seawater sample to convert all inorganic dissolved carbon to CO2. This CO2 was then transported to the coulometer cell by oxygen-free-nitrogen gas (OfN), which was filtered through soda lime to remove any residual traces of CO2 prior to coming in contact with the recently converted CO2. In the cell, all CO2 is quantitatively absorbed to form an acid that is subsequently titrated via coulometry. See Dickson et al., (2007) SOP #02 for more detailed information.
The DIC pipette is surrounded by a water jacket to maintain the same temperature as the samples (25°C).
Coulometer counts were calibrated against replicate analyses taken from the 500 mL bottles and Certified Reference Material (CRM batch 163, certified at 2039.49 ± 0.73 for DIC (Prof A Dickson, Scripps Institute of Oceanography, San Diego, USA)), which were run immediately before and after the coulometer cell was changed, in addition to halfway between the first and last CRMs run on each cell. The coulometer cell was replaced every 24 hours with the cell and both lid IDs recorded for comparison purposes. The coulometer
- 12 -
cells, anode and cathode solution used were purchased from Cobalt Scientific (Cobalt Scientific, Bensenville, Illinois, United States).
Initial DIC calibration was done during the cruise for each instrument by correcting all sample data by the difference between the mean of all CRMs. Post-cruise data quality control included the calibration of the DIC readings for each coulometer cell used during CE17007, identification and removal of errors/outliers and accounting for instrument drift.
2.2.2.3 Titration Alkalinity Analysis
Total Alkalinity was measured by potentiometric titration using the same VINDTA machines as for DIC analysis. These systems use a highly precise Metrohm Titrino for acid addition, an ORION-Ross pH electrode, a Metrohm reference electrode and an auxiliary electrode. Similarly to the DIC analysis, the pipette and analysis cell were kept at the same temperature as the samples (25°C) by a water jacket.
Hydrochloric acid (0.1M) made to the ionic strength of seawater was used as the alkalinity titrant as
described in SOP#3B (Dickson et al., 2007). Alkalinity values were calibrated using replicate analyses taken from the 500 mL bottles and CRM batch 163 (certified at 2215.53 kg-1 ± 0.56 for TA). See Dickson et al., (2007) SOP #03 for more detailed information. Post-cruise data corrections included a recalculation of alkalinities using CTD temperature, salinity and nutrients, and also incorporate a recalibration of the alkalinity pipettes’ volume and temperature sensors. Post-cruise Quality Control will identify and remove outliers and account for drift in the instruments’ alkalinity measurements taken over the course of the cruise.
2.2.2.4 Sample Analysis Strategy and Ship-board Instrument Maintenance.
VINDTA #064 was connected to coulometer SN:135015020 and Metrohm Titrino SN:01270505. DIC pipette volume was 17.62ml* and alkalinity pipette volume was 105.00ml as calibrated following SOP#12 (Dickson et al., 2007). On 4th May Metrohm electrode SN00562703 was swapped for new electrode SN00753480 as the glass tip was getting stuck regularly. On May 4th, analysis was changed from dual to single sample analysis, due to an irregularity between the two sample lines resulting in less precision between duplicates. From this point on, samples were analysed using only one sampling line, line 1.
VINDTA #065 was connected to coulometer SN:135015019 and Metrohm Titrino SN:17850010. DIC pipette volume was 111.05 ml and alkalinity pipette volume was 17.96 ml, as calibrated following SOP#12 (Dickson et al., 2007). The touch screen of coulometer SN:135015019 attached to VINDTA #065 was cracked on May 14th 2017 while analysing samples from station 31. It was kept functioning until the cell change on May 19th 2017 at approximately 03:00 hrs, midway through station 52, after which the touch screen was no longer responsive and the cell could not be changed. With no spare coulometers or alternative control mechanisms to run the damaged coulometer, we were forced to shut down the VINDTA #064 machine on May 19th at approximately 11:00 hrs. Limited time remaining on the vessel and only one machine remaining for analysis resulted in an adjusted sample analysis pattern for the remaining stations, as outlined below:
- 13 -
- Stations 1 – 52: All depths (24 per station) sampled and analysed. Stations 51, 53, 55, 57, 59, 61: 18 samples analysed per station to match depths taken by Chlorofluorocarbons (CFCs) and 13C. 6 remaining unanalysed samples stored and taken for analysis in laboratory at University of Exeter.
- Stations 52, 54, 56, 58, 60, 62, 64: sampled, fixed and stored for analysis in lab at University of Exeter.
- Station 63, 65 and 67: all depths sampled and analysed (shallow stations).
2.3 A10.5 occupation, cruise MSM60
2.3.1 PreambleAtlantOS supported one GO-SHIP cruise in the South Atlantic, using the opportunity to include South Atlantic nations in the GO-SHIP program, and tie different regional observing programs together.
Specifically, GO-SHIP had at that time recently involved a new category of cruises, so called associated lines. These are repeat hydrography lines that are not full-filling all of GO-SHIP criteria of continent to continent, full depth, all level 1 variables and 30 nm station spacing, but so still have a repeat component to it.
The South Atlantic zonal sections (25–35˚S) have received increasing attention with interest in constraining heat and mass transport of the South Atlantic component of the meridional overturning circulation
(SAMOC). Three hydrographic sections in relatively close proximity have been occupied over the past 30 years: A9.5 nominally along 24˚S, A10 along 30˚S, and A10.5 along 34.5˚S. To date A10 has been the designated reference section but at times all three sections have been referred to as A10. There are sound scientific and logistical reasons to consider making one of the other sections the reference section in the future. One of the charges of the GO-SHIP executive committee is to assess which sections should be designated as core reference sections that should be repeated to full GO-SHIP specifications.
For AtlantOS we decided to occupy the 34.5°C section for two reasons: 1) The major advantageous attribute of the A10.5 section is that lies along the SAMBA and SAMOC current arrays maintained by a multi- national group of South African, US, Argentinian, Brazilian, French and German scientists. It is therefore frequently occupied by research ships for servicing the array that often occupy CTD stations, from South Africa as well as from South America. The co-location of a comprehensive mooring array for continuous coverage with a hydrographic section has merit. 2) This was an opportunity to involve scientists from South Africa, Brazil and Argentine to the GO-SHIP program.
The repeat of the A10.5 section at 34.5°S, as opposed to the GO-SHIP core line at 30°S or the line occupied by the UK team at 24°S has initiated a scientific discussion within the GO-SHIP community on which of these latitudes would be ideal for the GO-SHIP A10 repeat. All three cruise tracks have pros and cons. A report on this can be found on the GO-SHIP website1.
1 http://www.go-ship.org/Docs/A9.5_A10_A10.5__final.pdf
- 14 - 2.3.2 The MSM60 Cruise
An opportunity, on short notice, to obtain ship time on the German RV Maria S. Merian made this cruise possible after failed attempts to use either Brazilian or South African RVs. Maria S Merian MSM60
expedition was the first basin-wide section across the South Atlantic following the SAMBA/SAMOC line at 34°30’S. The cruise left Cape Town on January 4, 2019 and arrived in Montevideo (Uruguay) on February 1, 2019. The scientific crew of 22 came from 6 different countries, including Brazil, South Africa and
Argentine. The scientific program consisted of full water depth sampling (up to 5300 m) using the CTD/O2/lADCP rosette system. The water samples have been analysed on board for oxygen, dissolved inorganic carbon, alkalinity, salinity, CFC12, and SF6. In addition, samples have been taken for later analysis of nutrients, chlorophyll structure (HPLC), POC, and nitrogen isotope analysis. The sampling and measurements where performed against the highest standards defined in the GO-SHIP cruise
recommendations (http://www.go-ship.org/). An Underwater Vision Profiler (UVP) was mounted on the CTD for full depth particle photography. Underway measurements included hull mounted ADCPs (75kHz and 38kHz) and high resolution (11nm) XBT probes. The data will be analysed for multiple purposes including calculation of the meridional volume, heat, and freshwater transport across the SAMBA/SAMOC line.
2.3.3 Transient Tracer observations.
During the cruise, a gas chromatographic - electron capture detector system was used in connection with a purge and trap unit (GC-ECD/PT5) for the measurements of the transient tracers CFC-12 and SF6, similar to the system used on the A02 repeat, see above. The sampling strategy was based on full depths profiles with 22 specific depths. The sampling depths were chosen to cover the most prominent features in the water column such as biological features and characteristics of certain water masses. Standardization was
performed by injecting small volumes of gaseous standard containing SF6 and CFC-12. The final processing and calibration of the obtained transient tracer data was performed onshore at GEOMAR in Kiel.
2.3.4 Inorganic Carbon observations 2.3.4.1 Sampling procedure
The Marine Carbon Biogeochemistry Group conducted the measurements of Dissolved Inorganic Carbon (DIC) and Total Alkalinity (TA) on board.
In total, 128 stations were occupied along the 34.5°S section using a rosette holding 22 Niskin bottles of 10 litre capacity. Seawater for DIC and TA analysis was collected at each station, for all depths (i.e. from the 22 Niskin bottles - if all successfully closed). Specifically, 4 samples were taken in 500 ml bottles (top, bottom, plus two random bottles in between) to allow duplicate analysis (i.e. precision analysis), and the other samples were taken in 250 ml bottles.
- 15 -
Due to time constraints, we analysed samples co-located with changes in the water mass distribution based on the CTD temperature, salinity and oxygen profiles, and at selected depths between stations to optimise spatial interpolation throughout the whole section. The bottom and surface samples were always included in this sub-set selection of analysed bottles. The unanalysed bottles were kept aside for possible future analysis.
For each station, once our sub-set selection of samples was analysed, we completed a first Quality Control (QC) and identified important gaps in the DIC and TA profiles or possible interesting features or outliers.
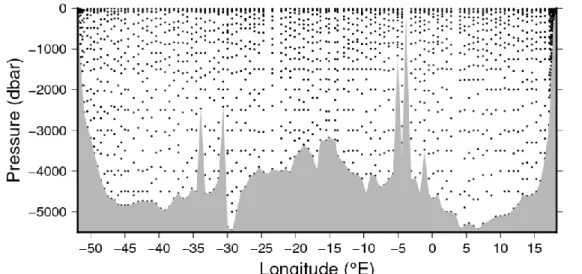
Samples from these locations were analysed and added to the results when time permitted. The remaining samples, that would not significantly improve the DIC and TA profiles, were discarded. Note that the complete analyses of stations 77, 125 and 126 were discarded due to time constrains. The total amount of collected samples was 2,355, and the final number of analysed samples was 1,801 for DIC and 1,784 for TA (the difference is due to some failed analyses), which corresponds to about 75% of all Niskins (Figure 4).
Figure 4: Vertical position of analysed DIC and TA bottles along the latitude 34.5°S, as a function of pressure levels (dbar).
2.3.4.2 Methods
All water samples for DIC and TA analysis were sampled according to the recommendations of the Standard Operation Procedure #1 (SOP#1) (Dickson et al., 2007), similar to the procedure outlined for the A02 cruise, see above. Once the rosette with the Niskin bottles was on deck, samples were taken as fast as possible – preferably within 10 minutes after the arrival of the rosette on deck, and before the Niskin bottles are half- empty – in order to minimise any potential exchange with the surrounding atmosphere.
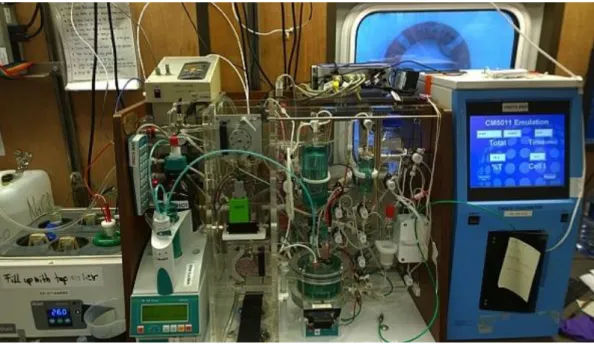
All sample analyses were carried out in the sea-going carbon laboratory-container, which belongs to the University of Exeter and was set on board the ship.
- 16 -
Figure 5: VINDTAs in the Marine Biogeochemistry container from the University of Exeter, on board FS Maria S Merian.
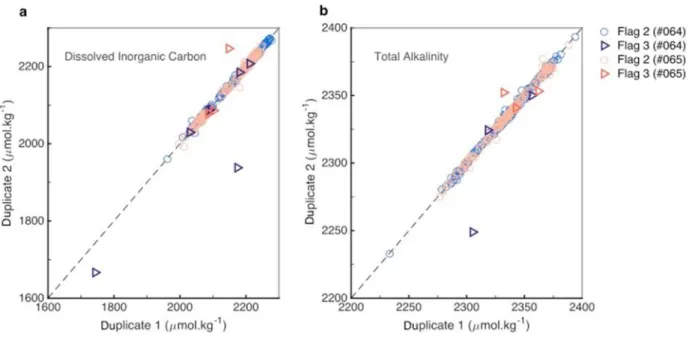
2.3.4.3 First Quality Control
The first level of QC aims at identifying outliers due to technical or instrumental issues and at discerning the
"Acceptable" to the "Questionable" data, following the World Ocean Circulation Experiment (WOCE) flag protocols. Initial first QC was carried out on-board allowing any technical or instrumental issues to be addressed and solved immediately. The complete first QC was achieved post-cruise, once the quality controlled temperature and salinity data provided. Data impacted by technical errors (e.g. errors in liquid level sensors) were marked as "Bad" (i.e. flag 4), while suspicious data (e.g. outliers within a vertical profile or in comparison of neighbouring profiles) were marked as "Questionable" (i.e. flag 3). The remaining data were flagged as "Acceptable" (i.e. flag 2).
- 17 -
Figure 6: Graphs used for quality control of DIC and alkalinity data.
3 Data from Ship Acoustic Doppler Current Profilers (SADCP)
Ocean current and transport is also recognized as an EOV and is a level-1 variable on GO-SHIP lines. Such data are necessary in order to improve our knowledge of transports of volume, heat and tracers in the ocean.
They are also essential to validate the high-resolution altimetry products. Experience shows that this work requires expert support to optimize the product. This can involve support to correctly configure the ADCP on the ship in order to obtain a reasonable level of error on the velocity (less than 3 cm/s typically), or to
recover entire datasets by correcting parameters that were not well configured (alignment, amplitude for example). Up to now, experience shows that in most cases the ADCP data are not made publicly available, because (i) there are quite specific and cumbersome calibration procedures are involved, and (ii) there is no official European data centre for ADCP data.
One aim of AtlantOS was to provide a service of processing SADCP of the AtlantOS hydrographic surveys and to disseminate the know-how to the community. An important product will be a manual of best practices and a software package to support future ADCP measurements, also on non-GO-SHIP cruises.
Data of subsurface ocean currents are sparse, considering the volume of the ocean and the high temporal variability of those currents. Apart from very specific places where other techniques are possible, we still need current meters to precisely assess the magnitude and direction of a current at a certain time and position. This knowledge is necessary not only for climate and research, but also for submarine constructions, vehicles, accidents, etc.
Satellite altimetry data are producing maps of the ocean currents in three dimensions (x-y-t), although the resolution is presently limited to around 100 km and 10 days. The future high-resolution altimeters will be launched soon. They will need in-situ data to validate their products.
- 18 -
Acoustic current meters based on Doppler-effect are currently the most efficient instruments to rapidly acquire velocity profiles in the ocean, providing that the movement of the platform is known with adequate precision. Most of research vessels, and a few merchant vessels, are equipped with this technology, giving access to the velocity current profiles below the ship in the first hundred to thousand meters. However, these data can be tricky to process, being strongly dependent on the quality of (i) the installation, (ii) the ship navigation, and (iii) the calibration. Up to now, very few datasets have been publicly available in Europe, for mainly two reasons. First, acquiring and processing correctly those data takes time, so the data were
processed only if it was necessary for the project, or worse, not acquired at all by lack of expertise. Secondly, the only data center is in Hawaii, with a natural priority for US data.
The objective of this sub-task was mainly to facilitate the acquisition and data processing of currents measured by SADCP, particularly for Atlantic transoceanic sections for which ocean currents are part of the Essential Observing Variables required by the Global Ocean Ship-based Hydrographic Investigations Program (GO-SHIP). Three main actions were undertaken and developed hereafter: a 2-week visit to the
“Currents Group” within the School of Ocean and Earth Science and Technology (SOEST) of the University of Hawaii, the upgrade of the software CASCADE to include the result of this exchange, and the data
processing of 3 GO-SHIP sections (including assistance to the Irish leader group of the section A02 in 2017).
In the near-future, the objective is to build a strong partnership with the US data center to be able to provide in-situ subsurface current data globally.
3.1 Visit to the “Currents Group” at the University of Hawaii (April 30 to M ay 13, 2018)
3.1.1 Objectives
Considering the dynamics of the Galway Agreement and the long-term objective of coordinating the
databases at an international level, it was necessary to meet with the reference group in terms of SADCP: the
“Currents Group” of University of Hawaii, and particularly, Eric Firing and Julia Hummon. After several video conferences, Pascale Lherminier was invited to visit them in May 2018 with the following objectives:
• Learn about the last development of CODAS, their processing software of SADCP data developed since 1991.
• Present CASCADE, the software developed at LOPS since 1994
• Give a seminar on the results gained with the GO-SHIP section OVIDE-A25
• Compare and improve both software packages
• Discuss “Best practices”
• Determine what data format is the most appropriate for the European database
- 19 - 3.1.2 The Current Group of UH
The Currents Group at UH is leading the acquisition and data processing of at least 20 American
oceanographic ships. They also maintain the software “Codas processing” (called Codas hereafter) that is now written in Python and runs on all platforms, but preferentially in a Unix environment. They historically have had a great role in SADCP data acquisition and processing since the WOCE program in the late 1980s.
The group is composed of 5 persons: Eric Firing, Julia Hummon, Thomas Roc, Toby Martin and Uggo de Pinho, and the 4 of them work full time on the SADCP data. Each member has a specific role.
3.2 SADCP data acquisition
In terms of acquisition, the Currents Group installed their own UHDAS software instead of VmDAS on each ship (VmDAS is the software provided by the manufacturer of the SADCP, Teledyne-RDInstruments)2. Note that it requires a certain level of expertise since the software communicates directly with the instrument and also collects the navigation data to remove the platform movements from the velocity data measured by the SADCP. Making this choice at the European level would require several years of coordination and work, and it seems unreachable at this point. Although VmDAS has some defaults, it has proven to provide data of very good quality, and it has the advantage of being maintained by the manufacturer when the instruments are upgraded.
3.3 SADCP data processing with CODAS
The CODAS software is the data processing tool, presently written in C. First conceived as a series of subroutines, it has evolved to be more user friendly, particularly because the processing steps have become increasingly automated, and because the visualization tools are now written in Python. It is used by a large community of scientists. Working together on the OVIDE-BOCATS dataset, AtlantOS scientists were able to provide some suggested improvements to the new interface (coded in python), and detected a minor mistake in the final Netcdf file. The best improvement was to be able to process the raw data as well as the data averaged by VmDas (called STA files) to compare the results.
Several improvements were also implemented in our software CASCADE, resulting from discussions on the details of the processing. The most important ones are:
• the introduction of the Percent Good as an adjustable parameter of qualification
• a better estimate of misalignment and amplitude bias based on bottom-track data
• more information in the meta data
• a better correction of the side lobe interference near the bottom
2 https://currents.soest.hawaii.edu/docs/adcp_doc/
- 20 -
• a SADCP cruise file that allows the concatenation of elementary STA files that have a different number of cells.
3.4 SADCP data format
Concerning the format of the data, the CODAS short-form Netcdf file are intended for most end-users and is adapted for distribution to data bases. A recent evolution of CODAS allows one to take advantage of the full resolution of the dataset, which is appropriate considering the need now for more spatial resolution
(comparison with the products of the future high-resolution altimeter of the SWOT satellite, for example).
The chosen variables are:
1. time: Time at the end of the ensemble, days from start of year.
2. lon, lat: Longitude, Latitude from GPS at the end of the ensemble.
3. u,v: Ocean zonal and meridional velocity component profiles.
4. uship, vship: Zonal and meridional velocity components of the ship.
5. heading: Mean ship heading during the ensemble.
6. depth: Bin centers in nominal meters (no sound speed profile correction) 7. tr_temp: ADCP transducer temperature.
8. pg: Percent Good pings for u, v averaging after editing.
9. pflag: Profile Flags based on editing, used to mask u, v.
10. amp: Received signal strength in ADCP-specific units; no correction for spreading or attenuation.
The information that is missing from this list is the estimation of the error on each data point. A basic error can be estimating from the instrumental error given by the manufacturer and the number of pings that have been averaged, but the trickiest part is the precision of the ship heading and of the correction of the
alignment of the instrument that can introduce a bias when the ship is moving fast. We will probably need several interactions with the group to determine how we can introduce this information.
Another important variable that could be introduced is the bottom depth given by the instrument when the bottom track is active. This is information that could be useful for seabed mapping on shelves and slopes, although it is not as precise as multibeam data.
The deliverable 7.5 also underlined the usefulness to have both wind and tide data associated to each profile .Currents induced by barotropic tides are already estimated by CASCADE using TPXO satellite products.
- 21 -
The data processing involves many more parameters than those reported in this short format. It seems important to keep genuine files with all this information. However, those files could be kept on national repositories, providing that the short format metadata keeps track of its position.
3.5 SADCP Best Practices
The guidelines report of the Currents Group (Firing and Hummon, 2010) is available through the GO-SHIP site and offers valuable advices for the acquisition and processing of SADCP data. It has been decided to write a new version of this report before OceanObs19 that would clearly separate the acquisition software (UHDAS and VmDas) and introduce CASCADE as a possible processing software.
3.6 The SADCP processing software CASCADE V7.2
CASCADE, an open-source Matlab toolbox dedicated to the SADCP data processing, was born in the mid- 1990s. Indeed, there was a need for a more user-friendly software than CODAS to process and visualize the SADCP data, in order to delegate the processing of data acquired on “non-physical-oceanography” surveys (transits, geological cruises …) to the data center or to non-specialists. The need for fast and convenient plotting made Matlab the ideal tool for this purpose. It was also important for the French Oceanographic Fleet to have a group of experts at the Physical Oceanographic Laboratory (now LOPS) to choose the relevant SADCPs and analyze the resulting data for feedback.
CASCADE changed, following the evolution of the instruments and Matlab, including also the feedback from the users (from France, Spain, Russia…). With AtlantOS, version 7.0 was born in June 2015, and a series of improvements led to the version 7.2 in September 2018.
The subroutines in CASCADE 7.2 follows quite closely the algorithms that are implemented in CODAS, and the general objective is the same: to provide a cruise SADCP file with qualified data. The main differences are:
CASCADE proposes a step by step processing through a graphical interface that gives a choice for the thresholds and criteria used to qualify the data (default values are proposed, that work most of the time) As CODAS, it proposes and apply corrections specific to each instrument: the alignment of the SADCP in the coordinate system of the ship navigation, the amplitude of the velocities that can be affected by the quality of the window behind which the SADCP is installed, and also the SADCP trim (useful to correct vertical velocities). The latter is not in CODAS.
It does not yet consider the distance between the SADCP and the inertial navigation system, but this will be done soon and is not critical as long as this distance is less than 5 m.
It corrects for the roll and pitch provided by the inertial navigation system (not done in CODAS). The comparative study of CODAS and CASCADE showed that it was not critical most of the time, since data are averaged on at least 2 minutes, which is much longer that the typical period of the swell.
- 22 -
CASCADE provides an easy way of extracting sections or stations and plot the data either with vertical sections or with vectors on a map.
It provides the interpolation of different bathymetries (GEBCO, ETOPO1…) along the ship route to complement the data.
It provides the calculation of barotropic tide velocities using the TPXO products.3 CASCADE and its documentation are available freely on
http://www.umr-lops.fr/en/Technology/Software/CASCADE-7.2
The documentation, in French, is presently being translated in English. The software can be run in English and French. The last training day occurred in March 2018.
3.7 Processing of the SADCP data of 3 Atlantic GO-SHIP surveys
3.7.1 BOCATS-A25:18 June – 31 July 2016The BOCATS cruise, led by Fiz Perez on the B/O Sarmiento de Gamboa, aimed to assess the transport of water, salt, heat, natural and anthropogenic CO2, other biogeochemical tracers (Chlorofluorocarbons –CFC-, methane (CH4) and dinitrogen oxide (N2O) and determine CO2 fluxes between the water column and
sediment along a section that has been repeated from 2002 (www.umr-lops.fr/Projets/Projets-actifs/OVIDE).
It is part of international programs GOSHIP (http://www.go-ship.org/RefSecs/goship_ref_secs.html) and CLIVAR / IOPCC. These programs allow coordinating the different actions in the Atlantic and manage the databases of CLIVAR, IOPCC and GLODAP. The main line of the BOCATS cruise, the OVIDE section, has been the subject of study in European projects CARBOOCEAN and CARBOCHANGE
(http://carbochange.b.uib.no/) and the earlier project National Plan CATARINA. In April 2014, the H2020 AtlantOS project "Optimizing and Enhancing the Integrated Atlantic Ocean Observing Systems Research”
began coordinating the European activities related with GOSHIP and also supporting the OVIDE section. In fact, part of the chemical group in BOCATS cruise was supported by AtlantOS.
Two SADCPs (Ocean Surveyor model of RDInstruments) are installed on the de Gamboa in a “quillas” that can be lowered at 10 m below the surface: one at 75 kHz and one at 150kHz (called OS75 and OS150 respectively). Both were connected with a cable to ensure synchronization, the OS75 being the master. The OS75 was tuned in Narrow Band to obtain the maximum range possible (about 820 m), and the OS150 in broad band to have more precision in the surface layers (down to about 250 m, but sometimes less). The OS75 worked perfectly, providing excellent continuous data along the whole cruise without a single failure.
The range of the OS150 was a little disappointing, but the data could be used to validate the OS75 data as expected.
3 http://volkov.oce.orst.edu/tides/global.html
- 23 -
The data were all processed by P. Lherminier with the Matlab software CASCADE V7.0. The alignment (45.13°) and amplitude of the OS75 were good and did not need any correction. To improve the estimate of the vertical velocities, the pitch was corrected by 2.5°. The alignment already implemented in VmDAS for the OS150 was obviously wrong. The correct value is believed to be 45.78°. The amplitude correction has different values depending on the way to estimate it (bottom track or correlation method). This is why we ended the cruise with a cross-section on the Iceland Shelf to estimate it more precisely, along with the alignment; those data will be analyzed on shore. However, with the amplitude unchanged, the alignment corrected to 45.78° and the pitch corrected by 2.5°, we obtained a mean difference between both OS of 0.03 and 0.56 cm/s for the zonal and meridional velocities respectively in the 80-180m layer, with a standard deviation of 1.7 cm/s. This is better than the precision of the instruments given by the manufacturer (RDI) in the chosen configuration, i.e. 2.5 cm/s for the OS75 and 1.25 cm/s for the OS150.
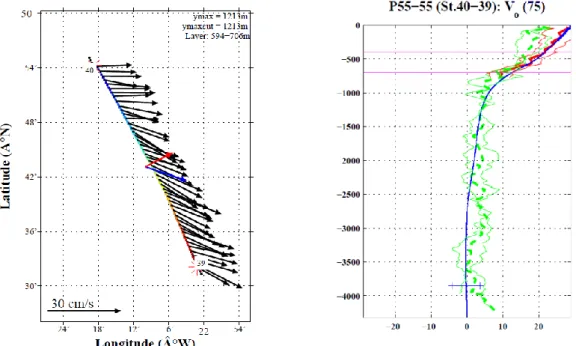
Most of the mean velocity profiles between stations were in very good agreement with relative geostrophic profiles computed from CTD data in terms of vertical velocity shear (Figure 7), allowing the determination of the velocity at any reference level with a reasonable certainty. Note that most of the time, as shown on the example, averaging the LADCP profiles is less precise, and sometimes totally wrong (Lherminier et al., 2007).
Figure 7: Left panel: Currents in the 600-700 m deep layer between stations 39 and 40, average in blue and projection in red. Right panel: Comparison of geostrophic velocity profile (blue), LADCP profiles and their average (green) and SADCP mean velocity profile (red) in cm/s. The horizontal bar at 3900 m indicates the velocity at the chosen reference level along with its uncertainty.
- 24 -
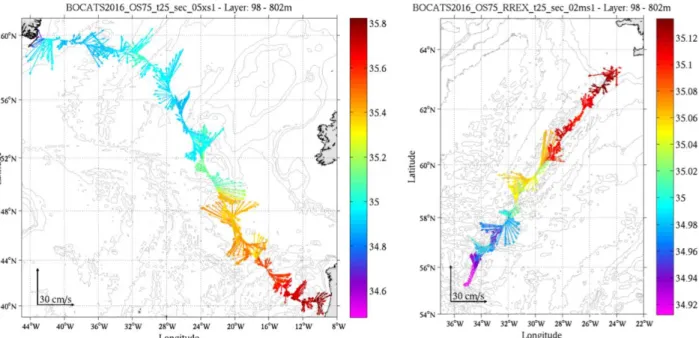
Figure 8: Currents averaged in the, 100-800 m layer along the BOCATS-OVIDE section, measured by the OS75 across the OVIDE-A25 section from Greenland to Portugal (left panel), and across the Reykjanes Ridge (right panel; Iceland is visible on the northeast corner). Salinity is interpolated from CTD data in the same layer.
On the OVIDE section (Figure 8), the SubArctic Front that delimits the eastern rim of the Subpolar Gyre stands out at 49.5°N by its gradient of salinity (from 35.4 to 35.1) and the strong northwestward current.
Farther north, the circulation around Reykjanes Ridge and the Western Boundary Current (WBC) was found to be similar to previous observations, although the WBC appeared stronger when the section was rerun backwards 2 days later. As usual, the North Atlantic Current between 44°N and 55°N exhibits extensive meandering.
Along the Reykjanes Ridge, the currents were significantly influenced be the tide. Once the data were detided using the TPXO 8.2 model (Figure 2b), the flux was mainly westward, except for an eddy at 58°N.
The positive gradient of mean salinity reveals the increased importance of Atlantic Central Water on the ridge when going north.
3.7.2 A02 April-May 2017
In April-May 2017, the Irish Marine Institute and National University of Ireland, Galway (NUI Galway) led an international partnership to complete the GO-SHIP A02 line on the Irish national research vessel, the RV Celtic Explorer. The A02 line is shown in Figure 3. Measurements of CFCs, CO2 chemistry, nutrients, hydrography and currents were carried out (See Section 2.3).
- 25 -
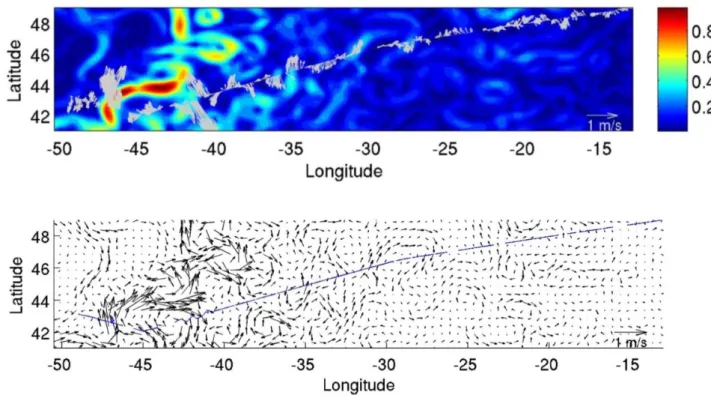
Figure 9. Upper panel: vector plot of SADCP currents in 56 m water depth (light gray arrows). Only every 4th vector is shown. Coloured contours show geostrophic surface current speed (in m/s) from the AVISO satellite altimetry (0.25 degree spatial resolution). Lower panel: vector plot of AVISO geostrophic currents (blue line indicates SADCP cruise track).
The protocols and configuration of the acquisition of current data by the SADCP OS75 was carefully prepared before the cruise through skype meetings and email exchanges. Involved were: Caroline Cusak, Adam Leadbetter and Kieran Lyons (Marine Institute, Ireland), Christian Mohn (Aarhus University, Denmark), Daniel Torres (WHOI, USA) and Pascale Lherminier (Ifremer, France). Then, data were processed by CODAS (C. Mohn) and Cascade (P. Lherminier), leading to very similar and satisfactory results. The main outcome was a correction of the alignment of the SADCP by 6.8° in CODAS, and 7° in CASCADE V7.2. The difference is within the expected error of 0.3°.
The final dataset includes 5-minute-averaged profiles of the 3D variables u (East-West velocity component in m/s), v (North-South velocity component in m/s, raw echo amplitude (raw counts) and percent good value (quality indicator in percent).
The final data in the subsurface layer (Figure 9) are in reasonable agreement with surface velocities deduced from altimetry, both in amplitude and direction, with very strong currents in the meandering North Atlantic Current on the western part of the section.
3.7.3 OVIDE-A25 2018
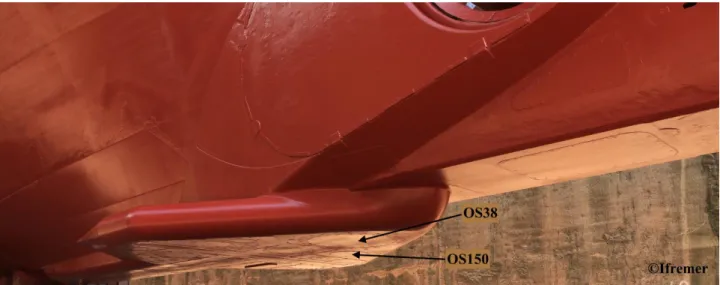
In June-July 2018, the OVIDE-A25 section was visited for the ninth time, aboard N/O Thalassa. The ship was totally remodeled in summer 2017, with the installation of a gondola under the hull that could
- 26 -
accommodate a multibeam echosounder and a fish sounder in addition to the OS150 kHz and the OS38kHz (Figure 10).
Figure 10: View of the hull of Thalassa before the installation of the acoustic sensors. The gondola has the shape of an arrow, on the position of both SADCP are indicated.
Soon after departure, both (brand new) gyrocompasses failed, which is very rare, and could not be rebooted with a satisfactory stability. Those instruments are required for navigation and for the ADCP measurements as they provide an accurate heading. So, we returned to Brest and mounted two spare gyrocompasses from the previous generation that proved to be reliable for ADCP data. As a consequence, recalibration of both ADCP alignment was performed on the Brittany shelf, leading to a correction of 0.08° and -0.9° on the OS38 and OS150 respectively, although a final tuning may be needed. The amplitude was also adjusted by 0.5%
and 1% respectively. Data were averaged on 2-minute intervals. The data return of both instruments was 98%. We benefited from the great range of the OS38, at least 1200 m, as shown on Figure 11 for data flagged as good. Mapped velocities (Figure 12) gives a better view of the richness of this dataset.
- 27 -
Figure 11: Velocity magnitude (upper panel) and direction (lower panel) from the OS38 measurements, from Biscaye to Brest via Greenland (see Figure 6). Data flagged as bad are not shown. The white areas correspond to the Iberian Shelf, the Greenland Shelf and the French Shelf, respectively (from left to right)
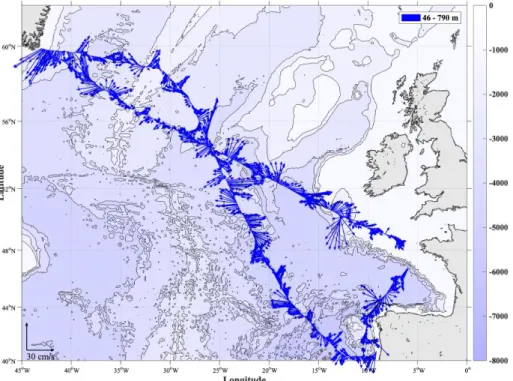
Figure 12: Detided currents measured by the OS38, averaged vertically between the uppermost layer and 800m and horizontally on segments of 5km.
- 28 -
3.8 A short list of acronyms
BOCATS : Biennial Observation of Carbon, Acidification, Transport and Sedimentation in the North Atlantic
CASCADE: Chaine Automatisée de Suivi des Courantomètres Acoustiques Doppler Embarqués CODAS: Common Ocean Data Access System
LOPS: Laboratory for Ocean Physics and Satellite remote sensing Netcdf: Network Common Data Form
OS: Ocean Surveyor, a phase-array SADCP built by Teledyne-RD Instrument
OVIDE: Observatoire de la Variabilité Interannuelle à DEcennale en Atlantique Nord
SADCP: Ship-mounted Acoustic Doppler Current Profiler (also called VM-ADCP for Vessel-Mounted ADCP)
STA: Short Term Average (extension of data files generated by VmDas) TPXO: Topex/Poseidon Global Tidal Model
UHDAS: University of Hawaii Data Acquisition System VmDas: Vessel-mount Data acquisition system
- 29 -
4 Technical coordination of the Atlantic GO-SHIP activities
A GO-SHIP coordination office (hosted at JCOMMOPS in Brest) was supported and tasked with setting up links to hydrographic programs in the Atlantic Ocean, keep record of efforts (both past and upcoming) and provide a forum where overlaps, duplications and gaps can be identified. During the AtlantOS project, the Repeat Hydrography Coordination task comprised of the general project office work on ad-hoc basis: the technical coordinator acted as a focal point and clearing house, providing information, documentation and expertise as required. The office collected cruise history, i.e. collecting information from cruise reports and data centers with the aim of identifying which lines have been sampled how often with which suite of parameters; in total more than 300 cruises were analysed and consolidated, with information granularity as defined by the GO-SHIP committee. This constituted an important base for the GO-SHIP program to efficiently coordinate the program. The office implemented a corresponding database structure as part of JCOMMOPS Information System, including detailed cruise, parameter and ship information, and feeding of the system with the metadata extracted in the preceding step; this system is embedded in the cross-panel JCOMMOPS monitoring system and allows for an integrated management and comparison of all sustained in-situ ocean observing systems, in which the role of repeat hydrography cruises as deployment or
calibration opportunity for other observing systems can be better highlighted and also measured, inter alia with integrated and interactive maps, Figure 13. In this figure, all Repeat Hydrography Cruises have been queried in the Atlantic Ocean Region, then visualized on the interactive map, on which one particular cruise (Maria S. Merian Cruise in Jan/Feb 2017) was selected and corresponding details shown in a pop-up window; these details also include information on contributions to other observing networks; in this case Argo float deployments from this cruise are shown. A last window shows performance indicators for the global repeat hydrography program, here in terms of reference line numbers, occupation of these lines in the present survey, and number of international partners.
The AtlantOS GO-SHIP office investigation which countries were planning hydrographic cruises in the AtlantOS timeframe, and which of these cruises were planned in vicinity of, or directly on, a repeat hydrographic line, with which parameters and sampling strategy. Again crucial information needed for effective and efficient coordination of the GO-SHIP program, Figure 14.
The AtlantOS coordination office was in regular contact with, and in coordination of, the GO-SHIP Committee to agree on targeted reference line grid, on data requirements and submission timelines, and creation/publication of corresponding documents, maps and statistics. With repeat hydrography data having various international archives for different parameters, the support and tracking of timely data submission was enhanced through API based machine-to-machine data exchange, in particular with the CLIVAR &
Carbon Hydrographic Data Office (CCHDO).
- 30 -
Figure 13: Typical working environment in Repat Hydrography Scheme on www.jcommops.org:
Figure 14: A screenshot from the GO-SHIP website with information about planned cruises.
The AtlantOS GO-SHIP office led a review of the Repeat Hydrography Observing Manual, including identification of appropriate authors with Committee for updates as needed. Updates are published on the
- 31 -
GO-SHIP website as they become available and are also submitted to the IODE best practices portal.
Identification of publications based on repeat hydrography data and creation of a corresponding online bibliography, with innovative metrics for the measurement of repeat hydrography data uptake was another important task that was carried out, see Figure 15. The GO-SHIP bibliography is maintained as ZOTERO Group; more than 500 items have been identified which build on GO-SHIP data. All bibliography items have a full set of metadata with it, including abstract and link to the document. Items can be filtered and exported as needed. All bibliography items are manually mirrored in a Scholar Repository (Figure 16), allowing for the citation tracking for the documents and therewith serving as indicator for GO-SHIP data uptake; new items naturally have few citations, but older items have several thousand citations. Items can be filtered by title, year, or number of citations. Every item has a full set of metadata and link to the document.
Figure 15: A screenshot of the ZOTERO GO-SHIP bibliography.
- 32 -
Figure 16: A screenshot of the Google Scholar GO-SHIP repository.
Additional tasks of the AtlantOS GO-SHIP office included: 1) Organization or support of community meetings, face-to-face or online, management of meeting facilities, agenda, invitations and reporting, continuous management of emerging action item list. Compiling and publication of corresponding meeting reports, 2) Communicating relevant information to the community, in mailing lists, social media, website announcements on go-ship.org , 3) Liaise with other observing networks as required, i.e. for the deployment or recovery of autonomous instruments (e.g. Argo) from repeat hydrography cruises, and 4) Representation of the repeat hydrography community at related meetings, in particular of the Ship Observations Team, Observations Coordination Group, Data Management Coordination Group, International Research Ship Operators. The GO-SHIP website, www.go-ship.org was also maintained and updated by the AtlantOS GO- SHIP office, Figure 17. The website of the international GO-SHIP program serves as information and documentation exchange platform for community members. Meeting reports, cruise plans or manuals are continuously updated; the site also redirects to the GO-SHIP Bibliographies.
- 33 - Figure 17: Screenshot of the GO-SHIP website.
- 34 -
5 References
Firing, E., and J.M. Hummon, 2010. Ship-mounted acoustic Doppler current profilers. In The GO-SHIP Repeat Hydrography Manual: A Collection of Expert Reports and Guidelines. E.M. Hood, C.L. Sabine, and B.M. Sloyan, eds, IOCCP Report Number 14, ICPO Publication Series Number 134. Available online at: http://www.go-ship.org/HydroMan.html (accessed March 19, 2012).
Joyce, T.M. (1989) : On in situ “calibration” of shipboard ADCPs. J. Atmos. Oceanic Technol., 6 (2), 169–
172.
Lherminier P., Mercier H., Gourcuff C., Alvarez M., Bacon S., Kermabon C., 2007. Transports across the 2002 Greenland-Portugal Ovide section and comparison with 1997. J. Geophys. Res.-Oceans, Vol. 112 (C07003). DOI: 10.1029/2006JC003716.