Francis G. Castles, Herbert Obinger Towards More Comprehensive Measures of
Social Support:
Adding in the Impact of Taxes and Private Spending or Netting Out the Impact of Politics
on Redistribution?
ZeS-Arbeitspapier Nr. 04/2006
Zentrum für Sozialpolitik Universität Bremen
Parkallee 39 28209 Bremen
Francis G. Castles, Professor of Social and Public Policy, University of Edinburgh, Adjunct Professor of Political Science, Research School of Social Sciences, the Australian National University and Fellow of the Hanse Wissenschaftskolleg, Delmenhorst.
Herbert Obinger, PD Dr., Centre for Social Policy Research, University of Bremen
Herausgeber:
Zentrum für Sozialpolitik Universität Bremen - Barkhof -, Parkallee 39 28209 Bremen
Tel.: 0421/218-4362 Fax: 0421/218-7540
e-mail: srose@zes.uni-bremen.de http://www.zes.uni-bremen.de ZeS-Arbeitspapiere
ISSN 1436-7203
Summary
.
This paper offers a critique and analysis of recent OECD research by Adema and Ladaique identifying the impact of taxes and private benefits on social spending. Using the techniques of multivariate modelling, we show that both gross public and net private expenditures are strongly influenced by partisan incumbency, although in opposite directions, and that the more we net out the effect of taxes, the less politics matters and the more spending is shaped by economic forces. In a second stage of the analysis, we show that the crucial mechanism of welfare state redistribution is the taxation of gross social expenditure and demonstrate that this effect is almost entirely political in nature.
Eine neue OECD-Studie von Adema und Ladaique schätzt Nettosozialleistungsquoten für 23 OECD-Länder. Mit Hilfe multivariater Analysemethoden untersuchen wir die Determi- nanten dieser um Steuern und private Sozialausgaben bereinigten Sozialleistungsquoten.
Wir zeigen im ersten Teil dieses Arbeitspapiers, dass die Varianz der Bruttoausgabenni- veaus und der privaten Sozialausgaben hochgradig von der parteipolitischen Färbung der Regierung beeinflusst wird. Je stärker der Analysefokus von Brutto- zu Nettoausgaben ver- lagert wird, desto schwächer werden politische Einflüsse auf die Sozialausgabenniveaus, während umgekehrt die Bedeutung ökonomischer Stellgrößen zunimmt. Im zweiten Teil des Papiers zeigen wir, dass die Besteuerung von Sozialleistungen den zentralen Mecha- nismus für Umverteilungspolitik darstellt und demonstrieren, dass dieser Effekt fast aus- schließlich politisch determiniert wird.
Contents
1 Introduction... 5
2 The data... 7
3 Determinants of gross and net social expenditure ... 10
4 Politics and Redistribution ... 17
5 An Afterword ... 21
Appendix... 22
References... 23
Tables and Figures
Table 1: Social expenditure as a percentage of GDP (at market prices) in 2001 ...8Table 2: Correlations between different categories of social spending...9
Box 1: Major schools of thought in comparative public policy analysis ...10
Table 3: Determinants of gross public social expenditure 2001 ...13
Table 4: Determinants of net current public social expenditure...14
Table 5: Determinants of net current private social expenditure...15
Table 6: Determinants of net total social expenditure 2001...17
Table 7: Correlations between expenditure categories and redistributional outcomes ...18
Figure 1: Public social expenditure taxation incidence in 2001 and bourgeois ...20
cabinet seats 1950-2000 ...20
1 Introduction
Almost certainly, the most comprehensively studied field of comparative public policy has been the welfare state. The major reason that social policy outcomes have been so appealing to scholars was, undoubtedly, the early availability of cross-national, welfare expenditure data compiled by international organisations such as the ILO and the OECD. Despite its popularity, however, such research has been strongly critiqued from the outset. Quite apart from obvious difficulties result- ing from the limited reliability of cross-national spending data and inconsistent time-series, it has also been suggested that social expenditure is “epiphenomenal to the theoretical substance of welfare states” (Esping-Andersen 1990: 19-20). More specifically, it has been argued that expen- diture can neither identify and measure the redistributive effects of social programmes nor shed light on real outcomes for welfare clienteles far better captured by information concerning quali- fying conditions, programme coverage and benefit replacement rates. Expenditure-based studies relying on publicly provided data about publicly provided programmes have also been blamed for a tendency on the part of scholars to ignore both the incidence and outcomes of private provision.
In a nutshell, public expenditure by itself has been widely seen as an insufficient basis for provid- ing a nuanced account of welfare provision or identifying its effects (Castles 1993: 350).
However, both data availability and comparability have improved very considerably over the past decade with the publication of the OECD Social Expenditure Database (SOCX). This dataset dis- aggregates social expenditure into a series of what were originally thirteen, but, in the most recent version (OECD 2004), nine, components of spending and numerous separate programme headings for all the long-term member countries of the OECD from 1980 onwards, permitting far more detailed analysis of cross-national spending profiles than ever before (see Castles 2004). Despite these improvements, the dataset can still be criticised because it does not adjust expenditure to take account of the potentially distorting effects of diverse tax policy regimes and cross-nationally distinct public-private mixes. Some countries tax social benefits, while others do not. Some man- date employers to pay benefits to workers that would elsewhere be directly provided by the state.
Some offer tax relief to encourage individuals to contribute to privately-run schemes, while others scrupulously avoid such interventions. Finally, in some countries, spending on private welfare schemes is much higher than in others. The result is that the quantum of welfare provided to indi- viduals in a given society corresponds only very loosely with the gross expenditure figures re- ported in budget documents, National Accounts statistics and the datasets produced by interna- tional organisations such as the OECD.
For some time, the OECD has been attempting to overcome these difficulties by providing infor- mation on net (after tax) public and private social expenditure for an increasingly larger number of member states. In the latest adumbration of this important research effort, Adema and Ladaique (2005) seek “to elaborate more comprehensive measures of social support” by taking into account the impact of taxes and private spending in a group of countries now numbering more than twenty. Key findings of this study are that [both public and private] net social expenditure/GDP ratios are markedly more similar than the more usually compared gross public expenditure meas- ure and that the shift to net social expenditure figures leads to remarkable changes in the reported
relative magnitudes of welfare spending across the OECD world. The authors claim that, in con- trast to gross spending figures, their “the net current public social expenditure indica- tor…provides a picture of what governments ‘really’ devote to social spending” and that their measure of net current total social expenditure [which includes private benefits] “allows [us] to assess what part of an economy’s domestic production recipients of social benefits draw on”
(Adema/Ladaique 2005: 6). Seemingly, then, governments and economists have reasons be as interested – or even more interested – in cross-national comparisons of net than of gross spending.
The underlying purpose of this paper is to ask whether a similar conclusion holds for students of public policy and those concerned with the redistributive impact of social spending. In particular, we seek to establish whether changes in cross-national spending relativities resulting from these new ways of measuring expenditure have any consequences for the explanatory power of the main schools of thought in comparative public policy analysis. Much of our knowledge concern- ing the political and socio-economic determinants of the welfare state rests on the analysis of gross social expenditure and much of our understanding of the purposes of the welfare state rest on assumptions about linkages between gross expenditures and redistributive policy outcomes.
Given a much greater similarity in net spending levels across countries, it is important to investi- gate whether the main bodies of theory in comparative public policy analysis remain relevant in accounting for cross-national variation in net expenditures and whether the link between net ex- penditures and outcomes resembles that between gross spending and outcomes. The inclusion of voluntary private spending data in the OECD study also opens up other important avenues of in- quiry. In particular, the existence of such data allow us to ask questions about the extent to which established theoretical paradigms can illuminate cross-national differences in public-private mixes in welfare state provision in the advanced OECD countries.
The fact that data on net spending are now available for a sizeable number of countries makes it possible for us to use multivariate regression analysis and other simple statistical techniques to provide preliminary answers to these questions. The results are striking, pointing to the crucial importance of economic factors in shaping net expenditure levels, and possibly suggesting the need for a reappraisal of once dominant, but no longer fashionable, functionalist accounts of so- cial expenditure development. Although our analysis suggests that partisanship plays no part in explaining total net social expenditure levels, we find evidence that it is an extremely powerful factor in accounting for the nature of the public-private mix in social policy. We also note inter- esting findings in respect of the impact of political institutions and the timing of welfare state con- solidation, the latter indicative of a moderately strong path dependency effect on post-war expen- diture development. Finally, we show that much of the redistribution effected by welfare states is a function of the incidence of taxation on benefit expenditure, which is only full captured in meas- ures of gross expenditure and which is almost entirely politically determined. Because we regard such redistributive outcomes as being central to the theoretical substance of welfare states, we question whether these new measures of net spending ‘really’ do tell us more than the measures of gross spending they are seen as superseding.
The remainder of the paper is organised as follows. We start by providing a brief overview of net social expenditure figures and investigate the extent to which the cross-national relativities they reveal differ from those familiar from research on gross expenditure levels. Next, we analyse the determinants of expenditure levels variously including or excluding the impact of taxes, manda- tory expenditures and private spending. Starting with the analysis of gross expenditure and using
the same set of independent variables, we extend the analysis to various categories of net social expenditure, including finally expenditures net of both taxes and private spending. We complete our analysis by demonstrating that the extent of taxation on gross spending is a crucial predictor of the redistributive impact of the welfare state and that this taxation effect is strongly shaped by the partisan complexion of government. The final section concludes with an afterword.
2 The data
Since its first publication in the mid-1990s, the OECD Social Expenditure Database has increas- ingly been the data source of choice for most comparative research relating to the welfare state.
This source provides disaggregated data on gross social expenditure and its component pro- grammes dating back to 1980 for all the long-term OECD member states. Unfortunately, however, the dataset does not provide information concerning cross-national differences in the impact of tax policy on social expenditure, the extent of benefits mandated by but not provided by the state and the quantum of voluntary private social spending. At a minimum, this means that our understand- ing of the cross-national relativities of social spending is incomplete. Arguably, it also suggests that the prevailing understanding is distorted. Tax policy influences social expenditure in two important ways (Adema/Ladaique 2005: 15-16). First, governments can levy taxes and social se- curity contributions on transfer payments and/or may levy indirect taxes on good and services bought by the recipients of such transfers. Second, governments can mandate third parties [pre- dominantly employers] to provide benefits or can provide incentives to private provision by grant- ing tax breaks and/or by encouraging the private acquisition of functional equivalents to cash benefits by means of tax relief.
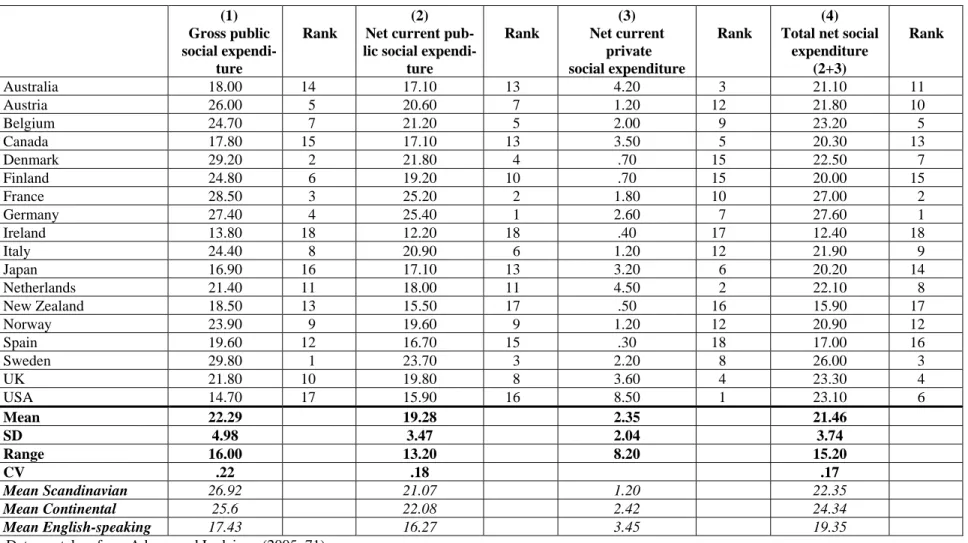
The Adema and Ladaique study (2005) nets out all of these tax effects to move from a category of gross public social expenditure to one of net current public social expenditure. The study also estimates the extent of net current private social expenditure by summing the quantum of manda- tory and voluntary private social expenditure in each country, once again netting out the effects of both direct and indirect taxes. Adding together net current public and private expenditures, the study arrives at a figure for net total social expenditure, which, as already noted, is seen as consti- tuting “that proportion of an economy’s domestic production to which recipients of social benefits lay claim” (Adema/Ladaique 2005: 30). The study estimates spending under these headings for 23 countries in 2001. Table 1 reports data for 18 of these countries selected largely on the basis of the availability of information on the independent variables featuring in our analysis. The expenditure figures reported in Table 1 are related to GDP at market prices (Adema/Ladaique 2005: 71), al- though the Adema and Ladaique study itself prefers comparisons at factor cost (Adema/Ladaique 2005: 32). We have used the study’s market price estimates because we are interested in com- parisons with gross expenditure levels, which typically are expressed as percentages of GDP at market prices.
Table 1: Social expenditure as a percentage of GDP (at market prices) in 2001
(1) Gross public
social expendi- ture
Rank
(2) Net current pub- lic social expendi-
ture
Rank
(3) Net current
private social expenditure
Rank
(4) Total net social
expenditure (2+3)
Rank
Australia 18.00 14 17.10 13 4.20 3 21.10 11
Austria 26.00 5 20.60 7 1.20 12 21.80 10
Belgium 24.70 7 21.20 5 2.00 9 23.20 5
Canada 17.80 15 17.10 13 3.50 5 20.30 13
Denmark 29.20 2 21.80 4 .70 15 22.50 7
Finland 24.80 6 19.20 10 .70 15 20.00 15
France 28.50 3 25.20 2 1.80 10 27.00 2
Germany 27.40 4 25.40 1 2.60 7 27.60 1
Ireland 13.80 18 12.20 18 .40 17 12.40 18
Italy 24.40 8 20.90 6 1.20 12 21.90 9
Japan 16.90 16 17.10 13 3.20 6 20.20 14
Netherlands 21.40 11 18.00 11 4.50 2 22.10 8
New Zealand 18.50 13 15.50 17 .50 16 15.90 17
Norway 23.90 9 19.60 9 1.20 12 20.90 12
Spain 19.60 12 16.70 15 .30 18 17.00 16
Sweden 29.80 1 23.70 3 2.20 8 26.00 3
UK 21.80 10 19.80 8 3.60 4 23.30 4
USA 14.70 17 15.90 16 8.50 1 23.10 6
Mean 22.29 19.28 2.35 21.46
SD 4.98 3.47 2.04 3.74
Range 16.00 13.20 8.20 15.20
CV .22 .18 .17
Mean Scandinavian 26.92 21.07 1.20 22.35
Mean Continental 25.6 22.08 2.42 24.34
Mean English-speaking 17.43 16.27 3.45 19.35
Data are taken from Adema and Ladaique (2005: 71).
Notes: Scandinavian family of nations: Denmark, Finland, Sweden and Norway.
Continental family of nations: Austria, Belgium, France, Germany and the Netherlands.
English-speaking family of nations: Australia, Canada, Ireland, New Zealand, the UK and the U.S.
Table 1 presents a simplified version of Adema and Ladaique’s findings for 18 long-term OECD countries. Column 1 reports gross public social expenditure and various categories of net spending are reported in columns 2-4. Table 1 also includes rankings for each of the four variables. The rankings make it simple to identify the striking changes that occur as we move across the columns from gross public to total net expenditure. Countries such as the U.S. and the UK, traditionally regarded as ‘residual’ or ‘liberal’ welfare regimes, increas- ingly appear in the spending vanguard once taxes are netted out and once private social expenditures are taken into account. Whereas the majority of English-speaking countries and continental Western European countries are ranked higher in terms of total net social expenditure, the Social Democratic welfare states of Scandinavia move downward in the international net spending league. As a result, average levels of total net social spending for the three families of nations reported in the summary statistics section of Table 1 are mark- edly more similar than in respect of gross expenditure. Equally, as we move towards more netted and more inclusive measures of total spending, coefficients of variation decline ap- preciably. These figures suggest that the major dividing line between the different welfare state regimes or families of nations is defined less by the extent of the total welfare effort and rather more by differences in the public-private mix of benefit provision typical of these groups of countries. Private spending in the English-speaking world is almost three times higher than in Scandinavia. Conversely, looking at the difference between columns 1 and 2, we can see that the incidence of taxation on social spending in the English-speaking world is significantly lower than in either of the other two families of nations.
Table 2: Correlations between different categories of social spending
Gross public social expenditure
Net current public social expenditure
Net current private social expenditure
Net current public social expenditure .920*
Net current private social expenditure -.382 -.133
Total net social expenditure .689* .881* .350
Note: Pearson correlation coefficient. Significant correlations are denoted by an asterisk.
Table 2 reports correlations between the four spending measures presented in Table 1. The fact that the correlations between net current private spending and the exclusively public categories are negative strongly suggests that public and private spending are, in some measure, substitutes for one another. This, in turn, implies that a neglect of private spending does, at least, to some extent, distort our understanding of overall welfare state effort. In contrast, the impact of taxation on cross-national patterns of social spending would appear to be rather more limited, since the correlation between gross and net public spending is extremely strong. As we shall point out subsequently, however, the redistributive effects of taxation are rather more pronounced than this correspondence of spending categories might seem to indicate.
3 Determinants of gross and net social expenditure
In this section, we examine whether or not the main schools of thought of comparative pub- lic policy research account for the cross-national variance of the measures of gross and net social expenditure reported in Table 1. These bodies of theory, the predictions they generate and the ways in which they are measured in this paper are summarised in Box 1. More elaborated discussions of these theoretical accounts can be found in Skocpol and Amenta (1986), Schmidt (1996), Castles (1998), Huber and Stephens (2001) and Myles and Quada- gno (2002). The hypothesis from which we initially proceed is that the impact of politics is likely to decline as the focus moves from gross to net social expenditure. The underlying rationale is that politics has a well-documented influence on the incidence of taxation that is likely to disappear if after-tax spending is analysed.
Box 1: Major schools of thought in comparative public policy analysis
Theory Indicator and predicted impact
Measurement Data Source
Socio-economic de- velopment
Functionalist variant: expen- diture positively influenced by economic affluence
Shorter-term, quasi-automatic variant: expenditure varies negatively with recent rate of economic growth
GDP per capita (1960-2001) in Geary- Khamis Dollars (average)
Economic growth (1981-2001)
Maddison (2003)
OECD Economic Outlook (various years)
Power resources theory
Partisan complexion of gov- ernment. Public expenditures vary negatively with bour- geois partisan control and positively with Left party strength. For private expendi- tures, the predictions are reversed.
Cabinet seats of bourgeois parties (1950-2000 [average]). Liberal, secular- conservative, ultra-Right, Christian De- mocratic and secular centre parties are classified as bourgeois parties. The partisan complexion of government for Spain refers to the post-democratization period.
Schmidt (2001)
Political institutional- ism
Constitutional rigidities. The higher the number of consti- tutional veto points, the lower the spending.
Index of federalism, bicameralism and constitutional rigidity
Lijphart (1999)
Theories of path de- pendence
Temporal consolidation of the welfare state. The earlier that programmes are established, the higher the level of spend- ing.
Average year when four social security programmes (occupational injuries, health insurance, pension and unem- ployment insurance) were adopted at the national level (or nation-wide).
Schmidt (2005:
182)
Since data on net social expenditure are available for 2001 only, we have to restrict our- selves to the analysis of the determinants of expenditure levels at that date. Given the “tyr- anny of past political commitments” typical for public spending (Tanzi/Schuknecht, 2000:
20), and paraphrasing the metaphor that Lipset and Rokkan used to describe party systems and voter alignments, we interpret present-day social spending levels as being substantially
the ‘frozen landscapes’ of political and economic circumstances in the past. More specifi- cally, we explain cross-national variation in spending levels in 2001 as a legacy of the de- velopment of the political economy over the course of the post-war era. Hence, with the exception of the economic growth variable, which averages data only for the two decades prior to the turn of the millennium, our other indicators are long-term averages or proxies for historical particularities [the adoption of programmes or constitutional structures] dating back to 1950 or earlier.
Although substantial improvements in country coverage have been achieved in the latest version of the net expenditure dataset, data are still missing for a number of the longer-term OECD member states for which we possess full information for our chosen independent variables. This means that we must exclude Switzerland, Greece and Portugal, along with a number of new member states [the Czech and Slovak Republics along with Korea and Mex- ico] for which the required independent variable data is not available. We also exclude Ice- land on grounds of small population size, leaving only the 18 countries featuring in Table 1 as the cases for the regression analysis that follows. In order to guarantee the comparability of the findings of that analysis, we use the same set of independent variables to model all four of the categories of social expenditure identified in Table 1, i.e. gross public social expenditure, net current public social expenditure, net current private social expenditure and net total social expenditure.
We report four models for each category of spending. A baseline model consists of three variables. They are the level of GDP per capita over the post-war period (1950-2001), the average rate of economic growth in the twenty years preceding the year in which expendi- ture levels are measured and the average degree of bourgeois party cabinet incumbency over the 1950-2000 period. The way in which the bourgeois incumbency variable is opera- tionalised here makes it virtually the mirror image of Left incumbency and we see no need to elaborate separate models to test the impact of the latter variable – all that is required is to reverse the signs. This baseline model is then augmented by variables chosen from the most influential bodies of theory described in Box 1. In particular, we examine impact of the timing of welfare state consolidation and the effect of political institutions on social expen- diture. The potential explanatory significance of these variables is emphasised by numerous scholars of social expenditure development (e.g. Schmidt 1996; Huber/Stephens: 2001;
Castles: 2004). Finally, we report best-fit models containing only statistically significant terms. Given the relatively small number of cases featuring in the analysis, we felt it inap- propriate to include more than four variables in any of our models. A correlation matrix for all the independent variables is to be found in the appendix and suggests a negligible risk of multicollinearity amongst the variables.
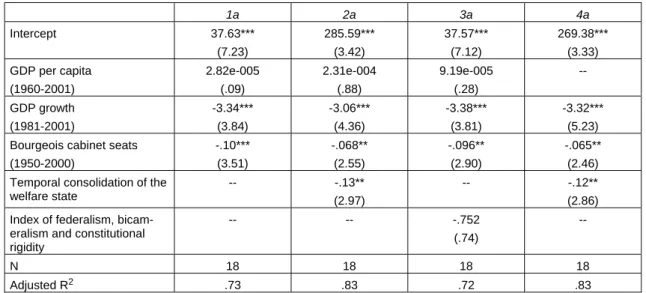
Our point of reference is the analysis of gross public social expenditure. Table 3 summa- rises our empirical findings. The estimated effects are compatible with the vast body of em- pirical research on the determinants of social expenditure in recent decades. All equations lend strong support to the ‘parties matter’ school of thought. The estimated coefficient for the bourgeois incumbency term is negative and highly significant, suggesting that social spending is strongly constrained under circumstances of prolonged bourgeois rule. Al-
though unreported here, findings for the impact of Left parties suggest that they have an equal and opposite positive effect on gross public expenditure levels. We also find evidence that the timing of welfare state consolidation is important for explaining gross spending.
This variable serves as a proxy for the degree of maturation of social programmes, with a link between maturity and higher levels of spending arguably compatible with both func- tionalist and ‘politics matters’ accounts (see Wilensky 1975; Schmidt 2005). The negative sign of the reported coefficient in Table 3 strongly supports the hypothesis, indicating that levels of contemporary spending are significantly lower in countries that adopted their pro- grammes most recently. The one political variable not to feature as a significant predictor of expenditure outcomes is the number of constitutional veto points, although the coefficient for this variable is consistently negative as suggested by the literature.
The estimated impacts of the two variables measuring socio-economic development are also largely in accordance with the conclusions of the recent literature on welfare state spending.
An earlier generation of functionalist accounts suggested that social expenditure was strongly positively linked to the level of economic development as measured by GDP per capita, but in most recent studies such a relationship is seen as having being superseded by political and institutional effects. The regressions reported here do not reveal any significant impact of the level of economic development,1 but do identify a strong negative relationship between social spending levels in 2001 and economic growth in the preceding two decades.
This relationship confirms the findings of numerous pooled time-series regressions of post- war spending as well as the most recent cross-sectional analysis of Castles (2006: 50-51) and can be attributed to several factors. First, economic growth clearly has an endogenous effect on social expenditure growth as the determinant of the denominator of the expendi- ture to GDP ratio. Rapid GDP growth necessarily leads, all other things being equal, to a decline in the spending ratio and low growth to an increase in measured spending.2 Al- though we are here discussing levels rather than the growth of expenditure, there is every reason to suppose that marked growth rate variation will impact on expenditure levels over periods as long as one or two decades. Second, economic growth also impacts on the nu- merator of the dependent variable, with low growth typically paralleled by mounting social demands, often with major consequences for growth in real spending. Finally, high eco- nomic growth rates provide an ideal environment for policy-makers seeking to restrain
1 This holds only for linear specifications of the model. Modeling a curvilinear (inverse u-shaped) effect of economic affluence on social spending yields significant results: GROSS PUBLIC EXPENDITURE 2001 = -40.47 + 9.08E-03 GDP (2.60) -3.21E-07 GDP SQUARED (2.56); R2 = .31. See Castles (2001) for an exposition of this argument.
2 Some economists might wish to object that the causal reasoning implied here is misspecified, with low growth rates seen as being determined by high public spending levels. We do not wish to go into this debate, which has its own huge literature (for a review, see Castles/Dowrick 1991), beyond pointing out that, for the period we are discussing and the same 18 countries featuring here, there is only a rela- tively weak association between gross spending in 1980 and subsequent 1981-2001 economic growth (r = -.43; sig. = .076), while there is a far greater and more significant one between growth over the same period and gross spending in 2001 (r = -.78; sig. = .000). This strongly suggests that economic growth shapes expenditure levels much more than the other way around.
spending as a percentage of GDP. The Irish economic miracle of the 1990s is a case in point; so too was the Japanese economic miracle of the early post-war decades. Both dem- onstrate that high and sustained levels of economic growth permit finance ministers to pull off the ultimate conjuring trick of cutting the expenditure/GDP ratio whilst presiding over long-term increases in real expenditure.
Table 3: Determinants of gross public social expenditure 2001
1a 2a 3a 4a
Intercept 37.63***
(7.23)
285.59***
(3.42)
37.57***
(7.12)
269.38***
(3.33) GDP per capita
(1960-2001)
2.82e-005 (.09)
2.31e-004 (.88)
9.19e-005 (.28)
-- GDP growth
(1981-2001)
-3.34***
(3.84)
-3.06***
(4.36)
-3.38***
(3.81)
-3.32***
(5.23) Bourgeois cabinet seats
(1950-2000)
-.10***
(3.51)
-.068**
(2.55)
-.096**
(2.90)
-.065**
(2.46) Temporal consolidation of the
welfare state
-- -.13**
(2.97)
-- -.12**
(2.86) Index of federalism, bicam-
eralism and constitutional rigidity
-- -- -.752
(.74)
--
N 18 18 18 18
Adjusted R2 .73 .83 .72 .83
Notes: Unstandardized regression coefficients; t-statistics in parentheses. * p≤ .10; ** p≤ .05; *** p≤ .01.
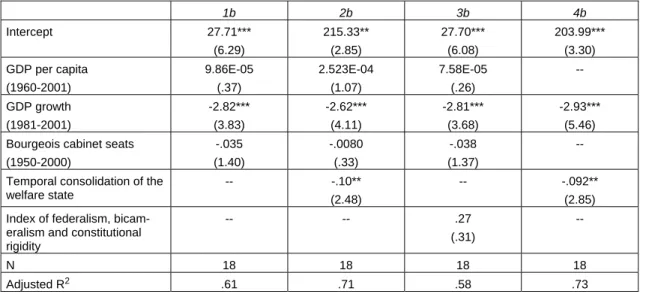
Having replicated the conventional wisdom of a literature hitherto based exclusively on gross spending data, we now seek to take into account the impact of the tax system on cross-country spending levels by analysing the determinants of net public social expendi- ture. The results are presented in Table 4. With one hugely significant exception, the find- ings resemble those of Table 3 in that economic growth and temporal consolidation retain their significant negative coefficients and levels of economic development and veto points [now actually marginally positively related to spending] remain insignificant. That there should be resemblances between the models comes as no real surprise, given the high corre- lation between gross and net public spending (see Table 2). The one really big difference between the models, however, is the absence of any partisan effects on after-tax public so- cial expenditure. Even though the coefficient for bourgeois incumbency shows the expected negative sign, the story of the models in Table 4 is that, for net public spending, politics no longer matters.
An obvious conclusion to be drawn from the contrasting political effects in Tables 3 and 4 is that the impact of politics on gross spending is largely a function of the tax effects now netted out of the equation. Because that is so, we devote the final section of this paper to exploring the mechanism underlying these politically driven tax effects in somewhat great detail. The best-fit model for net current public expenditure (4b) cannot properly be de- scribed as being either particularly political or functionalist in character. Almost three-
quarters of the variance can be accounted for by our modelling, but in terms predominantly of the effects of recent economic growth and of the past dependent impact of the consolida- tion of long-established social expenditure programmes.
Table 4: Determinants of net current public social expenditure
1b 2b 3b 4b
Intercept 27.71***
(6.29)
215.33**
(2.85)
27.70***
(6.08)
203.99***
(3.30) GDP per capita
(1960-2001)
9.86E-05 (.37)
2.523E-04 (1.07)
7.58E-05 (.26)
-- GDP growth
(1981-2001)
-2.82***
(3.83)
-2.62***
(4.11)
-2.81***
(3.68)
-2.93***
(5.46) Bourgeois cabinet seats
(1950-2000)
-.035 (1.40)
-.0080 (.33)
-.038 (1.37)
-- Temporal consolidation of the
welfare state
-- -.10**
(2.48)
-- -.092**
(2.85) Index of federalism, bicam-
eralism and constitutional rigidity
-- -- .27 (.31)
--
N 18 18 18 18
Adjusted R2 .61 .71 .58 .73
Notes: Unstandardized regression coefficients; t-statistics in parentheses. * p≤ .10; ** p≤ .05; *** p≤ .01.
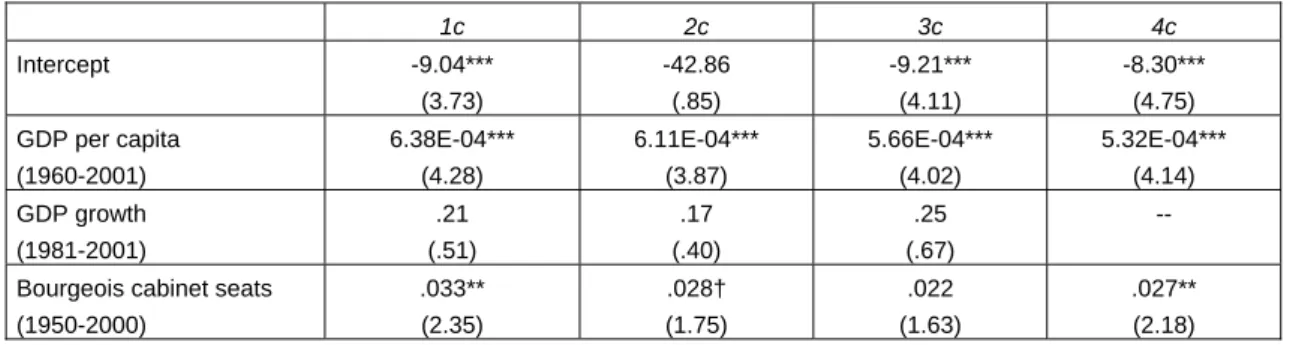
The picture changes even more dramatically when we turn to the driving factors of net cur- rent private social expenditure (see Table 5), with all the causal mechanisms adduced to account for public expenditure reversed in their effects. Instead of economic growth being the crucial economic development variable, it is the level GDP per capita averaged over the past five decades that turns out to be the most powerful predictor of the present-day volume of private spending. The countries that have been relatively affluent during the post-war decades have outspent the countries that have been relatively less affluent. Since public and private social expenditure are substitutes, the strong reliance of rich countries on private social spending helps explain the curvilinear effect demonstrated in footnote 1 above. Pos- sible explanations for the positive relationship between economic wealth and private social expenditure are that higher economic resources sustained over long periods produce a sur- plus that can be used to finance private benefits or, what may be another way of saying the same thing, that affluence produces and sustains a stronger middle class favouring non- statist forms of provision. In either case, this suggests that public welfare is an ‘inferior good’ in the technical sense of a good with the property that, as income rises, the demand for the inferior good falls. More interestingly perhaps, in terms of the historical evolution of comparative analysis of the welfare state, it suggests that the functionalist account of social spending, which sought to explain gross spending levels in the 1960s and 1970s in terms of differential levels of economic development, turns out to provide at least a partial explanation of private spending levels at the turn of the millennium.
Table 5 demonstrates other important reversals. One concerns the timing of welfare state consolidation, with welfare state laggards showing higher levels of private social expendi- ture than countries launching their public programmes earlier. Similar logics to those noted above may also account for this effect, with early and prolonged affluence, arguably, being a source of the early establishment of voluntary and private forms of provision discouraging the early adoption of public programmes (see Castles 1998). A competing (or perhaps even complementary) explanation might be that welfare state laggards are typically countries characterized by numerous institutional veto points (r = .39). Since the impact of constitu- tional rigidities on private spending is positive and significant at the 10 per cent level (equa- tion 3c), it may be argued that multiple veto points tend to encourage the development of private social expenditure. As we have argued elsewhere (Obinger et al 2005), this appears to have been a consequence of the employment of ‘political bypass strategies’ designed to overcome the political stalemate caused by constitutional rigidities. We may recall that a basic axiom of veto player theory is that, the higher the numbers of veto players, the more likely is political deadlock (Tsebelis 2002). Whenever an attempt to legislate public pro- grammes fails to overcome the institutional obstacles in its path, there remains room for private solutions and/or forms of benefit provision in which the state promotes privately organised programmes through tax allowances and incentives. Hence, there are excellent reasons for assuming that constitutional rigidities have preconfigured the public-private mix in benefit provision by redirecting pressures for programme adoption away from statist channels and into private ones.
Last, but, very much, not least, parties matter, but not in the manner generally featuring in comparative public policy analysis, with the Left favouring greater welfare state spending and their bourgeois opponents seeking to constrain such expenditure profligacy. In the realm of private social spending, it is in the countries in which bourgeois parties have been strongest that expenditures have been highest and although, once again not reported sepa- rately, it is in the countries in which the Left has been strongest, that spending has been least. Quite in contrast to net public spending, where neither ‘politics matters’ nor function- alist accounts demonstrated much purchase on the realities of cross-national expenditure variance, both politics and economic development matter a great deal in explaining private expenditure, with our best-fit model (4c) combining a functionalist account with two politi- cal variables to account for around 70 per cent of the variance.
Table 5: Determinants of net current private social expenditure
1c 2c 3c 4c
Intercept -9.04***
(3.73)
-42.86 (.85)
-9.21***
(4.11)
-8.30***
(4.75) GDP per capita
(1960-2001)
6.38E-04***
(4.28)
6.11E-04***
(3.87)
5.66E-04***
(4.02)
5.32E-04***
(4.14) GDP growth
(1981-2001)
.21 (.51)
.17 (.40)
.25 (.67)
-- Bourgeois cabinet seats
(1950-2000)
.033**
(2.35)
.028†
(1.75)
.022 (1.63)
.027**
(2.18)
Temporal consolidation of the welfare state
-- .018 (.67)
-- -- Index of federalism, bicam-
eralism and constitutional rigidity
-- .85*
(1.97)
.83*
(1.97)
N 18 18 18 18
Adjusted R2 .64 .63 .70 .71
Notes: Unstandardized regression coefficients; t-statistics in parentheses. * p≤ .10; ** p≤ .05; *** p≤ .01.
† = level of significance is .104
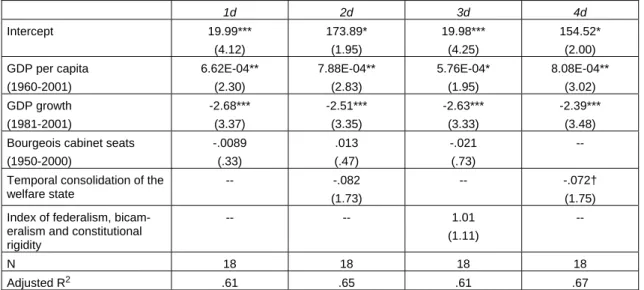
Adding up net public and net private social expenditure and subtracting the extent of tax breaks for social purposes towards current private social benefits provides a measure map- ping the scope of net total social expenditure. The four models featuring in Table 6 identify the factors driving expenditure in OECD countries devoted to levels of welfare provision as a whole.
Our earlier analysis of gross expenditure suggested that parties mattered a great deal, with bourgeois dominance explaining lower spending and Left incumbency higher spending.
Our just completed analysis of private expenditures has shown that parties have apparently been no less influential, although the direction of their impact is here reversed, with spend- ing higher under bourgeois auspices. The question, then, is whether we can discern partisan effects when we come to analyse net total social expenditure in Table 6. The answer is that the joint effect of summing these categories of expenditure and netting out taxation effects on both leaves us with an account of overall social expenditure effort that is predominantly economic in character. The level of economic development over the past 50 years is posi- tively related to net total social expenditure, while the impact of GDP growth is strongly negative. Countries that have been rich over the past five decades spend more on welfare, while countries that have been growing richer faster over the last two decades spend less.
The only non-economic influence on total spending is the marginally significant impact of welfare consolidation, with countries getting into the public welfare state business early continuing to spend somewhat more than those getting into it later.
Table 6: Determinants of net total social expenditure 2001
1d 2d 3d 4d
Intercept 19.99***
(4.12)
173.89*
(1.95)
19.98***
(4.25)
154.52*
(2.00) GDP per capita
(1960-2001)
6.62E-04**
(2.30)
7.88E-04**
(2.83)
5.76E-04*
(1.95)
8.08E-04**
(3.02) GDP growth
(1981-2001)
-2.68***
(3.37)
-2.51***
(3.35)
-2.63***
(3.33)
-2.39***
(3.48) Bourgeois cabinet seats
(1950-2000)
-.0089 (.33)
.013 (.47)
-.021 (.73)
-- Temporal consolidation of the
welfare state
-- -.082 (1.73)
-- -.072†
(1.75) Index of federalism, bicam-
eralism and constitutional rigidity
-- -- 1.01
(1.11)
--
N 18 18 18 18
Adjusted R2 .61 .65 .61 .67
Notes: Unstandardized regression coefficients; t-statistics in parentheses. * p≤ .10; ** p≤ .05; *** p≤ .01.
† = level of significance is .1027
As noted previously in discussing the findings reported in Table 5, what is most interesting in terms of the historical development of the scholarly literature in this area is the way the models reported here restore the once influential functionalist interpretation of expenditure development (see Wagner 1911; Polanyi 1978 [1944]; Wilensky 1975) to centre stage.
Wilensky, the most influential sociological proponent of this view, would easily have rec- ognized an account of total welfare state spending premised on the role of economic devel- opment and programme consolidation, since it was essentially his own, although in his case derived from a consideration exclusively of gross public expenditure levels, whereas the models here are for total [public + private] welfare effort. Almost certainly the reason that the determinants of total spending in 2001 resemble those of gross spending in the mid- 1960s [the data point for Wilensky’s research] is that his research largely predates the sub- stantial change in expenditure relativities shaped by partisan forces in the 1960s and 1970s.
4 Politics and Redistribution
If, then, as Adema and Ladaique (2005) tell us, total net expenditure is what really matters in assessing the extent of national welfare effort, must we agree with Wilensky’s mid-1970s conclusion that partisan politics adds absolutely nothing to the explanation of social spend- ing? In our view, the answer is a decisive no. Throughout the course of our analysis, we have presented clear evidence that political parties and, to a lesser extent, political institu- tions play an important role in shaping the public-private mix of benefit provision, deter- mining where both gross public and net private spending are greatest and least. While eco-
nomic factors may explain how much societies ultimately spend on social provision, politics remains the key to who gets what, when and with what effect in the welfare arena. In this final substantive section of our paper, we seek to demonstrate that an analysis, which fails to acknowledge the explanatory power partisan politics, is unable to obtain any serious in- tellectual purchase on the issue which, for the majority of commentators, frames their un- derstanding of the moral purpose and, hence, the theoretical substance, of the welfare state:
i.e. the fact that different kinds of welfare states produce quite different outcomes in terms of poverty and inequality.
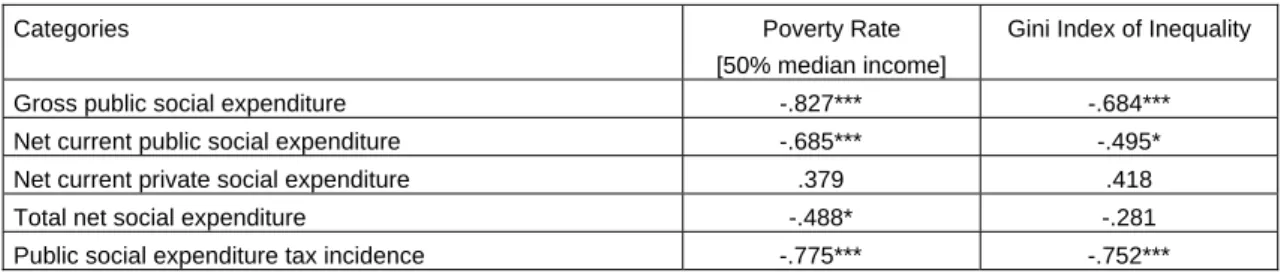
The first step in that demonstration is to show that the different categories of spending fea- turing in Table 1 are, indeed, associated with different outcomes. This task is undertaken in Table 7, which reports the association between these different categories of spending and the latest figures for the percentage of the population living below a poverty line of 50 per cent of median income and for the Gini index of income inequality as reported on the Lux- embourg Income Study [LIS] website (see http://www.lisproject.org). Unfortunately, the LIS database does not report figures for poverty or inequality for either Japan or New Zea- land, so the correlations in Table 7 are based on only 16 of the 18 cases featuring in our earlier analysis. Since the latest LIS figures on occasions predate our 2001 expenditure measures, the findings reported here would have to be considered tentative were they not so overwhelmingly strong.
Table 7: Correlations between expenditure categories and redistributional outcomes
Categories Poverty Rate
[50% median income]
Gini Index of Inequality Gross public social expenditure -.827*** -.684***
Net current public social expenditure -.685*** -.495*
Net current private social expenditure .379 .418
Total net social expenditure -.488* -.281
Public social expenditure tax incidence -.775*** -.752***
Note: Pearson correlation coefficient. * p≤ .10; ** p≤ .05; *** p≤ .01.
In addition to examining the relationship between the expenditure categories in Table 1 and redistributional outcomes, Table 7 also seeks to assess the redistributional impact of another measure that can be derived from the Adema and Ladaique study: the difference between gross and net public spending on welfare (i.e. expenditure categories 1 and 2 in Table 1), which is equivalent to the incidence of taxes on gross public social expenditure. This measure, which is not separately identified or named in the Adema and Ladaique study, we call the public social expenditure tax incidence. Potentially indicative of strong political antecedents, average family of nations values for this variable are 5.85 per cent of GDP in Scandinavia, 3.82 per cent in continental Western Europe and just 1.16 in the English- speaking family of nations.
What Table 7 clearly shows is that gross expenditure is a far better predictor of redistribu- tive outcomes than any of the Adema and Ladaique measures of net expenditure. Just as most studies in the field have assumed, gross spending is a hugely successful predictor of poverty levels and a moderately good predictor of economic inequality. Of the net meas- ures, the only relationship meeting conventional standards of statistical significance is that between net current public social expenditure and the poverty rate. Moreover, the inclusion of private spending weakens the relationships further because net current spending is actu- ally positively related to poverty and inequality, the latter relationship only just missing out on being significant at the 10 per cent level. The best that can be said in redistributive terms for the total net social expenditure measure, which Adema and Ladaique propose as the best proxy for society’s total welfare effort, is that it weakly predicts poverty but has no dis- cernible impact on income inequality. Thus, the gross expenditure measure, which the es- tablished literature properly argues is substantially shaped by the positive influence of Left partisanship and the negative influence of its bourgeois opponents, is a strong predictor of favourable redistributive outcomes, while the measures better accounted for in functionalist or economic terms turn out to negligibly or even positively associated with poverty and inequality.
We have included the additional measure of public social expenditure tax incidence in our Table 7 analysis because it is this item which by definition makes the difference between gross and net public expenditure and which, therefore, must be, in large part, responsible for gross expenditure’s superior redistributive performance. The final row of figures in Table 7 confirms that this is so, with tax incidence, by itself, almost as good a predictor of poverty outcomes as is gross expenditure and actually a rather stronger predictor of inequality than gross spending or indeed any other measure featuring in Table 7. So the important story here is that what really matters about welfare state redistribution is a function of the inci- dence of taxation, with the simple syllogism: the greater the taxation of gross spending, the greater the welfare.
This may appear counter-intuitive if one thinks of the impact of taxation only in terms of a reduction in recipients’ prior levels of wellbeing, but less so if one thinks in terms of a modified Robin Hood analogy. Robin Hood apocryphally stole from the rich and gave to the poor. Taxing those welfare recipients with higher benefits and greater affluence is the stealing from the rich part, with the greater subtleties of the modern fiscal system allowing the proceeds to be used not for the kind of crude wealth transfer that occurred in Sherwood Forest, but rather to finance more generous benefits and higher levels of gross spending. In other words, it is because the countries of Scandinavia and, to a lesser extent, continental Western Europe tax a lot that they can afford to spend a lot on the higher benefits required to alleviate poverty and, in turn, it is because the middle classes and the most affluent in these countries end up paying more in taxation than elsewhere that inequality is lower.3
3 The argument here does not deny that the incidence of taxes within a given country is at best likely to be proportional and may even, in over some ranges of the income distribution, be regressive [social secu- rity taxes often have contribution ceilings and it is well known that the effective indirect tax rates paid
Economists are wont to decry the combination of high benefits and high taxation, suggest- ing that this phenomenon, which they call “churning”, leads to a serious misallocation of economic resources and hence to a reduction in economic performance. Our analysis, how- ever, suggests that the combination of high levels of taxing and spending cannot simply be rejected on grounds of economic inefficiency, but rather represents a policy strategy delib- erately chosen on partisan grounds to enhance welfare redistribution (for a confirmatory theoretical analysis, see Åberg 1989; c.f. Korpi/Palme 1998; Rothstein 2001).
Figure 1: Public social expenditure taxation incidence in 2001 and bourgeois cabinet seats 1950-2000
Bourgeois cabinet seats 1950-2000
110 100 90 80 70 60 50 40 30 20 10 0
Public social expenditure taxation incidence 2001
8
6
4
2
0
-2
USA UK
SWE
SPA NOR
NZ NL
JAP I
IRL FRA
FIN DK
CAN B
A
AUS
Rsqd = .667
That it is partisan politics which sets this redistributive mechanism in motion can simply be inferred from the fact evident already early on in our analysis that gross expenditure is strongly negatively associated with bourgeois incumbency and net public expenditure is not. Given this, it seems unnecessary to provide a further complete set of regressions re- porting findings the import of which is already understood, and we content ourselves here with a footnote reporting a best-fit equation showing that the only significant predictors of public social expenditure tax incidence are bourgeois incumbency and, interestingly, al- though only significant at the 10 per cent level, the negative impact of multiple constitu-
by the rich are often less than those paid by the poor], but rather rests on the fact that, in comparison with other countries, the middle classes and the affluent in these nations pay back in taxes a greater proportion of what they receive in benefits [typically, in the English-speaking countries, no income taxes are levied on flat-rate minimum or means-tested benefits and social security contributions and in- direct taxes were introduced later and are levied at lower rates than in Scandinavia and the countries of continental Western Europe].
tional veto points.4 The obvious conclusion is that the Robin Hood effect – or, with the more positive valuation that the authors of this paper prefer, the welfare conferring effect – of the taxation of social expenditure is, to all intents and purposes, an exclusively political effect. How dramatic that effect is, and how little room there is for alternative explanations, is made evident by the scatterplot with which we conclude our substantive analysis (figure 1). This demonstrates both the strength and extraordinarily linear character of the relation- ship between bourgeois incumbency and the tax incidence variable, a relationship as strong as any ever reported in the ‘politics matters’ literature.
5 An Afterword
It is not our intention to repeat here conclusions that have already been amply stated and restated throughout the course of this paper. The only point we seek to clarify in this final paragraph is our take on the original net expenditure research by Adema and Ladaique, which provides both the data and the rationale for this analysis. We have built our account of the factors shaping social expenditure around a critique of Adema and Ladaique’s im- plied view that we should be more interested in net than in gross measures of spending. We reject that view because, as we have shown, it is gross spending – and the tax incidence that shapes it – that is central to the redistributive purposes of the welfare state. But to make it very clear, there is nothing else that we criticize or reject in this research. On the contrary, it is only because Adema and Ladaique’s meticulous empirical enquiry allows us to distin- guish between these multiple categories of social expenditure in so many different countries that makes it possible to locate the differential determinants of different categories of social spending and to identify the mechanisms linking party ideologies – and, to a lesser extent, political institutions – to redistributive outcomes.
4 The model is as follows: PUBLIC SOCIAL EXPENDITURE TAX INCIDENCE = 8.93 - .066 BOURGEOIS CABINET SEATS (4.72) -.890 INDEX OF FEDERALISM, BICAMERALISM AND CONSTITUTIONAL RIGIDITY (1.95). Adjusted R2 = .70.
Appendix
Correlation matrix for the independent variables
Adoption of social
programmes
Bourgeois cabinet seats
GDP per capita
Institutional veto points Bourgeois cabinet
seats
.553
GDP per capita .282 .168
Institutional veto points .390 .427 .342
GDP growth .227 .373 -.299 .017
References
Åberg, Rune, 1989: „Distributive Mechanisms of the Welfare State – A Formal Analysis and an Empirical Application“, European Sociological Review 5: 167-82.
Adema, Willem; Ladaique, Maxime, 2005: „Net Social Expenditure, 2005 Edition. More Comprehensive Measures of Social Support“, OECD Social, Employment and Migration Working Papers No. 29. Paris.
Castles, Francis G., 1993: „Is Expenditure Enough? On the Nature of the Dependent Vari- able in Comparative Public Policy Analysis“, Journal of Commonwealth & Comparative Politics 32: 349-363.
Castles, Francis G., 1998: Comparative Public Policy. Patterns of Post-war Transforma- tion. Cheltenham: Edward Elgar.
Castles, Francis G., 2001: „The Dog that Didn’t Bark: Economic Development and the Postwar Welfare State“, in: Stephan Leibfried (Hg.), Welfare State Futures. Cambridge:
Cambridge University Press, 37-56.
Castles, Francis G., 2004: The Future of the Welfare State. Oxford: Oxford University Press.
Castles, Francis G., 2006: „The Growth of the Post-war Public Expenditure State: Long- Term Trajectories and Recent Trends“, TranState Working Paper No 35, Bremen Uni- versity.
Castles, Francis G., 1990: „The Impact of Government Spending Levels on Medium-term Economic Growth in the OECD, 1960-85“, Journal of Theoretical Politics 2: 173-204.
Esping-Andersen, Gösta, 1990: The Three Worlds of Welfare Capitalism. Cambridge: Pol- ity.
Huber, Evelyne; Stephens, John D., 2001: Development and Crisis of the Welfare State.
Chicago: University of Chicago Press.
Korpi, Walter; Palme, Joachim, 1998: „The Paradox of Redistribution and Strategies of Equality: Welfare State Institutions, Inequality, and Poverty in the Western Countries“, American Sociological Review 63: 661-687.
Lijphart, Arend, 1999: Patterns of Democracy. New Haven: Yale University Press.
Lipset, Seymour Martin; Rokkan, Stein, 1967: „Cleavage structures, party systems and voter alignments“, in: Seymour Martin Lipset; Stein Rokkan (Hg.), Party Systems and Voter Alignments. New York: Free Press, 1-64.
Myles, John; Quadagno, Jill, 2002: „Political Theories of the Welfare State“, Social Service Review 76: 34-57.
Obinger, Herbert; Leibfried, Stephan; Castles, Francis G., (Hg.): 2005: Federalism and the Welfare State. New World and European Experiences. Cambridge: Cambridge Univer- sity Press.
OECD, 2001: Historical Statistics 1970-2000. Paris.
OECD, 2004: Social Expenditure Data Base. Paris.
OECD, various dates: Economic Outlook. Paris.
Polanyi, Karl, 1978 [1944]: The Great Transformation. Frankfurt a.M.: Suhrkamp.
Rothstein, Bo, 2001: „The Universal Welfare State as a Social Dilemma“, Rationality and Society 13: 213-233.
Schmidt, Manfred G., 1996: „When Parties Matter. A Review of the Possibilities and Lim- its of Partisan Influence on Public Policy“, European Journal of Political Research 30:
155-183.
Schmidt, Manfred G., 2001: Die parteipolitische Zusammensetzung von Regierungen, un- published dataset. Department of Political Science, University of Heidelberg.
Schmidt, Manfred G., 2005: Sozialpolitik in Deutschland. Historische Entwicklung und internationaler Vergleich. Wiesbaden: Verlag für Sozialwissenschaften.
Skocpol, Theda; Amenta, Edwin, 1986: „States and Social Policy“, Annual Review of Soci- ology 12: 131-157.
Tanzi, Vito; Schuknecht, Ludger, 2000: Public Spending in the 20th Century. Cambridge:
Cambridge University Press.
Tsebelis, George, 2002: Veto Players. How Political Institutions Work. Princeton: Princeton University Press.
Wagner, Adolph, 1911: „Staat (in nationalökonomischer Sicht)“, in: J. Conrad; L. Elster;
W. Lexis; E. Loening (Hg.), Handwörterbuch der Staatswissenschaften, Band 7. Jena, 727-739.
Wilensky, Harold, 1975: The Welfare State and Equality. Berkeley: University of California Press.