Diet and stable isotope analyses reveal the feeding ecology of the orangeback squid Sthenoteuthis pteropus (Steenstrup 1855) (Mollusca, Ommastrephidae) in the eastern tropical Atlantic
Ve´ronique Merten1*, Bernd Christiansen2, Jamileh Javidpour1, Uwe Piatkowski1, Oscar Puebla1,3, Rebeca Gasca4, Henk-Jan T. Hoving1
1 GEOMAR Helmholtz Centre for Ocean Research Kiel, Kiel, Germany, 2 Universita¨t Hamburg, Institute for Hydrobiology and Fishery Sciences, Hamburg, Germany, 3 Christian-Albrechts-Universita¨t zu Kiel, Kiel, Germany, 4 El Colegio de la Frontera Sur, Chetumal, Mexico
*vmerten@geomar.de
Abstract
In the eastern tropical Atlantic, the orangeback flying squid Sthenoteuthis pteropus
(Steenstrup 1855) (Cephalopoda, Ommastrephidae) is a dominant species of the epipelagic nekton community. This carnivore squid has a short lifespan and is one of the fastest-grow- ing squids. In this study, we characterise the role of S. pteropus in the pelagic food web of the eastern tropical Atlantic by investigating its diet and the dynamics of its feeding habits throughout its ontogeny and migration. During three expeditions in the eastern tropical Atlantic in 2015, 129 specimens were caught by hand jigging. Stomach content analyses (via visual identification and DNA barcoding) were combined with stable isotope data (@15N and@13C) of muscle tissue to describe diet, feeding habits and trophic ecology of S. ptero- pus. Additionally, stable isotope analyses of incremental samples along the squid’s gladius
—the chitinous spiniform structure supporting the muscles and organs—were carried out to explore possible diet shifts through ontogeny and migration. Our results show that S. ptero- pus preys mainly on myctophid fishes (e.g. Myctophum asperum, Myctophum nitidulum, Vinciguerria spp.), but also on other teleost species, cephalopods (e.g. Enoploteuthidae, Bolitinidae, Ommastrephidae), crustaceans and possibly on gelatinous zooplankton as well.
The squid shows a highly opportunistic feeding behaviour that includes cannibalism. Our study indicates that the trophic position of S. pteropus may increase by approximately one trophic level from a mantle length of 15 cm to 47 cm. The reconstructed isotope-based feed- ing chronologies of the gladii revealed high intra- and inter-individual variability in the squid’s trophic position and foraging area. These findings are not revealed by diet or muscle tissue stable isotope analysis. This suggests a variable and complex life history involving individual variation and migration. The role of S. pteropus in transferring energy and nutrients from lower to higher trophic levels may be underestimated and important for understanding how a changing ocean impacts food webs in the eastern Atlantic.
a1111111111 a1111111111 a1111111111 a1111111111 a1111111111
OPEN ACCESS
Citation: Merten V, Christiansen B, Javidpour J, Piatkowski U, Puebla O, Gasca R, et al. (2017) Diet and stable isotope analyses reveal the feeding ecology of the orangeback squid Sthenoteuthis pteropus (Steenstrup 1855) (Mollusca, Ommastrephidae) in the eastern tropical Atlantic.
PLoS ONE 12(12): e0189691.https://doi.org/
10.1371/journal.pone.0189691
Editor: Erik V. Thuesen, Evergreen State College, UNITED STATES
Received: April 15, 2017 Accepted: November 30, 2017 Published: December 15, 2017
Copyright:©2017 Merten et al. This is an open access article distributed under the terms of the Creative Commons Attribution License, which permits unrestricted use, distribution, and reproduction in any medium, provided the original author and source are credited.
Data Availability Statement: All data is available from the PANGAEA database (https://doi.pangaea.
de/10.1594/PANGAEA.874974).
Funding: Henk-Jan T. Hoving and Uwe Piatkowski obtained the funding for this study from the DFG- supported Cluster of Excellence 80 “The Future Ocean” (grant CP1218),http://www.futureocean.
org/en/index.php. Shiptime and associated
Introduction
Oceanic squids are muscular, fast moving opportunistic molluscan predators that feed on a variety of prey [1–3] to sustain high metabolic and growth rates [1,4–6]. Squids generally have a short lifespan of about 1–2 years and are semelparous; there is one reproductive cycle after which the individual dies [4]. They play a key role in the trophic structure of marine pelagic ecosystems [7,8] due to their large and in some areas increasing biomass [9] and their impor- tance in the diet of marine predators such as fishes and marine mammals [10,11]. There is growing evidence that cephalopod populations may benefit from changing ocean environ- ments and overexploitation of finfish species [9,12,13]. The capacity of oceanic squids (e.g.
Humboldt squid) to take over niches of overexploited fish stocks and to flexibly adjust their distribution, life history and physiology may make them potential winners in a future ocean [14–16]. The impacts of squid population expansions on marine food webs are challenging to predict; thus, their ecological role needs to be better understood. In the eastern tropical Atlan- tic, the orangeback flying squidSthenoteuthis pteropus(Ommastrephidae) is one of the domi- nant members of the epipelagic nekton community [17]. It is among the fastest growing squids and undertakes diel vertical migrations [18]. The species feeds in surface waters at night and migrates to deeper layers (down to 1200 m) during the day [19]. Information on their feeding ecology, including ontogenetic changes in diet and cannibalistic behaviours are limited [5,17–19]. The prey spectrum ofS.pteropusswitches during their ontogeny from crustaceans in early juveniles (3–9 cm mantle length (ML)) to micronektonic fishes in late juveniles and middle-sized individuals (9–35 cm ML) and finally to nektonic fishes and squids in adult large-sized squid (35–65 cm ML) [17,18]. This pattern is consistent with feeding in other ommastrephid squids [20–23]. Furthermore,S.pteropusis an important prey for top predators such as swordfish, marine mammals and sharks [17]. This influence ofS.pteropuson high and low trophic levels in the ecosystem and its high abundance and reproduction rate suggests that they have a relevant role in the pelagic food web [17]. Stomach content analysis of hard parts that are resistant to digestion (e.g. squid beaks, fish otoliths and crustacean exoskeletons) allowed prey identification at different taxonomic levels [24]. Yet a limitation of the visual inspection of squid stomach contents is that prey items are often macerated beyond recogni- tion or eroded due to digestion [1,25]. DNA sequencing of stomach contents can provide addi- tional insights in prey species composition [26,27]. Since squids are known to reject hard parts, such as fish heads, stomach content analysis alone may bias when investigating prey spe- cies composition and prey size [1]. Additionally, the stomach contents represent only the last feeding event and do therefore not provide sufficient information about the squid’s average trophic position. The analysis of stable isotope (@15N,@13C) ratios from body tissues has been used for studying the trophic role of squids and can provide time-integrated information about the trophic position of the recently assimilated (<2 months) diet [28]. Tissue of con- sumers is enriched in15N relative to their food, and therefore@15N values are indicators of a consumer’s trophic position [29]. In the marine environment, there is little variation in stable isotope ratios of carbon along the food chain, but carbon reflects spatial variations of the envi- ronment and can indicate inshore versus offshore, pelagic versus benthic feeding or latitudinal variations in foraging habitat [29]. Therefore,@13C may provide information about the ani- mal’s foraging area, habitat and migration patterns. In order to obtain high resolution data on feeding ecology and individual migration behaviour, we analyzed stable isotope ratios of the cephalopod gladius. This archival hard structure, which consists of chitin and proteins, is pres- ent in the hatchlings and grows continuously with no metabolic turnover after synthesis.
Using a combination of visual and molecular stomach content and stable isotope analysis we investigated the diet and the position ofS.pteropusin the pelagic food web of the eastern
financial support were provided by the DFG (grant MSM49 to Bernd Christiansen).
Competing interests: The authors have declared that no competing interests exist.
tropical Atlantic and discussed size-based changes, individual variability of feeding habits, for- aging habitats and migration.
Materials and methods
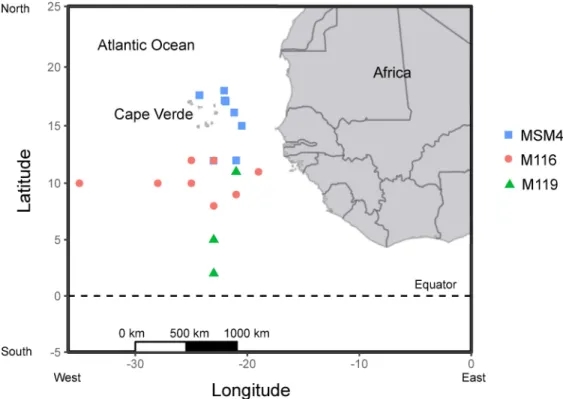
Permission for sampling invertebrates in Cape Verdean waters was not required. A bilateral agreement between the Republic of Cape Verde and the Federal Republic of Germany grants German research vessels to conduct scientific research in Cape Verdean waters. The field stud- ies did not involve sampling in protected areas or of endangered or protected species. Orange- back flying squid (n = 129) were caught in surface waters at night by hand jigging (jig size between 5–10 cm) with a light source for attraction. They were captured in the Cape Verde area of the eastern tropical Atlantic between 17˚N– 2˚N and 26˚W– 21˚W in May–June 2015 from the R/V Meteor (cruise M116), in September–October 2015 from the R/V Meteor (cruise M119) and in November–December 2015 from the R/V Maria S. Merian (cruise MSM49) (Fig 1). The squid were killed immediately after capture by decapitation [30]. Dorsal mantle length (ML) of all specimens were measured to the nearest millimeter and body mass was measured by a kitchen scale at calm sea or in the lab after defrosting. Sex and maturity stage were determined following Lipiński & Underhill [31]. A qualitative, visual stomach fullness index (SFI) was assigned: 0 = empty; 1 = traces of food; 2 = less than half full; 3 = more than half full; 4 = full;
5 = crammed with walls distended [32]. The stomachs of all individuals were stored in 70% eth- anol or frozen (-40˚C); samples of mantle muscle tissue and gladii from individuals of the cruise MSM49 were stored in -80˚C and -40˚C, respectively, for later stable isotope analysis.
Stomach content analysis
Stomachs were defrosted, opened and contents screened through a 300μm mesh sieve in order to sort prey items. A binocular stereomicroscope was used to identify prey items to the
Fig 1. Capture locations of all Sthenoteuthis pteropus samples in the tropical eastern Atlantic in 2015 from three research cruises (MSM49, M116, M119).
lowest possible taxon. Fish sagittal otoliths were identified following specialized regional litera- ture [10,33–37]. Cephalopod beaks were identified according to Clarke [38], the Tree of Life Web Project [39] and a reference collection obtained during cruise WH383 around Cape Verde. Crustaceans were identified by their exoskeletons [40] and with the aid of the keys and illustrations posted at the Marine Species Identification Portal [41]. Frequency of occurrence and number were used to quantify occurrence of prey taxa in the stomachs [2,42]. The number of individual fishes or cephalopods that were found in one stomach were estimated by the maximum number of right or left otoliths and of upper or lower beaks. Frequency of occur- rence (FO%) was calculated as the percentage ofS.pteropusthat fed on a certain prey and the relative number (N%) is the number of individuals of a certain prey, relative to the total num- ber of individual prey.
Stable isotope analysis
Stable isotope analysis was conducted only on the squid specimens caught in December 2015 (MSM49). Gladii were taken from the five largest individuals (five females>40.0 cm ML, one male of 20 cm ML); muscle tissue was taken from 54 specimens (18.4–47.5 cm ML,
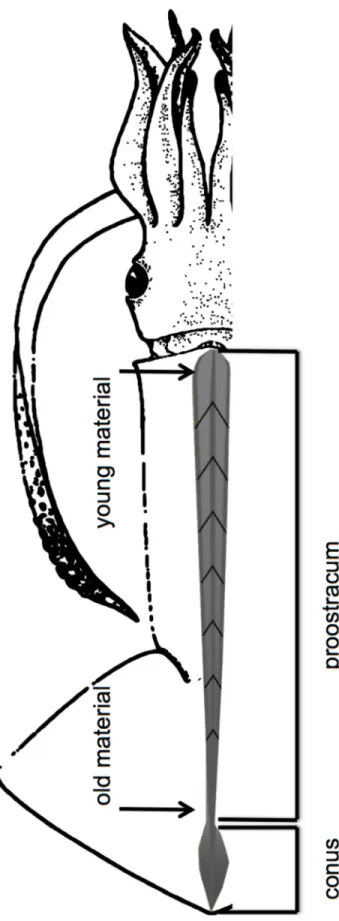
females = 44; males = 10). Only the proostracum (including rachis and vanes) was used for sta- ble isotope analysis (Fig 2), because its growth increments are clearly distinguishable and rep- resent the entire lifespan of the squid [43–45]. Samples taken from the anterior part of the proostracum represent the most recently deposited organic material, while samples taken at the distal end correspond to the juvenile life phase.
Gladii were cleaned with distilled water, dried with KimWipes (Kimberly-Clark), measured to the nearest millimeter and the proostracum was cut in 10–20 mm increments following the V shape of the growth lines (Fig 2). The gladius samples (nsubsamples= 135) were freeze-dried for 24h and ground into a fine powder with mortar and pestle. The samples were freeze-dried again for 4h and weighed with a microbalance and 80–120μg of the powder were transferred into tin containers for isotopic analysis. To estimate the current trophic position of the squid in the food web, stable isotopes (@13C;@15N) were analyzed in muscle mantle tissue of 54 spec- imens including those that were used for gladii analysis. Muscle tissue samples were treated as the gladii. They were also freeze-dried for 24h and ground to a fine powder. However, lipids from muscle tissue samples were extracted using chloroform and the remaining tissue was dried over night at 50˚C. Lipids were not extracted from the gladii samples because chitinous structures like beaks and gladii do not contain significant amounts of lipids that could bias13C values [24]. The suggestion of Post et al. [47] was followed to conduct lipid corrections on
@13C values if C/N ratios are higher than 3.5. This was the case for gladii@13C values. This method led to a small increase (1‰ in average) in@13C, but with a similar pattern over time (S1 Fig). Isotope ratios of C and N were measured using an elemental analyzer system (NA 1110, Thermo, Milan, Italy) connected to a temperature-controlled gas chromatography oven (SRI 9300, SRI Instruments, Torrance, CA, USA), which contained a column for permanent gases. Separated sample gases and the reference gases N2and CO2were transferred via a Con- FloIII interface (Thermo Fisher Scientific, Bremen, Germany) to the isotope ratio mass spec- trometer (DeltaPlusAdvantage, Thermo Fisher Scientific). Measured isotope ratios are given as
@values in per mil deviation (‰) from the standard reference material Vienna PeeDee Belem- nite (VPDB) and atmospheric nitrogen following the equation@X = [(RSample/RStandard)-1]
x1000 where X refers to13C or15N and R represents the ratio of the heavy isotope to the light isotope (13C/12C or15N/14N). Laboratory gas cylinders of CO2and N2were used as working standards and calibrated against primary solid standards (IAEA-N1, -N2, -N3, USGS24, NBS22). The lab standard acetanilide used to estimate C and N content for each sample series
Fig 2. Gladius of a squid separated into a conus and proostracum (including rachis and vanes) section. (after Roper et al. [46] and Lorrain et al. [45]).
https://doi.org/10.1371/journal.pone.0189691.g002
was measured every seventh sample with a standard deviation of +/-0.16‰ for@15N and +/-0.39‰ for@13C.
DNA barcoding
To complement visual stomach content analysis, a total of 27 unidentifiable tissue prey items from 23Sthenoteuthis pteropusindividuals (19.5–47.5 cm ML) and five crustaceans from the stomachs of 5 individuals were sequenced at mitochondrial cytochrome c oxidase subunit 1 (mCOI). The barcoded prey items represent a subset of all unidentifiable prey items of the stomachs. This approach provided expanded data of the squid’s prey spectrum and a way to detect cannibalism, because squids tend to tear their prey apart beyond recognition and spit out hard parts such as beaks which are difficult to swallow. Prey items were preserved in 70%
ethanol after screening the stomach contents ofS.pteropus. DNA was extracted with QIAGEN DNeasy Blood & Tissue columns following the manufacturer’s protocol. The COI barcode was amplified by a polymerase chain reaction (PCR) in 10μL reactions containing 3μL DNA, 1μL primer LCO1490 (F) and HCO21988 (R) for invertebrate samples [48] as well as VF2_t1 (F) and FR1d_t1 (R) for fishes [49] at 10μM concentration each, 0.1μL Promega taq DNA Poly- merase at 5U/μL concentration, 1μL 10x PCR buffer, 1μL dNTPs at 2mM concentration each and 4.9μL sigma water. The PCR thermal cycle consisted of one initial denaturation step of 6 min at 96˚C, 30 cycles of 20 s at 94˚C, 30 s at 55˚C and 40 s at 72˚C, and one final extension step of 20 min at 72˚C. PCR products were purified with ExoSAP-IT (Affymetrix USB) using 2μl of cleanup reagent, incubated for 15 min at 37˚C and inactivated for 15 min at 80˚C.
Sequencing reactions were performed in 10μl volume containing 2μl of purified PCR product, 1μl primer at 10μM concentration, 1μl BigDye Terminator v3.1 (Applied Biosystems), 3μl BigDye buffer and 3μl sigma water. The PCR thermal cycle consisted of one initial denatur- ation step of 1 min at 96˚C followed by 30 cycles of 10 s at 96˚C, 5 s at 50˚C and 4 min at 60˚C.
Sequencing reactions were run on an ABI PRISM 3130xl automated genetic analyzer (Applied Biosystems). Sequence trace files were exported into Codon Code Alligner (Codon Code Cor- poration) and the forward and reverse sequences were trimmed and assembled. Assembled contigs were examined and edited by hand. Consensus sequences were compared to public databases using the Basic Local Allignment Search Tool (BLAST) on the NCBI server (http://
www.ncbi.nlm.nih.gov/blast)) and to reference cephalopod material obtained during the WH383 research cruise that took place in the same area.
Data analysis
Data exploration to test for significant relationships and collinearity of explanatory variables of all regression analyses were conducted following the methods of Zuur et al. [50]. Regression analysis was used to determine whether stable isotope signatures of the muscle tissue changed with size. The largest individual (C) was treated as an outlier and excluded from the analysis, because it showed low@15N values throughout its entire life cycle, differing strikingly from the other individuals. A generalized additive model (GAM, R packages: nlme and mgcv [51,52]) was used to evaluate the relationship between@15N gladii stable isotope values as a function of gladii length. Since@15N gladii stable isotope values were not normally distributed, box-cox power transformation (lambda = 1.8) was applied to the data using the MASS package in R [53].@13C data of gladii were corrected based on Post et al. [47]. Due to high level of residuals’
heterogeneity a generalized least squares (GLS) model with a fixed variance structure (Var- Fixed) was applied to test the@13C as a function of gladii length. To investigate the diet in rela- tion to size, collected squid were divided into four size classes according to their mantle length.
Squid ranging between 13.0 and 20.4 cm ML were defined as small, 20.5–30.4 cm as medium,
30.5–40.4 cm as large and 40.5–50.4 cm as very large. All statistics were performed with the freeware R (Version 3.3.2).
Results
Population structure
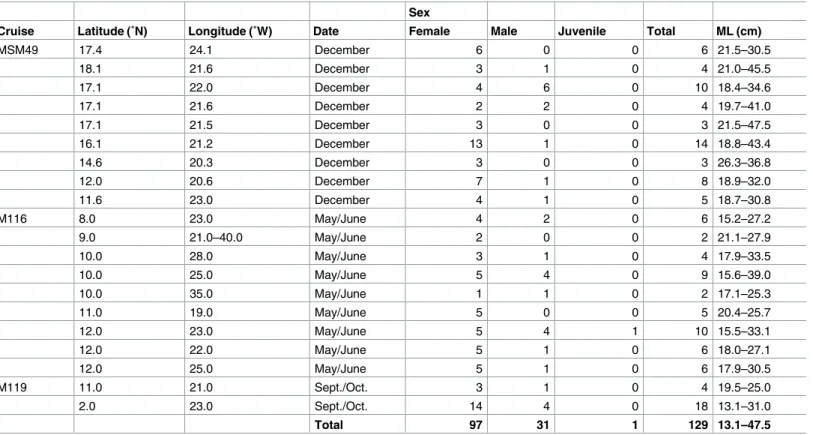
During the three research cruises a total of 129 specimens were captured with ML ranging between 13.1 and 47.5 cm; including 97 females (75%), 31 males (24%) and one unsexed indi- vidual (1%) (Table 1). Female mantle lengths ranged from 20.2 to 32.4 cm and body mass (BM) from 55 to 1,449 g and the male ML ranged from 17.5 to 21.7 cm and the BM from 151 to 327 g. Most females were immature (77%), followed by 13% mature and 6% maturing indi- viduals. Male squid were mostly mature (75%), followed by 16% maturing and 9% immature individuals. The sample sizes were 22, 50 and 57 for cruises M119, M116 and MSM49, respectively.
General diet analysis
Few stomachs were crammed with food (3%). Most stomachs were either full (29%), half full (27%) or less than half full (23%). Traces of food were observed in 10% of all squid stomachs and 8% were empty (S2 Fig). Stomach contents showed three main groups of prey: fishes, cephalopods and crustaceans (Table 2). A total of 336 fish otoliths and 52 cephalopod beaks were found. Over 80% of cephalopod and crustacean occurrences were single and no more than three individuals per stomach occurred. 50% of fish occurrences were single or double
Table 1. Population structure of Sthenoteuthis pteropus (n = 129) in the eastern tropical Atlantic in 2015 caught during three research cruises (lati- tude and longitude are rounded).
Sex
Cruise Latitude (˚N) Longitude (˚W) Date Female Male Juvenile Total ML (cm)
MSM49 17.4 24.1 December 6 0 0 6 21.5–30.5
18.1 21.6 December 3 1 0 4 21.0–45.5
17.1 22.0 December 4 6 0 10 18.4–34.6
17.1 21.6 December 2 2 0 4 19.7–41.0
17.1 21.5 December 3 0 0 3 21.5–47.5
16.1 21.2 December 13 1 0 14 18.8–43.4
14.6 20.3 December 3 0 0 3 26.3–36.8
12.0 20.6 December 7 1 0 8 18.9–32.0
11.6 23.0 December 4 1 0 5 18.7–30.8
M116 8.0 23.0 May/June 4 2 0 6 15.2–27.2
9.0 21.0–40.0 May/June 2 0 0 2 21.1–27.9
10.0 28.0 May/June 3 1 0 4 17.9–33.5
10.0 25.0 May/June 5 4 0 9 15.6–39.0
10.0 35.0 May/June 1 1 0 2 17.1–25.3
11.0 19.0 May/June 5 0 0 5 20.4–25.7
12.0 23.0 May/June 5 4 1 10 15.5–33.1
12.0 22.0 May/June 5 1 0 6 18.0–27.1
12.0 25.0 May/June 5 1 0 6 17.9–30.5
M119 11.0 21.0 Sept./Oct. 3 1 0 4 19.5–25.0
2.0 23.0 Sept./Oct. 14 4 0 18 13.1–31.0
Total 97 31 1 129 13.1–47.5
https://doi.org/10.1371/journal.pone.0189691.t001
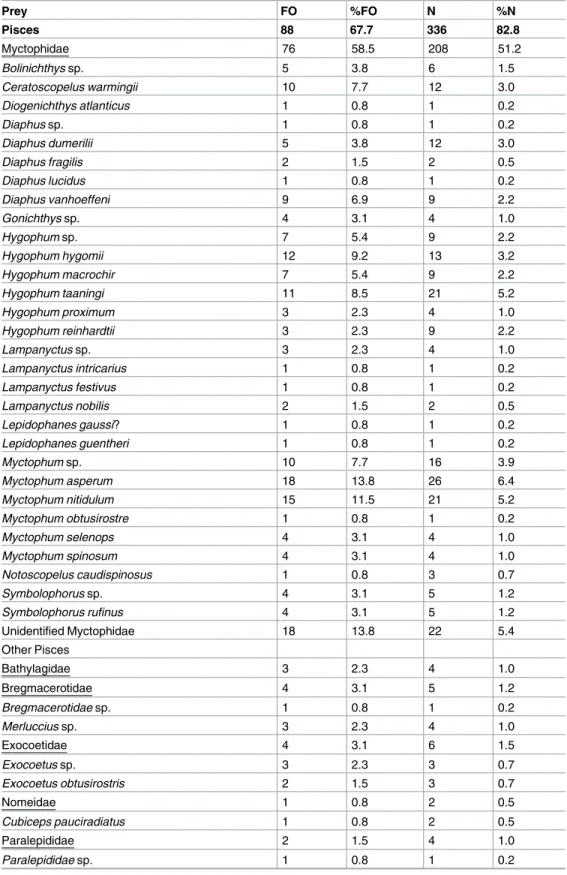
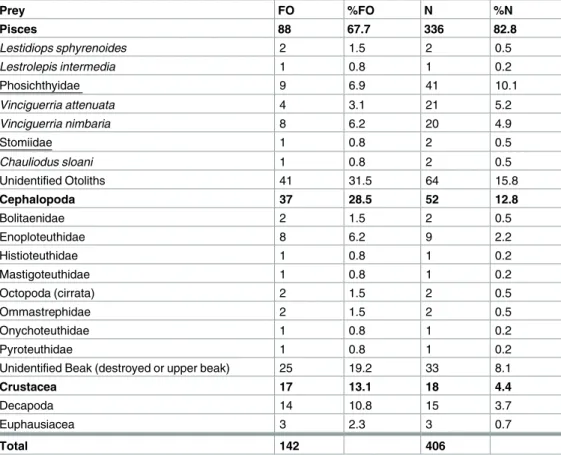
Table 2. Summary of prey composition found in the stomach contents of Sthenoteuthis pteropus from the eastern tropical Atlantic in 2015 by frequency of occurrence (FO), frequency of occurrence in percent (%FO), number (N) and number in percent (%N).
Prey FO %FO N %N
Pisces 88 67.7 336 82.8
Myctophidae 76 58.5 208 51.2
Bolinichthys sp. 5 3.8 6 1.5
Ceratoscopelus warmingii 10 7.7 12 3.0
Diogenichthys atlanticus 1 0.8 1 0.2
Diaphus sp. 1 0.8 1 0.2
Diaphus dumerilii 5 3.8 12 3.0
Diaphus fragilis 2 1.5 2 0.5
Diaphus lucidus 1 0.8 1 0.2
Diaphus vanhoeffeni 9 6.9 9 2.2
Gonichthys sp. 4 3.1 4 1.0
Hygophum sp. 7 5.4 9 2.2
Hygophum hygomii 12 9.2 13 3.2
Hygophum macrochir 7 5.4 9 2.2
Hygophum taaningi 11 8.5 21 5.2
Hygophum proximum 3 2.3 4 1.0
Hygophum reinhardtii 3 2.3 9 2.2
Lampanyctus sp. 3 2.3 4 1.0
Lampanyctus intricarius 1 0.8 1 0.2
Lampanyctus festivus 1 0.8 1 0.2
Lampanyctus nobilis 2 1.5 2 0.5
Lepidophanes gaussi? 1 0.8 1 0.2
Lepidophanes guentheri 1 0.8 1 0.2
Myctophum sp. 10 7.7 16 3.9
Myctophum asperum 18 13.8 26 6.4
Myctophum nitidulum 15 11.5 21 5.2
Myctophum obtusirostre 1 0.8 1 0.2
Myctophum selenops 4 3.1 4 1.0
Myctophum spinosum 4 3.1 4 1.0
Notoscopelus caudispinosus 1 0.8 3 0.7
Symbolophorus sp. 4 3.1 5 1.2
Symbolophorus rufinus 4 3.1 5 1.2
Unidentified Myctophidae 18 13.8 22 5.4
Other Pisces
Bathylagidae 3 2.3 4 1.0
Bregmacerotidae 4 3.1 5 1.2
Bregmacerotidae sp. 1 0.8 1 0.2
Merluccius sp. 3 2.3 4 1.0
Exocoetidae 4 3.1 6 1.5
Exocoetus sp. 3 2.3 3 0.7
Exocoetus obtusirostris 2 1.5 3 0.7
Nomeidae 1 0.8 2 0.5
Cubiceps pauciradiatus 1 0.8 2 0.5
Paralepididae 2 1.5 4 1.0
Paralepididae sp. 1 0.8 1 0.2
(Continued )
and more than five individuals per stomach were rare. A stomach contained on average 3 prey species±1.9 with 9 prey species being the maximum found in one stomach.
About 68% of the stomachs examined contained fish, accounting for 83% by prey number.
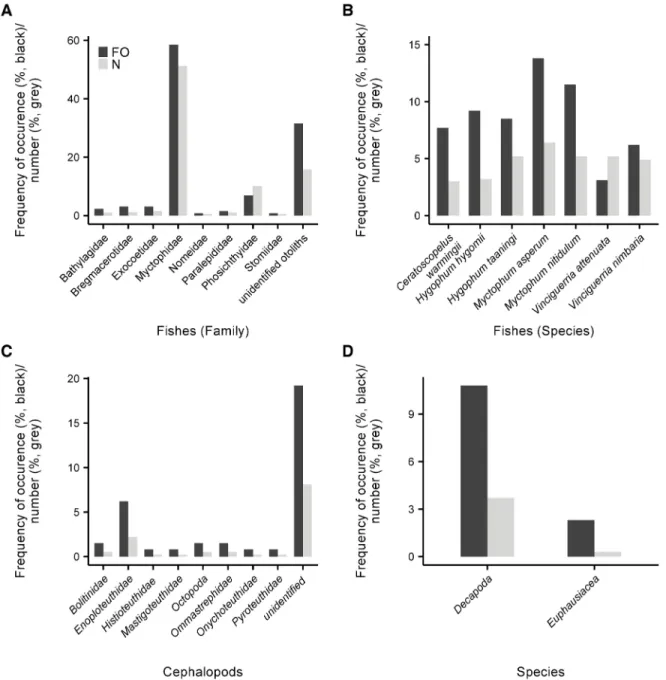
The most abundant prey family in terms of both occurrence and numbers were Myctophidae (58.5% FO and 51.2% N) (Fig 3A) and this was independent of the squid size (Fig 4). Seven of the eight largest individuals (>35 cm, included in the size classes large and very large) had only myctophids in their stomachs and one stomach contained flying fish (Exocoetidae).
Because the sample size for the largest size group is low (n = 4), the diet results of very large sized squid have to be interpreted with caution. While 30 different myctophid species were identified in total,Myctophum asperumandMyctophum nitidulummost frequently occurred in the stomachs (13.8% FO and 11.5% FO, respectively) (Fig 3B). Fish otoliths that could not be identified accounted for 15.8% N, thus representing an occurrence of 31.5% FO. Fishes of the genusVinciguerria(Phosichthyidae) occurred in 6.9% of all stomachs and accounted for 10.1% of all fish prey. They were usually not abundant in the diet of small and middle-sized squid, occurring in only 6–15% of stomachs and not consumed by large-sized squid (Fig 4).
However, in 9 stomachs, they were present in high numbers (n = 41). Other fish families found as squid prey were Bathylagidae, Bregmacerotidae, Paralepididae, Stomiidae and Nomeidae (Fig 3A). The maximum number of individual fishes counted in one stomach was 22 and these were the speciesV.attenuataandV.nimbaria(in a female squid, ML 23.5 cm).
Cephalopods were the second most important prey group ofS.pteropus, occurring in 29%
of all stomachs and accounting for 13% of all prey by number (Table 2). Since the beaks were mainly very small and eroded by digestion, they could only be identified to family level. In
Table 2. (Continued)
Prey FO %FO N %N
Pisces 88 67.7 336 82.8
Lestidiops sphyrenoides 2 1.5 2 0.5
Lestrolepis intermedia 1 0.8 1 0.2
Phosichthyidae 9 6.9 41 10.1
Vinciguerria attenuata 4 3.1 21 5.2
Vinciguerria nimbaria 8 6.2 20 4.9
Stomiidae 1 0.8 2 0.5
Chauliodus sloani 1 0.8 2 0.5
Unidentified Otoliths 41 31.5 64 15.8
Cephalopoda 37 28.5 52 12.8
Bolitaenidae 2 1.5 2 0.5
Enoploteuthidae 8 6.2 9 2.2
Histioteuthidae 1 0.8 1 0.2
Mastigoteuthidae 1 0.8 1 0.2
Octopoda (cirrata) 2 1.5 2 0.5
Ommastrephidae 2 1.5 2 0.5
Onychoteuthidae 1 0.8 1 0.2
Pyroteuthidae 1 0.8 1 0.2
Unidentified Beak (destroyed or upper beak) 25 19.2 33 8.1
Crustacea 17 13.1 18 4.4
Decapoda 14 10.8 15 3.7
Euphausiacea 3 2.3 3 0.7
Total 142 406
https://doi.org/10.1371/journal.pone.0189691.t002
contrast to fish otoliths, squid beaks consumed byS.pteropuswere not dominated by a single taxonomic group. Cephalopod prey were moderately abundant (24–35%) in the stomachs ofS.
pteropussmaller than 40 cm (n = 125) and absent in very large-sized squid (n = 4) (Fig 4).
Approximately 2% of the lower beaks were identified as Enoploteuthidae and were present in 6% of all stomachs. Cirrate octopods made up 0.5% of all crustacean prey and occurred in 1.5% of all stomachs. Besides that, cephalopods from the Bolitinidae, Ommastrephidae, Pyro- teuthidae, Mastigoteuthidae, Histioteuthidae and Onychoteuthidae family were present in the stomachs with abundances and occurrences below 2% for each family (Fig 3C). Beaks that could not be identified accounted for the largest grouping and were present in 19% of all
Fig 3. Frequency of occurrence (FO, black bars) and relative number (N, grey bars) in percent of the stomach contents of Sthenoteuthis pteropus (n = 129) caught in the eastern tropical Atlantic in 2015. (A) Fish families (B) Fish species (only a subset of the most abundant species is shown) (C) Cephalopod families (D) Crustaceans.
https://doi.org/10.1371/journal.pone.0189691.g003
stomachs and made up 8% of all prey. 13% of all stomachs contained crustaceans, mainly deca- pods (11%) and euphausiids (2%) (Fig 3D). Decapods could not be identified to species level due to the advanced stage of digestion. Crustaceans had the lowest frequency of occurrence (11–21%) in small- to middle-sized squid and 50% in very large-sized squid
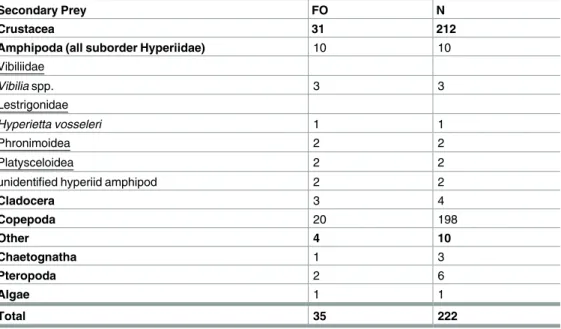
(Fig 4). Crustaceans were not found in stomachs of large-sized squid (n = 20). Of all exam- ined stomachs, 20 included copepods with a total of 198 copepods overall. A total of ten amphipod individuals were found in eight stomachs (Table 3). There was no evidence of recently ingested large prey that could have introduced copepods and amphipods as secondary or transitory prey in the stomachs ofS.pteropus. The copepods and amphipods occurred almost exclusively in squid caught during May and June (M116). The mantle length of squid containing more than one intact copepod specimen ranged from 15 to 25 cm. The maximum number of copepods found in one individual was 83 (female, ML = 25 cm). All amphipods belong to the suborder Hyperiidea (n = 10). Three specimens were identified asVibiliaspp.
(Vibiliidae), one asHyperietta vosseleri(Lestrigonidae), two as members of the Phronimoidea and two as Platysceloidea.
DNA barcoding
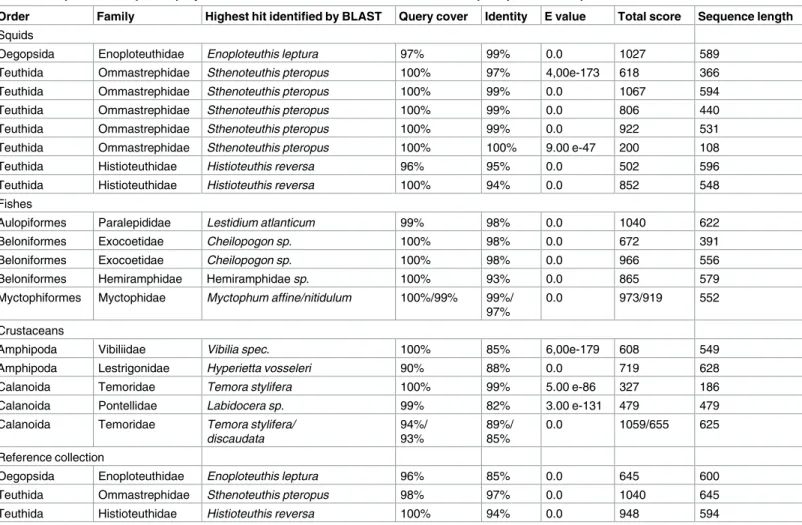
The BLAST analyses provided generally low E values, high query covers and high percent iden- tities (Table 4). Ingested cephalopod prey includedSthenoteuthis pteropus(Ommastrephidae;
n = 5),Enoploteuthis leptura(Enoploteuthidae; n = 1) andHistioteuthis reversa(Histioteuthi- dae; n = 2); fish prey includedLestidium atlanticum(Paralepididae; n = 1),Cheilopogonsp.
(Exocoetidae; n = 2), Hemiramphidae (n = 1) andMyctophum affine/nitidulum(Myctophidae;
n = 1). Crustacean prey included the hyperiid amphipodsVibiliasp. (Vibiliidae) andHyper- ietta vosseleri(Lestrigonidae). Additionally, copepods of the genusTemorasp. (Temoridae)
Fig 4. Frequency of occurrence of the prey groups of 129 specimens of Sthenoteuthis pteropus for 10 cm size intervals. Sample size per size interval: small (11–20 cm) = 33; middle (21–30 cm) = 72; large (31–
40 cm) = 20; very large (41–50 cm) = 4.
https://doi.org/10.1371/journal.pone.0189691.g004
andLabidocerasp. (Pontellidae) were identified. Samples that could not be assigned with high confidence to a species were excluded from the analysis. Cannibalistic specimens ranged between 19.0 and 30.5 cm ML.
Stable isotope analysis
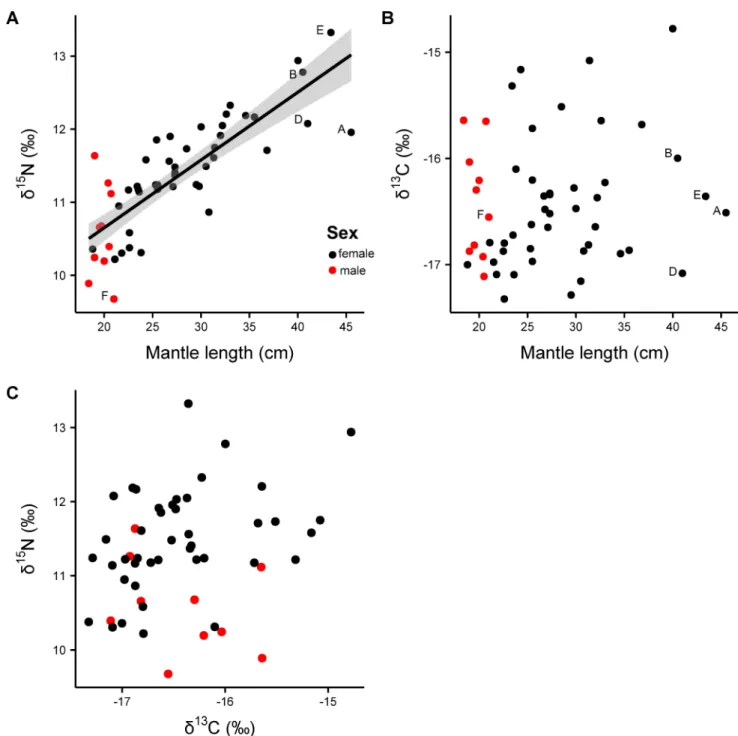
Stable isotope analysis of muscle tissue. Muscle@13C isotope values ranged from -17.3 to -14.8‰ (difference: 2.5‰) and@15N ranged from 9.7 to 13.3‰ (3.6‰) (Fig 5,Table 5). The difference of 3.6‰ in@15N in muscle tissue equals an increase by one trophic level [54]. A significant effect of size (ML) was found for muscle@15N isotope values (y = 8.796 + 0.093x, r = 0.67, F1, 51= 102.1, p<0.001) showing an increase by 2.5 ‰ in@15N with increasing ML (Fig 5A). No significant relationships were found between@13C muscle isotope values and sex, maturity stage and location (@13C: p = 0.50, r2= 0.18, F10,43= 0.95) and no relationship between@13C and mantle length could be observed (p = 0.39, r2= 0.01, F1, 52= 0.74). For@15N and sex, maturity stage and location a marginally significant relationship was found (@15N:
p = 0.07, r2= 0.31, F10,43= 1.92) attributed to the fact that male individuals ofS.pteropusdo not grow as large as females and therefore occupy lower size classes with lower@15N values (Fig 5A).
Stable isotope analysis of squid gladii. Ranges of@15N and@13C gladii stable isotopes were 5.3–9.2‰ (range: 3.9‰) and -17.8–15.4‰ (range: 2.4‰), respectively (Table 5). Single specimens showed different regimes of@15N and@13C (Fig 6). However, grouping of the gladii stable isotope data showed a significant increase in@15N and@13C with increasing gladius length (Fig 6C and 6D, GAM@15
N, edf = 2.4, F = 2.8, p<0.05, r2= 0.14; GLS@13
C, t = 3.9, p<0.01). The largest squid analyzed (Individual C) showed a total increase in@15N of 3.3‰
from the earliest gladii section to the most recent (5.3‰@15N at 16 cm GL to 8.6‰@15N at 36 cm GL), accompanied by an increase of 1‰ in@13C (-17.0‰@13C at 16 cm GL to -16.0‰@13C at 36 cm GL). Individual A showed fluctuating isotopic values with decreasing and increasing
@15N and@13C. Opposite to individual A, individual D did not show high fluctuations in@15N
Table 3. Summary of secondary prey found in the stomach contents of Sthenoteuthis pteropus from the eastern tropical Atlantic in 2015 by frequency of occurrence (FO) and number (N). Secondary prey refers to prey that has been introduced in the stomachs by other prey species.
Secondary Prey FO N
Crustacea 31 212
Amphipoda (all suborder Hyperiidae) 10 10
Vibiliidae
Vibilia spp. 3 3
Lestrigonidae
Hyperietta vosseleri 1 1
Phronimoidea 2 2
Platysceloidea 2 2
unidentified hyperiid amphipod 2 2
Cladocera 3 4
Copepoda 20 198
Other 4 10
Chaetognatha 1 3
Pteropoda 2 6
Algae 1 1
Total 35 222
https://doi.org/10.1371/journal.pone.0189691.t003
(range between 7.4 and 8.3 ‰); instead a steady increase of@13C from -16.9 ‰ to -16‰ was observed. The@15N and@13C values of all individuals revealed that the trophic position and for- aging habitat varied at short time intervals over their entire life span. However, all large individ- uals showed the same pattern of@15N and@13C which slowly increased after reaching a GL of approximately 20–25 cm. The isotopic values of the male individual (individual F) were in the range of females and also showed high variability. No relationship was found between stable iso- tope values in gladii and muscle tissue and the location of capture.
Discussion
The present study on the feeding ecology ofSthenoteuthis pteropusrevealed three major find- ings. 1) Stomach content data obtained during 2015 showed that juvenile and adultS.pteropus mainly prey on myctophids, but that they also show an opportunistic and variable feeding behavior. No ontogenetic size related diet shift in prey composition was detected; this was probably because of the small sample size of large squid. 2) The muscle tissue stable isotope analysis showed an overall increase in@15N corresponding with the growth of the squid (assuming a constant isotopic baseline). The@13C isotopic values did not show any trend with increasing ML and therefore indicated no consistent change in migration behaviour with growth, thus suggesting that individuals have different foraging areas.
Table 4. Sequenced samples of prey items collected in the stomachs of Sthenoteuthis pteropus in the tropical eastern Atlantic in 2015.
Order Family Highest hit identified by BLAST Query cover Identity E value Total score Sequence length Squids
Oegopsida Enoploteuthidae Enoploteuthis leptura 97% 99% 0.0 1027 589
Teuthida Ommastrephidae Sthenoteuthis pteropus 100% 97% 4,00e-173 618 366
Teuthida Ommastrephidae Sthenoteuthis pteropus 100% 99% 0.0 1067 594
Teuthida Ommastrephidae Sthenoteuthis pteropus 100% 99% 0.0 806 440
Teuthida Ommastrephidae Sthenoteuthis pteropus 100% 99% 0.0 922 531
Teuthida Ommastrephidae Sthenoteuthis pteropus 100% 100% 9.00 e-47 200 108
Teuthida Histioteuthidae Histioteuthis reversa 96% 95% 0.0 502 596
Teuthida Histioteuthidae Histioteuthis reversa 100% 94% 0.0 852 548
Fishes
Aulopiformes Paralepididae Lestidium atlanticum 99% 98% 0.0 1040 622
Beloniformes Exocoetidae Cheilopogon sp. 100% 98% 0.0 672 391
Beloniformes Exocoetidae Cheilopogon sp. 100% 98% 0.0 966 556
Beloniformes Hemiramphidae Hemiramphidae sp. 100% 93% 0.0 865 579
Myctophiformes Myctophidae Myctophum affine/nitidulum 100%/99% 99%/
97%
0.0 973/919 552
Crustaceans
Amphipoda Vibiliidae Vibilia spec. 100% 85% 6,00e-179 608 549
Amphipoda Lestrigonidae Hyperietta vosseleri 90% 88% 0.0 719 628
Calanoida Temoridae Temora stylifera 100% 99% 5.00 e-86 327 186
Calanoida Pontellidae Labidocera sp. 99% 82% 3.00 e-131 479 479
Calanoida Temoridae Temora stylifera/
discaudata
94%/
93%
89%/
85%
0.0 1059/655 625
Reference collection
Oegopsida Enoploteuthidae Enoploteuthis leptura 96% 85% 0.0 645 600
Teuthida Ommastrephidae Sthenoteuthis pteropus 98% 97% 0.0 1040 645
Teuthida Histioteuthidae Histioteuthis reversa 100% 94% 0.0 948 594
https://doi.org/10.1371/journal.pone.0189691.t004
3) The reconstruction of the feeding chronology of individual squid via incremental gladii stable isotope analysis did not reveal a continuous increase in trophic position during the squid’s entire life. However, a significant increase in@15N and@13C was observed when squid exceeded ca. 20 cm GL which corresponded to the isotope data from the muscle tissue. Fur- thermore, gladius analyses suggested substantial individual variations in trophic positions and foraging area.
Fig 5. Isotopic values of muscle tissue (n = 54) in relation to mantle length of Sthenoteuthis pteropus caught in the eastern tropical Atlantic in 2015. (A)@15N in ‰ of muscle tissue; the smoother curve (method = GAM) was adapted by the function y ~ s (x, k = 4); the shaded area is the 95% confidence interval for predictions; (B)@13C ‰ of muscle tissue; without regression line since this one was not significant; (C) Gender specific biplot of stable isotope values of muscle tissue (n = 54) of Sthenoteuthis pteropus caught in the eastern tropical Atlantic in 2015; The labeled data points (A–F) correspond to the individuals on which gladii stable isotope analysis was applied (seeTable 5).
https://doi.org/10.1371/journal.pone.0189691.g005
Stomach content analysis–visual and DNA analysis
The diet ofSthenoteuthis pteropusconsisted mainly of myctophid fishes, which is also the main prey item of many other ocean squids including gonatids [55] and ommastrephids [56,57]. A total of 30 different myctophid species were found in the stomachs ofS.pteropus, butMycto- phum asperumandM.nitidulumdominated. These species are among the most abundant myctophid fishes that undertake diel vertical migration in the tropical and sub-tropical Pacific [58] but little information is available on these species in the Atlantic [59].Myctophum asperumandM.nitidulumcan reach a maximal length of 8.5 cm and 8.3 cm, respectively and prey on small crustaceans such as copepods and amphipods [58,60]. Adults of both species feed mainly in the epipelagic zone at night within the upper 1 m layer and descend to deeper layers during the day; thus they represent a relevant role in the transfer of energy from sea
Table 5. Size, location of capture, isotope values and C/N mass ratios of the five large Sthenoteuthis pteropus females and the small male individ- ual caught during cruise MSM49 in 2015 in the eastern tropical Atlantic.
Mantle Gladius
@15N @13C C/N @15N @13C C/N
Individual Size [cm] Latitude (˚N) Longitude (˚W) mean max min mean max min mean max min
A 45.5 18.0835 22.0007 11.9 -16.5 3.7 7.0 8.0 6.2 -16.9 -15.7 -17.8 4.5 4.7 4.3
B 40.5 17.1622 21.9218 12.8 -16.0 3.4 7.6 8.0 7.3 -16.4 -16.1 -17.3 4.5 4.7 4.4
C 47.5 17.1622 21.9218 11.3 -16.9 3.7 6.5 8.6 5.3 -16.7 -16.0 -17.1 4.5 4.6 4.4
D 41.0 17.1853 21.9612 12.1 -17.1 3.8 7.8 8.3 7.4 -16.6 -16.0 -16.9 4.4 4.8 4.3
E 43.4 16.2032 21.3085 13.3 -16.4 3.6 8.3 9.2 7.5 -16.1 -15.4 -17.5 4.4 4.6 4.0
F 21.0 18.0835 22.0007 9.7 -16.6 3.5 6.5 7.6 5.9 -16.7 16.4 -17.2 4.6 4.6 4.5
https://doi.org/10.1371/journal.pone.0189691.t005
Fig 6. Stable isotope values along the gladius length. (A)@15N and (B)@13C stable isotope values of the five large female Sthenoteuthis pteropus (A–E) and the small male individual (F) caught in the eastern tropical Atlantic in 2015. (C) Grouped@15N values (D) Grouped@13C values. Lines represent significant relationships (@15N: p<0.05;@13C: p<0.01).
https://doi.org/10.1371/journal.pone.0189691.g006
surface layers to the deep. Late juveniles and adult squid rise to the epipelagic layer at night to forage (0–150 m) and descend down to 800–1200 m in the morning [17]. By doing soS.ptero- pusactively transports carbon from the upper ocean layers into deeper regions. Individual squid had up to nine species of myctophids in their stomachs, stressing the diverse prey spec- trum ofS.pteropus. Such diversity of prey species is known from other squid species [3] and could be explained by the migratory behavior ofS.pteropus. However, many different mycto- phid species are able to coexist due to resource-partitioning of vertical distribution and diet [61,62]. Therefore the diversity in prey species could also be due to co-existence of different myctophid species in the same habitat. The high number of prey taxa ofS.pteropusindicates that this squid is an opportunistic predator. Besides fishes,S.pteropusalso preyed upon cepha- lopods and crustaceans. A dietary shift during growth from crustacean-dominated prey to fish and cephalopod-dominated prey was not apparent from the stomach contents. This was prob- ably due to the small sample size of large squid (4 very large and 125 small to large individuals) and the squid’s opportunistic feeding behavior. The dominance of fishes and squids in the stomachs examined might be related to their local abundance and availability as potential prey items, but also thatS.pteropusselectively predate on these groups. When cephalopods and crustaceans were found in squid stomachs they mostly occurred as single individuals, whereas fish remains were found in higher numbers. This suggests that eitherS.pteropusfeeds on fish schools or that fish otoliths accumulate in the stomachs over several meals. The latter would result in a biased frequency of occurrence and number [56]. DNA barcoding revealed thatS.
pteropusfeeds on conspecifics. This finding was not observed in the visual investigation of the stomach contents because beaks were too small and eroded to be identified to species level.
Contamination is unlikely sinceS.pteropussequences were not systematically found in all samples, and were the only sequence that did amplify when found. Furthermore, only very clean sequences were analyzed and the dissection kit was cleaned after each sample. Cannibal- ism has been reported for several cephalopods [4,55]. Cannibalistic behaviour can provide a competitive advantage among juveniles and/or adults during episodes of food scarcity [63]
and can be a regulating factor to reduce intra-specific competition [64]. Cannibalism could also be artificially induced by jig fishing [55] as has been shown in Humboldt squid which occurs in high abundances in the Pacific Ocean [56]. During our fishing operations we only observed squid in very small schools and therefore the observed cannibalism is likely a natural component of the feeding behaviour ofS.pteropusas was suggested for gonatid squid [55].
Zooplankton as prey
High numbers of copepods and some hyperiid amphipods were found in some of the exam- ined squid stomachs. The crustaceans were intact, undigested and there were no fish or crusta- ceans present in the stomachs that could have introduced them to the squid’s stomachs as secondary or transitory prey. It is unlikely that the squid actively predates individually on these copepods and hyperiids. Some of the encountered amphipods and copepods are known to be symbionts or prey of gelatinous zooplankton [65–67]. Therefore, these crustaceans could have entered the stomachs ofS.pteropuswith the gelatinous fauna, suggesting that squid had been feeding on gelatinous zooplankton (e.g. salps, medusae, siphonophores, pyrosomes).
Ingested gelatinous zooplankton is subject to rapid digestion, a process that continues after capture even when specimens are being frozen [68]. In the eastern tropical AtlanticS.pteropus has been found to feed on pyrosomes where they were abundant [69]. Almost all amphipods found in the stomachs ofS.pteropusbelong to the suborder Hyperiidae. Members of the hyperiid genusVibiliasp. are well-known symbionts of salps [65,66]. One amphipod belong- ing to the superfamily Phronimoidea also associates with salps, ctenophores, scyphozoans and
antho- and leptomedusan hydrozoans [66,70–73]. One other encountered amphipod was assigned to Platysceloidea and this superfamily mostly associates with siphonophores or in some cases with medusae [70,71,74]. High abundances of gelatinous zooplankton [75] as well as cephalopods [76] have been found in the equatorial upwelling region and subtropical and tropical waters of the Atlantic, respectively, where our samples were taken. Gelatinous zoo- plankton play an important role in energy and matter transformation and its direct impor- tance as prey may be largely underestimated [69,77]. Even though it is of low caloric value due to its high water content, a large predator may satisfy parts of its energy requirements by prey- ing on large amounts of gelatinous zooplankton [78] and focusing on body parts of higher energetic value such as gonads or stomachs. Furthermore, the low energy content may be com- pensated for by faster digestion [68]. Although gelatinous zooplankton taxa are increasingly recognized as an important prey for higher trophic predators [78–80], only few accounts exist to date for cephalopods [68,81–84]. Our findings present a good case for why it is probable thatS.pteropusis also consuming gelatinous zooplankton (i.e. salps, medusa) in the eastern tropical Atlantic.
Stable isotope analysis of squid gladii
The stable isotope analysis ofS.pteropusgladii provided a broad picture of its feeding ecology.
Our results showed not only an increase from lower to higher trophic level prey in some indi- viduals, but also strong individual variation in all squid throughout their entire life. Although all individuals showed different@15N baselines as juvenile squid,@15N in gladii tissue increased significantly with a GL>20 cm. The individuals C and E showed a particularly steep increase.
These findings are in line with the mantle stable isotope measurements reported in this study, showing an increase in@15N by 2.5 ‰ from 15.0 to 47.5 cm ML. The high variation in nitrogen stable isotopes observed in all individuals could be explained by movements into foraging areas with different isotopic baseline values since this species is highly migratory [17].Stheno- teuthis pteropusis able to temporarily live in a pronounced oxygen minimum zone (OMZ) [5,17,19] and undergoes intense vertical migration [17]. In the absence of oxygen,bacteria use nitrate to consume organic matter (denitrification). Denitrification preferentially removes
14N-NO3-
and leaves residual nitrate15N-enriched [85] which leads to an increase in the base- line@15N [29,86]. Additionally,@15N values of marine predators are affected by vertical migra- tion. Predators feeding on mesopelagic prey resources have higher@15N values than predators feeding on epipelagic prey [87,88] possibly as an effect of nutrient cycling [89–91]. Therefore, variation in@15N can only be interpreted as a shift in trophic position when the squid does not change foraging area (no change in@13C), because such a change may affect the@15N baseline [29]. Without a@15N baseline we cannot clearly distinguish between an increase in trophic position and an increase in@15N baseline values due to horizontal or vertical migration. The
@13C values of the most recent gladius increments of the five large squid (A, B, C, D and E) were similar suggesting that they foraged in the same habitat before capture. However, during their lifetime@13C values fluctuated substantially in all individuals and increased significantly after 20 cm GL.Sthenoteuthis pteropusspawns in the eastern equatorial Atlantic and its early life stages are quickly dispersed in the equatorial zone [17,19]. Females from the northern pop- ulation (north of equator) migrate about 2500 km during the summer from the Cape Verde Islands up to Madeira and back [19]. Immature and mature females form several large groups in different geographical ranges with immature females occupying colder waters and mature females inhabiting warmer waters [19]. Zuev and Nikolsky [19] identified two distinct size groups of mature females in the same region where we sampled: an equatorial and a northeast- ern group. From December until May these two groups merge and in June until November
they separate again [19]. These differences in migratory behavior may explain the differences in@13C and@15N in the gladii of the five individuals throughout almost their entire life and suggest that they foraged in different habitats with different isotopic baselines. The@13C signa- ture follows productivity. It shows higher values in productive nearshore waters, such as upwelling zones. In less productive offshore regions, the@13C signature has lower values. In pelagic ecosystems the@13C signatures are lower at higher latitudes than at lower latitudes.
[29]. All females analyzed in this study were caught at low latitudes close to a productive upwelling zone. This could explain the significant increase in@13C in individuals larger than 20 cm GL. However, many of the prey ofS.pteropusalso migrates and hence are also affected by different stable isotope baselines, whose signatures then manifests in the predatory squid.
Analyses of squid and prey isotope signatures from multiple years and seasons are needed to draw a full picture ofS.pteropustrophic ecology, identify environmental effects and trace down the causes of variation in stable isotope signatures.
Individual variation in Sthenoteuthis pteropus
Although several studies stress that individual ecology varies widely among species and popu- lations [45,88,92,93], traditionally, conspecific individuals are considered to be ecologically equivalent. In this study, gladii isotopic values showed strong intra- and inter-individual varia- tion over time and body size. Overlapping@13C and@15N values were observed among some individuals, indicating foraging in similar habitats and at similar trophic levels, but every examined squid revealed a unique isotopic pattern throughout its life. The variable and strong intra-individual variation in isotopic shifts that were observed along the proostracum are in accordance with other studies (Dosidicus gigasandBerryteuthis magister)suggesting a complex life history of these squids [3,28,45,94]. Squid may conform their foraging strategies to prey availability that changes with season, year and habitat. Spatial and temporal variation in prey availability combined with phenotypic differences betweenS.pteropusindividuals may shift the squid populations from generalists to foraging specialists [3,95,96]. This hypothesis is sup- ported by the findings of Ruiz-Cooley et al. [21] and Hunsicker et al. [3], which suggest that the variable but increasing@15N values along the proostracum ofDosidicus gigasandBerry- teuthis magisterare an effect of prey availability and optimal foraging strategy. The increasing but variable@15N values suggest thatS.pteropusopportunistically feeds on available prey [17], but as it grows it becomes able to consume prey from higher trophic levels. For example,@15N in muscle fromOmmastrephes bartramiiover 4 years differed significantly, possibly due to changes in prey consumption [97]. The largest female (Individual C; 47.5 cm ML) investigated in this study had 1 to 2‰ lower@15N isotopic values in muscle tissue than the other four large females (>40 cm ML). Its trophic position (with@15N of 11.3 ‰) seems to be similar to squid smaller than 30 cm. Stable isotope data from muscle would have lead us to incorrectly assume that squid individual C occupies the lowest trophic position compared with the other four large individuals. However, gladii data showed that@15N values of all squid were different throughout their life and individual C hatched in a region with the lowest@15N baseline of all the large individuals investigated. This finding emphasizes individual variation that can only be detected by applying multiple techniques. Individual variation as observed here may have been underestimated in previous studies on feeding in oceanic squid, but may have potentially important ecological, evolutionary and conservation implications [92,93].
Stable isotope analysis of muscle
@15N values of the muscle tissue ofS.pteropushad a range of 3.6‰, with a significant increase by around 2.5 ‰ as the squid grows to a ML of around 40 cm. This is the equivalent to an