• Keine Ergebnisse gefunden

Impact of Kilobar Pressures on Ultrafast Triazene and Thiacyanine Photodynamics†

N/A
N/A
Protected

Academic year: 2021

Aktie "Impact of Kilobar Pressures on Ultrafast Triazene and Thiacyanine Photodynamics†"

Copied!
7
0
0

Wird geladen.... (Jetzt Volltext ansehen)

Volltext

(1)

Jour nal Name

Impact of Kilobar Pressures on Ultrafast Triazene and Thiacyanine Photodynamics

Lena Grimmelsmann, a Vitor Schuabb, b Beritan Tekin, a , Roland Winter, b and Patrick Nuernberger ∗a

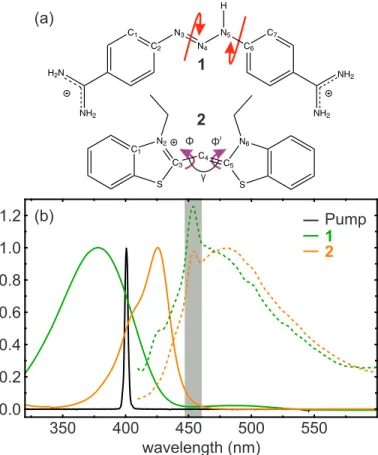
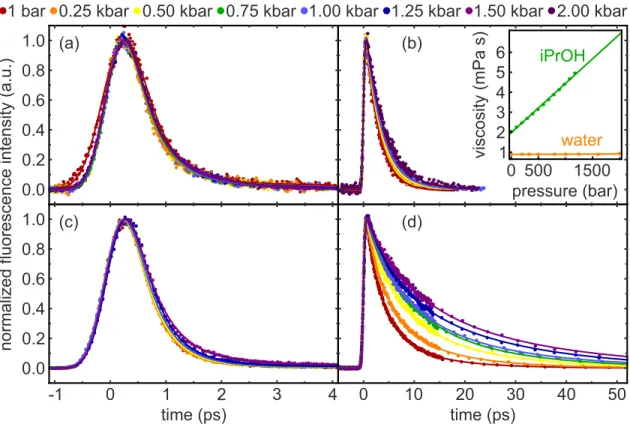
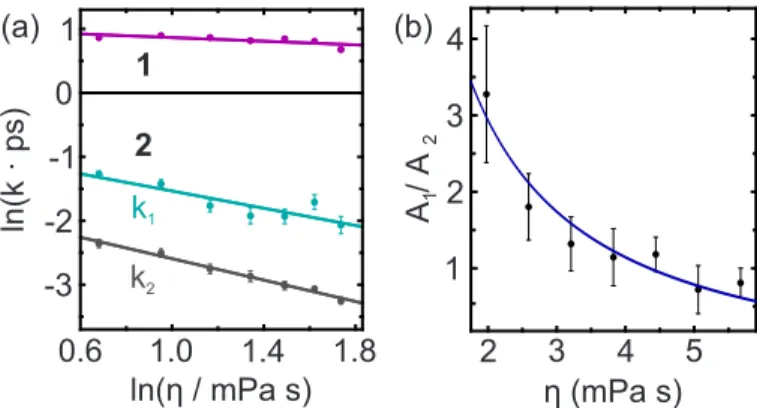
Very short fluorescence lifetimes evidence ultrafast deacti- vation of photoexcited molecules. To unveil the underlying mechanism for two compounds exhibiting (sub)picosecond emission dynamics, we combine femtosecond fluores- cence upconversion with high-pressure liquid-phase spectroscopy. For the triazene berenil, the absence of a pressure dependence corroborates a bicycle-pedal motion as deactivating process. In the thiacyanine NK88 which may undergo a bi-phasic deactivation, our results suggest that kilobar pressures lead to a modification of the excited-state potential energy surface, thereby changing the branching ratio of two competing pathways and opening a possibility to steer the product distribution of the photoreaction.

Photochemical reactions in the liquid phase are commonly sen- sitive to the solvent whose decisive properties comprise the po- larity, viscosity, dielectric constant, or hydrogen-bonding capabil- ities. To deduce the influence of these quantities, reactions are often studied in different solvents and the reaction rates are corre- lated with a certain property. However, solvent substitution bears the innate disadvantage that not only one but rather all solvent properties are in effect varied. A more purposive approach for changing e.g. the viscosity is realized by increasing the pressure or decreasing the temperature 1 which leaves changes of the sol- vent polarity at a moderate level. A further advantage of the pressure modulation approach is that the thermal energy remains

a

Physikalische Chemie II, Ruhr-Universität Bochum, 44780 Bochum, Germany; E-mail:

patrick.nuernberger@rub.de

b

Physikalische Chemie I – Biophysikalische Chemie, Technische Universität Dortmund, Otto-Hahn-Straße 4a, 44227 Dortmund, Germany

Electronic Supplementary Information (ESI) available: absorption and fluores- cence spectra in water, pressure-dependent fluorescence spectra, fitting details, flu- orescence decays at additional wavelengths, detailed fit results, comparative 1 bar measurement. See DOI: 10.1039/b000000x/

∗ The empirical solvent polarity parameter E

T

(30) for the solvent isopropanol as used in this study shows a slight enhancement from 48.38 kcal/mol at 0.98 bar to 49.19 kcal/mol at 1.92 kbar.

2

constant while the density (volume) of the solution is changed upon compression.

A light-induced reaction of utmost importance is cis-trans pho- toisomerization which can proceed on an ultrafast time scale as in the primary step of vision. 3–5 Pioneering work on the influ- ence of high pressure on the photoisomerization dynamics of stil- bene, diphenylbutadiene (DPB), and a few other systems was performed with transient absorption spectroscopy 1,6–12 and time- correlated single-photon-counting 13–17 . For DPB a strictly linear dependence of the rate constant on the inverse of the solvent vis- cosity was found for n-alkanes and n-alkanols, whereas for trans- stilbene, a nonlinear dependence was observed. The reason for this nonlinear behavior is justified on the one hand in the low- ering of the energy barrier with increasing pressure and viscosity and on the other hand in the competition between the photoi- somerization reaction and the solvent relaxation, because with increasing pressure the solvent relaxation slows down and the isomerization process starts or is even completed before the sol- vent dipoles have changed their orientation.

In general, cis-trans photoisomerization of C=C, C=N, and N=N bonds can be more multifaceted than a customary rotation and proceed via diverse alternative mechanisms. Beyond rota- tion, these comprise inversion, the bicycle-pedal motion 5,18,19 as well as the hula-twist 20,21 and the NN-twist 22,23 discussed for azobenzene. The latter mechanisms require less volume for the involved geometrical changes of the solute and hence should pos- sess a reduced sensitivity to high pressure compared to a rotation mechanism. Certain compounds even exhibit competing excited- state pathways for photoisomerization. 5,24

Here, we investigate the ultrafast fluorescence decay of two sys-

tems with unconventional photoisomerization dynamics: on the

one hand, a triazene 1 for which the volume-conserving bicycle-

pedal motion is proposed; on the other hand, a thiacyanine 2

which shows two excited-state photoisomerization pathways of

different symmetry. Both systems further stand out because of

the very rapid dynamics and resultant short emission lifetimes on

(2)

the (sub)picosecond timescale. Our fluorescence upconversion data on the response of these systems to kilobar pressures further elucidates the underlying photoisomerization mechanism and di- rectly corroborates the extent of associated geometrical changes.

The ultrafast photodynamics of the thiacyanine 2 (3,3’-diethyl- 2,2’-thiacyanine, trivial names NK88 or THIA, Fig. 1a) were ex- plored both by theory 24–27 and femtosecond spectroscopy. 26–31 In solution at room temperature, 2 is in the almost planar trans form. 27 After excitation, the molecules evolve on the excited-state potential energy surface (PES) involving a conical intersection and may relax back to trans, but also the cis or the d-cis config- uration can be reached. 24–26 The main difference lies in the two angles φ and φ 0 , for a graphical representation of the isomers we refer to Ref. 26. Regarding excited-state processes after photoex- citation of the trans isomers, computations revealed that initially, the N 2 -C 3 bond is extended while C 1 -N 2 is shortened, followed by a conrotatory rotation about C 3 -C 4 and C 4 -C 5 (φ = φ 0 = 155

◦ ) and an augmentation of the angle γ (Fig. 1a), leading to a lo- cal minimum S 1 Min local on the S 1 PES. Then, two different path- ways are possible: the so-called C 1 path proceeds under breakage of the C 2 symmetry over a small barrier to the global minimum S 1 MinC 1 (φ = 180 and φ 0 = 112 ), a twisted intramolecu- lar charge transfer (TICT) state. The second path preserving C 2

symmetry involves a significantly higher barrier, leading to the S 1 MinC 2 global minimum (φ = φ 0 = 94 ) which is also a TICT state. 27 . The concurrent nature of these paths is adumbrated by the observation of two excited-state lifetimes of 2–3 ps and 9 ps in methanol. 27 This rapid S 1 depopulation is further reflected in the low fluorescence quantum yield of Φ f = 4.5· 10 −4 in methanol. 31 An even lower value of Φ f ≈ 0.9 ·10 −4 is found for the triazene compound 1 (diminazene, trade name of the aceturate is bere- nil, Fig. 1a). 32 Absorption and fluorescence of 1 and 2 cover a similar spectral range (Fig. 1b). For 1 in water, the most stable isomer at room temperature is as well the trans isomer for which the triazene bridge and the phenyl rings are coplanar and only the amidinium groups are twisted. Upon excitation, the N 3 =N 4

bond elongates, followed by a torsion of the C 2 -N 3 =N 4 -N 5 dihe- dral angle equivalent to a volume-conserving bicycle-pedal mo- tion. 32 Despite various (coincidental) similarities for 1 and 2, the photoisomerization mechanisms differ drastically, stimulating a comparison of the impact of high pressure on the dynamics.

Materials and Methods

The fluorescence upconversion experiments (see Ref. 32 for setup details) comprise 400 nm excitation pulses polarized under magic angle 33 with regard to the fluorescence that is upconverted with an 800 nm fundamental pulse from the employed Ti:Sapphire os- cillator. A high-pressure cell (ISS) was filled with water and the sample cuvette (round, path length 1 cm) was placed in the center of the cell and closed with TestTubeSeal (Diversified Biotech) and an O-ring, then the cell was connected to a hand pump (NOVA Swiss) for the generation of pressures up to 2 kbar. Since 8.5 mm sapphire windows as well as the water and sample layers had to be traversed by the light, the instrument response function (IRF) determined by upconversion of scattered pump light decreased to 600 fs FWHM for high pressure measurements. The fluores-

1.0 0.8 0.6 0.4 0.2 0.0 1.2

350 400 450 500 550

wavelength (nm)

2 1 Pump

Φ Φ

I

γ

(a)

(b)

1

2

Fig. 1 a) Chemical structure of the two studied compounds (counterions not shown). The arrows indicate the photoisomerization mechanisms.

b) Normalized steady-state absorption (solid) and fluorescence (dashed) spectra of 1 (green) and 2 (orange) dissolved in isopropanol. The spec- trum of the excitation pulses are shown in black. The gray-shaded area indicates pronounced Raman signals from the solvent.

cence traces were fitted with a custom fitting routine consisting of a convolution of the IRF with a sum of exponentials modelling rise and decay components. Water and isopropanol were selected as solvents. However, 1 is more stable in a buffer composed of 50 mM Tris-HCl and 250 mM KCl, therefore for 1 the buffer was used instead of water. However, since the buffer consists mainly of wa- ter, we will not distinguish between water and the buffer in the description of the results. The concentrations of 1 (berenil from Sigma Aldrich) and 2 (NK88 from Exciton Dyes) were adjusted to an optical density of 0.1 at 400 nm. For 1 in isopropanol the optical density was 1.5 at 400 nm for a sufficient signal-to-noise ratio. Comparative 1 bar measurements were performed with a flow cuvette (flat, path length 0.2 cm).

Results of high-pressure studies

The time-resolved fluorescence traces at an emission wavelength

of 480 nm are shown in Fig. 2 for 1 and 2 dissolved in either

water or isopropanol and for pressures ranging from 1 bar up to

2 kbar. For isopropanol solutions, the decay traces for emission

wavelengths of 500, 520, and 540 nm can be found in the ESI .

The emission decay of 1 in water (Fig. 2a) does not exhibit sig-

nificant modifications even when the pressure is increased to the

kbar regime. Notably, a similar observation is made for 2 dis-

solved in water (Fig. 2b), for which only a minor increase of the

(3)

normalized fluorescence intensity (a.u.) 1.0 0.8 0.6 0.4 0.2 0.0 1.0 0.8 0.6 0.4 0.2 0.0

-1 0 1 2 3 4

time (ps)

0 10 20 30 40 50

time (ps)

1 bar 0.25 kbar 0.50 kbar 0.75 kbar 1.00 kbar 1.25 kbar 1.50 kbar 2.00 kbar 6

5 4 3 2 1

viscosity (mPa s)

pressure (bar) 0 500 1500

water iPrOH

(a) (b)

(c) (d)

Fig. 2 Fluorescence traces at an emission wavelength of 480 nm under pressure variation for 1 dissolved in water (a) and in isopropanol (c), as well as 2 dissolved in water (b) and isopropanol (d). The inset of b) shows the viscosity’s dependence on the pressure for water (orange) and isopropanol (green). 34,35 Dots represent experimental data and fits are indicated by lines.

emission lifetime is found for the enhancement of the pressure to 2 kbar. This virtual insensitivity to pressure in the case of water can be explained by the dependence of water’s viscosity on pres- sure (inset of Fig. 2b). On a rather minuscule range from 0.884 to 0.895 mPa s, the viscosity first decreases until a minimum is reached at ≈500 bar, then it slowly increases upon pressure ele- vation. 35 However, compared to alcoholic solvents, the viscosity of water can be regarded as constant over the pressure range ap- plied here.

By contrast, the viscosity of isopropanol strongly increases with pressure in an almost linear fashion (inset of Fig. 2b). Looking at the fluorescence traces of 1 in isopropanol (Fig. 2c), a similar picture as in the case of water is found; raising the pressure does not reveal significant differences in the temporal decay charac- teristics. Quite the opposite behavior is observed for 2 for which the emission extends over a longer period of time with increasing pressure (Fig. 2d).

We mostly concentrate on the isopropanol studies because of the negligible pressure dependence of the viscosity of water. For 2, globally fitting the fluorescence traces at different emission wavelengths yields three lifetimes τ 0 to τ 2 for each pressure (see ESI for a detailed table with all fit results). The shortest life- time τ 0 varies between 0.22 ps and 0.42 ps with no pronounced dependence on solvent viscosity. The amplitude associated with τ 0 has positive values for an emission wavelength of 480 nm de- scribing a decay, but for lower-energy emission wavelengths it turns negative, corresponding to a rise in emission intensity. This is in accordance with excited-state relaxation, since at the short-

wavelength side the emission occurs from an unrelaxed excited- state, whereas for the long-wavelength side emission from a re- laxed excited-state dominates 36 . We note that solvation dynam- ics in isopropanol proceed more slowly on the order of 70 ps at 1 bar, 37 therefore the solvent shell has not yet relaxed while the solute molecules are in the excited state.

The second lifetime τ 1 increases from 3.6 ps at 1 bar to 7.9 ps at 1.5 kbar, whereas τ 2 shows a prolongation from 11 ps to 26 ps in this pressure range. These time constants found at 1 bar are in line with those found for 2 in methanol, 27 by cause of the higher viscosity of isopropanol (2.036 mPa · s at 25 C) 34 compared to methanol (0.546 mPa · s at 25 C), 34 both lifetimes are slightly prolonged.

For 1 in isopropanol, best results are obtained by fitting with two lifetimes τ 1 B and τ 2 B for each pressure and wavelength. For all pressures, τ 1 B takes values in the region between 0.41 ps and 0.51 ps, with an associated amplitude above 99% except for 1.5 kbar where it is 98%. Our earlier study 32 for 1 in water at 1 bar revealed a biexponential decay with 0.25 ps and 0.73 ps, yield- ing an average fluorescence lifetime of 0.37 ± 0.03 ps. Due to the longer IRF in the high-pressure studies, we conjectured that this biexponential decay is only resolved as one mean time constant.

To verify this, we performed another measurement with 1 in iso-

propanol in a flow cuvette, the fluorescence traces are presented

in the ESI . In this case, a global deconvolution fit can model the

measured data adequately with three lifetimes (0.27 ps, 0.94 ps,

and 13.0 ps) for all emission wavelengths. Calculating the aver-

age fluorescence lifetime from the first two yields 0.39 ps with

(4)

an amplitude of 99%, which is identical within the error range to the measurements with the high-pressure cell. Therefore, we con- clude that the time resolution when using the high-pressure cell is not sufficient to disentangle the two sub-picosecond lifetimes, but rather τ 1 B obtained in the high-pressure study corresponds to the averaged lifetime determined in the 1 bar studies. The second fluorescence lifetime τ 2 B of the high-pressure experiment (and the third one when measuring with the flow cuvette) cannot be re- lated to the excited-state of 1, and also the low amplitude on the order of 1% points towards a signal from a side reaction. For triazene compounds, a rearrangement mechanism leading to an azobenzene derivate is known, 38 so that we suspect that a small part of 1 decomposes in isopropanol under illumination to form azobenzene derivates. These can as well absorb at the excitation laser’s wavelength and S 1 -S 0 relaxation of azobenzene gives rise to the τ 2 B decay component observed in our upconversion study, for which the rate determination is subject to a rather large error because of the low amplitude. All derived time constants and am- plitudes for 1 and 2 dissolved in isopropanol are summarized in the ESI .

Analysis of high-pressure studies

In the following, we examine the changes of fluorescence life- times and amplitudes in terms of viscosity rather than pressure, connecting the two properties using the linear relation given in Ref. 34. To quantify the viscosity dependence of the different excited-state pathways, we consult the Kramers equation 39

k = A ·exp

− E A RT

· η 2

B 2 + 1 1/2

− η 2ω B

!

, (1)

where A represents the pre-exponential factor in the transition- state theory limit, E A the barrier height for the reaction, η is the viscosity, k the rate constant and ω B a parameter describing the shape of the PES in the barrier region. At the high friction limit, i.e. for large solvent viscosities, Kramers’ model approaches the Smoluchowski limit given by 40,41

k = A · exp

− E A

RT

· ω B

η . (2)

However, equation 2 with the inverse proportionality on η does not lead to satisfying results fitting experimental data. Therefore, rates are prevalently modelled using a power-law function 14,42–52

k = exp

− E A RT

· ν

η α , (3)

where ν represents the exerted pressure at unit viscosity and α (ranging between 0 and 1) reflects the rate’s dependence on the viscosity. A large α is connected to a strong viscosity dependence of the rate, whereas small α values indicate a weak dependence.

The explanation of the reduced viscosity effect (that is, α < 1) is justified in the correlation between α and ω B : for small values of ω B , i.e. a flat energy barrier, α is close to 1, but for large ω B

values entailing a sharp barrier, α is smaller than 1. 53 Moreover, in the literature further interpretations can be found for this re- duced viscosity effect: on the one hand, the breakdown of the

Stokes-Einstein relation between diffusion coefficients along the reaction path and the viscostiy of the medium, 11 and on the other hand, the multidimensional PES topology in the barrier region. 14 More general cases going beyond Kramers’ treatment have been addressed theoretically, 41 e.g. frequency-dependent friction 54,55 or the limit of weak solvent forces 56–58 by the Hynes group.

1 2

Fig. 3 a) Log-log plot of the solvent-viscosity dependence of the fluo- rescence decay rates for 1 (upper line) and 2 (lower two lines) dissolved in isopropanol. Dots represent the experimental data, fits are indicated by lines. b) Ratio of the amplitudes A 1 and A 2 associated with the rates k 1 and k 2 , respectively, for 2 in isopropanol. The blue line shows a 1/η dependence with an offset to guide the eye.

By using the logarithm of Eq. (3) for fitting our data, we obtain the viscosity dependence of the rates (Fig. 3). The fluorescence traces of 1 in isopropanol (Fig. 2c) already imply a low viscosity dependence, as is substantiated by a value of 0.14 determined for α. We have also fitted the data using Eq. (1) for comparison (confer Fig. 4 in the ESI ), yielding an almost linear behavior with an average slope of 0.15, in good agreement with α =0.14.

The same procedure was carried out for the rates k 1 = 1/τ 1 and k 2 = 1/τ 2 of 2 in isopropanol, which are associated with the two competing isomerization pathways. For k 2 , the fit results using Eqs. 1 and 3 are almost identical, with values of 0.83 as mean slope and α 2 =0.84, respectively. The fits of k 1 to Eqs. (1) or (3) are less alike, so that values of 0.77 and α 1 =0.67 are found, re- spectively, as might partially originate from the larger dispersion of the fluorescence decay rates. Nonetheless, both the analysis with the Kramers model and with the power-law approach reveal the same behavior, namely that the isomerization path described by k 2 exhibits a more pronounced viscosity dependence than the one of k 1 .

The decay rate k can be described as the sum of the radiative rate k r and k nr describing non-radiative processes. With the initial amplitude A of the decay, the total fluorescence intensity is pro- portional to A/k, while the total amount of molecules deactivating either radiatively or non-radiatively is proportional to A/k r . As- suming the radiative rate is only weakly dependent on the solvent environment which hence mostly influences the non-radiative

† The radiative rate of a solute depends on the refractive index n of its solvent en-

vironment. Commonly, the proportionality is n

2

,

59

but more complex dependencies

are possible.

60,61

For isopropanol, there is a lack of data on the pressure depen-

dence of n, so that we can only refer to a comparison with ethanol for an estimation

(5)

processes, the ratio of molecules following the two isomeriza- tion paths is A 1 k 2,r /A 2 k 1,r and thus proportional to the viscosity- dependent branching ratio A 1 /A 2 (Fig. 3b). A qualitatively mono- tonic decrease with pressure is found, hence the relative ampli- tude A 2 corresponding to k 2 gets larger with increasing viscosity whereas A 1 gets smaller.

Discussion

The ultrafast emission characteristics of 1 are found to be vir- tually identical for all applied pressures both in water and in isopropanol, substantiating a negligible viscosity impact on the underlying deactivation mechanism. While this behavior may apply to several deactivation processes as e.g. intramolecular proton transfer or spin multiplicity changes, it is also implicated in volume-conserving photoisomerization dynamics. It was pre- viously inferred from calculations and studies with 1 bound to large biomolecules and in viscous solvents 32 that the volume- conserving mechanism of the bicycle-pedal motion includes a con- certed rotation about the N=N double bond and the C-N sin- gle bond which is insensitive to geometrical restrictions. Hence, the high-pressure study complements previous results and further corroborates the bicycle-pedal motion to be active in the photoi- somerization of 1.

For 2 in water, the absence of a strong viscosity variation with pressure is directly reflected in the closely matching fluorescence traces up to 2 kbar. In isopropanol, the two decay rates k 1 and k 2 exhibit a pronounced yet dissimilar viscosity dependence. This difference can be explained in context of the different molecular motions found in calculations. 24,25 Rotation around a C=C dou- ble bond is a large amplitude motion for which the ring system has to at least partially move through the viscous environment, but to a different extent depending on the underlying mecha- nism. The C 1 path proposed for 2 27 includes a disrotatory motion of the two rings, with the initial angles φ = φ 0 = 155 changing to φ = 180 and φ 0 = 112 at the global minimum S 1 MinC 1 . In contrast, the C 2 path guides the molecules via a conrotatory mo- tion of the two rings to the global minimum (S 1 MinC 2 ). While the starting point for the angles is identical to the C 1 path, the end point for the C 2 path is φ = φ 0 = 94 . Thus, on the way to the S 1 MinC 2 both rings rotate about 61 , whereas on the way to S 1 MinC 1 one ring has to rotate about 25 and the other one about 43 . 27

These geometrical considerations imply that the C 2 path is more affected by the solvent viscosity because the rings have to rotate further along the C 2 path compared to the C 1 path. Since the C 1 path is associated with a low barrier on the PES whereas the C 2 path involves a high barrier, 27 the faster decay rate (i.e.

k 1 in our study) has previously been assigned to the C 1 path and the slower one (k 2 ) to the C 2 path. With this assignment, the observation that k 2 decreases more strongly (both in relative and absolute terms) with pressure than k 1 is consistent with the im-

of the effect: in ethanol at 298.15 K and at a wavelength of 546 nm, n=1.3609 at 1.013 bar and n=1.4005 at 1.520 kbar.

62

High pressure might also influence the ra- diative rate via modifications to the charge-transfer character of involved species or modifications to the PES (vide infra).

plications from the calculated ring displacements in Ref. 27. This is further reflected in the higher α value derived for the k 2 decay component with the power-law approach of Eq. (3) as well as in the Kramers model analysis.

However, two further aspects have to be discussed: on the one hand, the theory leading to Eq. (3) connects α values close to 1 with a flat energy barrier, those smaller than 1 to a sharp barrier in the excited-state. 53 Thus, the C 2 associated path for which a higher barrier is reported should exhibit a less pronounced viscos- ity dependence, yet the opposite is found in our studies (α 2 =0.83 versus α 1 =0.62). On the other hand, our analysis shows that the higher the pressure, the more molecules follow the pathway associated with k 2 . This preference is counterintuitive, because the molecules favor the distinctly slower pathway with increasing viscosity.

The examination of an isomerization reaction in solution asks for the consideration of the couplings between the isomerizing solute and the solvent molecules as well as of the intramolecular couplings of the solute. Both processes can be solvent-dependent, so that the PES of the photoisomerization reaction is affected by the properties of the solvent. 11 For a viscosity-dependent PES, dif- ferent scenarios are conceivable: i) The excitation with a 400 nm laser pulse creates a population in the S 1 state, then the initial geometrical changes lead towards the local minimum S 1 Min local on the PES from where the branching occurs into the C 1 or the C 2 path. 27 To account for the enhanced relative population along the C 2 path at higher pressure, the barrier of the C 1 path has to increase while that of the C 2 path has to decrease with increas- ing viscosity. However, this is not consistent with the decay rates since k 2 associated with the C 2 path increases more strongly than k 1 with viscosity. ii) The excitation with a 400 nm laser pulse cre- ates a population in the S 1 state whose PES is already altered in the Franck-Condon region by the elevated pressures. Quantum- chemical calculations carried out at 1 bar estimated the PES for the C 1 path and for the C 2 path, concluding that the curves almost coincide up to about φ 0 = 140 before the two channels split up. 27 Our results imply that with increasing viscosity, the PES is modi- fied such that already at the Franck-Condon point, the decision is made that a smaller population will follow the C 1 path.

One might further argue that the assignment of the dynamics with rates k 1 and k 2 to the C 1 and C 2 paths, respectively, possi- bly has to be interchanged. Then, the α dependence on viscosity would be in accord with theory (yielding the lower α value for the higher barrier) and also the relative branching ratio would indicate that the pathway requiring less torsional motion and ex- hibiting the lower barrier is the one that is favored under higher pressure. However, in this interpretation the photoisomerization dynamics would always proceed more rapidly along the pathway with the significantly higher barrier in the excited state, which seems rather implausible.

The preceding discussion assumes that there is a bifurcation in

the excited state of 2 giving rise to two emissive pathways, as

indicated in calculations and experiments. 24–27 In fluorescence

upconversion, other origins can generally also cause bi- or mul-

tiexponential decays, e.g. the presence of several ground-state

isomers to start from or equilibration with the environment. 36,63

(6)

However, the absorption spectrum points towards only one iso- mer in the initial solution, and the solvation dynamics of iso- propanol 37 are rather slow compared to the exponential decay times of the emission observed here. To unambiguously rule out any of the possibilities, deciphering the different pressure sensi- tivity (Fig. 3) of the latter in future studies might be crucial.

We thus conclude that pressure in the kilobar regime has an im- pact on the shape of the multidimensional excited-state PES, 41,64 consequently giving rise to the observed dynamics. In high- pressure studies on the photoisomerization of stilbene, a mod- ification of the reaction path in the excited-state PES was re- ported 1,8–10 . The situation for 2 is in analogy to the case of stil- bene, with the distinction of two competing pathways towards the formation of ground-state isomers after photoexcitation.

Conclusion

Our experiments, to our knowledge the first fluorescence- upconversion studies for samples exposed to kilobar pressures, could shed light on the mechanism underlying the ultrafast dy- namics of two photoisomerizing compounds. For the triazene 1, it is found that the fluorescence characteristics are basically insen- sitive to a viscosity increase of the solvent environment effectu- ated by elevated pressures. The results reinforce that the volume- conserving bicycle-pedal motion governs the excited-state deacti- vation.

For the thiacyanine 2, our data is interpreted in view of earlier findings which disclosed that there are two competing excited- state pathways involved in the photoisomerization process. Both pathways require large-amplitude motion of the ring systems, thus the overall excited-state deactivation is slowed down in iso- propanol under high pressure. The decay characteristics of the two pathways exhibit a different dependence on viscosity, and we conclude that the impact of elevated pressures is a reshaping of the excited-state PES. This in turn changes the relative amount of molecules following a certain reaction pathway after photoexci- tation. Since the two competing reaction channels in the excited state are possibly also connected to different ground-state isomers that can be reached, pressure variation constitutes a means to ma- nipulate the outcome of the photoisomerization reaction.

We may envision that the pressure perturbation approach in con- cert with solvent engineering as applied here will be used more of- ten in the future to reveal de-excitation pathways in photochem- ical processes and to control product selectivity and reactivity by suppressing or enhancing certain reaction pathways via their sol- vent and pressure sensitive activation volumes.

Acknowledgement

This work has been supported by the Deutsche Forschungsge- meinschaft within the Cluster of Excellence RESOLV (EXC 1069), Research Unit FOR 1979 [R.W.], and the Emmy-Noether Program [P.N.].

Notes and references

1 L. Nikowa, D. Schwarzer, J. Troe and J. Schroeder, J. Chem. Phys., 1992, 97, 4827–4835.

2 K. Tamura and T. Imoto, Bull. Chem. Soc. Jpn, 1975, 48, 369–374.

3 R. W. Schoenlein, L. A. Peteanu, R. A. Mathies and C. V. Shank, Science, 1991, 254, 412–415.

4 D. Polli, P. Altoè, O. Weingart, K. M. Spillane, C. Manzoni, D. Brida, G. Tomasello, G. Orlandi, P. Kukura, R. A. Mathies, M. Garavelli and G. Cerullo, Nature, 2010, 467, 440–443.

5 D. Polli, O. Weingart, D. Brida, E. Poli, M. Maiuri, K. M. Spillane, A. Bottoni, P. Kukura, R. A. Mathies, G. Cerullo and M. Garavelli, Angew. Chem. Int. Ed., 2014, 53, 2504–2507.

6 C. Gehrke, J. Schroeder, D. Schwarzer, J. Troe and F. Voß, J. Chem. Phys., 1990, 92, 4805–4816.

7 C. Gehrke, R. Mohrschladt, J. Schroeder, J. Troe and P. Vöhringer, Chem. Phys., 1991, 152, 45–56.

8 J. Schroeder, Ber. Bunsenges. Phys. Chem., 1991, 95, 233–243.

9 J. Schroeder, J. Troe and P. Vöhringer, Chem. Phys. Lett., 1993, 203, 255–260.

10 J. Schroeder, D. Schwarzer, J. Troe and P. Vöhringer, Chem. Phys. Lett., 1994, 218, 43–50.

11 R. Mohrschladt, J. Schroeder, D. Schwarzer, J. Troe and P. Vöhringer, J. Chem.

Phys., 1994, 101, 7566–7579.

12 S. Murphy, B. Sauerwein, H. G. Drickamer and G. B. Schuster, J. Org. Chem., 1994, 98, 13476–13480.

13 S. P. Velsko and G. R. Fleming, J. Chem. Phys., 1982, 76, 3553–3562.

14 S. Russo and P. J. Thistlethwaite, Chem. Phys. Lett., 1984, 106, 91–96.

15 M. Lee, G. R. Holtom and R. M. Hochstrasser, Chem. Phys. Lett., 1985, 118, 359–363.

16 N. Amdursky, R. Gepshtein, Y. Erez, N. Koifman and D. Huppert, J. Phys. Chem.

A, 2011, 115, 6481–6487.

17 M. Kondo, X. Li and M. Maroncelli, J. Phys. Chem. B, 2013, 117, 12224–12233.

18 A. Warshel, Nature, 1976, 260, 679–683.

19 I. Schapiro, O. Weingart and V. Buss, J. Am. Chem. Soc., 2009, 131, 16–17.

20 R. S. H. Liu and G. S. Hammond, Chem. Eur. J., 2001, 4536–4544.

21 M. Quick, A. L. Dobryakov, M. Gerecke, C. Richter, F. Berndt, I. N. Ioffe, A. A.

Granovsky, R. Mahrwald, N. P. Ernsting and S. A. Kovalenko, J. Phys. Chem., 2014, 118, 8756–8771.

22 M. Böckmann, N. L. Doltsinis and D. Marx, J. Chem. Phys., 2012, 137, 22A505.

23 M. Böckmann, S. Braun, N. L. Doltsinis and D. Marx, J. Chem. Phys., 2013, 139, 084108.

24 R. Improta and F. Santoro, J. Chem. Theory Comput., 2005, 1, 215–229.

25 F. Santoro, V. Barone, C. Benzi and R. Improta, Theor. Chem. Acc., 2007, 117, 1073–1084.

26 P. Nuernberger, G. Vogt, G. Gerber, R. Improta and F. Santoro, J. Chem. Phys., 2006, 125, 044512.

27 G. Vogt, P. Nuernberger, G. Gerber, R. Improta and F. Santoro, J. Chem. Phys., 2006, 125, 044513.

28 Y. H. Meyer, M. Pittman and P. Plaza, J. Photochem. Photobiol. A, 1998, 114, 1 – 21.

29 G. Vogt, G. Krampert, P. Niklaus, P. Nuernberger and G. Gerber, Phys. Rev. Lett., 2005, 94, 068305.

30 S. P. Laptenok, P. Nuernberger, A. Lukacs and M. H. Vos, Methods Mol. Biol., 2014, 1076, 321–336.

31 S. Upadhyayula, V. Nunez, E. M. Espinoza, J. M. Larsen, D. Bao, D. Shi, J. T.

Mac, B. Anvari and V. I. Vullev, Chem. Sci., 2015, 6, 2237–2251.

32 L. Grimmelsmann, A. Marefat Khah, C. Spies, C. Hättig and P. Nuernberger, J.

Phys. Chem. Lett., 2017, 8, 1986–1992.

33 S. Schott, A. Steinbacher, J. Buback, P. Nuernberger and T. Brixner, J. Phys. B:

At. Mol. Opt. Phys., 2014, 47, 124014.

34 Y. Tanaka, Y. Matsuda, H. Fujiwara, H. Kubota and T. Makita, Int. J. Thermo- phys., 1987, 8, 147–163.

35 L. P. Singh, B. Issenmann and F. Caupin, Proc. Natl. Acad. Sci. USA, 2017, 114, 4312–4317.

36 J. R. Lakowicz, Principles of Fluorescence Spectroscopy, Springer Sci- ence+Business Media, New York, 3rd edn., 2006.

37 H. Kaur, S. Koley and S. Ghosh, J. Phys. Chem. B, 2014, 118, 7577–7585.

38 B. A. Newton, in Antibiotics III - Mechanism of Action of Antimicrobial and An- titumor Agents (J. W. Corcoran, F. E. Hahn, J. F. Snell, and K. L. Arora, eds.), Springer Heidelberg Berlin, 1975, pp. 34–47.

39 H. A. Kramers, Physica, 1940, 4, 284–304.

40 P. Hänggi, P. Talkner and M. Borkovec, Rev. Mod. Phys., 1990, 62, 251–341.

41 T. Asano, in High Pressure Chemistry (R. van Eldik and F.-G. Klärner, eds.), Wiley- VCH, Weinheim, 2002, pp. 97–128.

42 C. Singh, B. Modak, J. A. Mondal and D. K. Palit, J. Phys. Chem. A, 2011, 115, 8183–8196.

43 S. Nizinski, M. Wendel, M. F. Rode, D. Prukala, M. Sikorski, S. Wybraniec and G. Burdzinski, RSC Adv., 2017, 7, 6411–6421.

44 A. K. Singh, G. Ramakrishna, H. N. Ghosh and D. K. Palit, J. Phys. Chem. A, 2004, 108, 2583–2597.

45 B. D. Allen, A. C. Benniston, A. Harriman, S. A. Rostron and C. Yu, Phys. Chem.

Chem. Phys., 2005, 7, 3035–3040.

46 V. I. Stsiapura, A. A. Maskevich, V. A. Kuzmitsky, V. N. Uversky, I. M. Kuznetsova and K. K. Turoverov, J. Phys. Chem. B, 2008, 112, 15893–15902.

47 B. Bagchi, Chem. Phys. Lett., 1987, 138, 315–320.

48 C. J. Wohl and D. Kuciauskas, J. Phys. Chem. B, 2005, 109, 21893–21899.

(7)

49 G. S. Jas, W. A. Eaton and J. Hofrichter, J. Phys. Chem. B, 2001, 105, 261–272.

50 D. A. Harris, M. B. Orozco and R. J. Sension, J. Phys. Chem. B, 2006, 110, 9325–

9333.

51 S. P. Velsko, D. H. Waldeck and G. R. Fleming, J. Chem. Phys., 1983, 78, 249–

258.

52 K. L. Litvinenko, N. M. Webber and S. R. Meech, J. Phys. Chem. A, 2003, 107, 2616–2623.

53 B. Bagchi, Int. Rev. Phys. Chem., 1987, 6, 1–33.

54 R. F. Grote and J. T. Hynes, J. Chem. Phys., 1980, 73, 2715–2732.

55 J. T. Hynes, J. Stat. Phys., 1986, 42, 149–168.

56 G. van der Zwan and J. T. Hynes, J. Chem. Phys., 1982, 76, 2993–3001.

57 G. van der Zwan and J. T. Hynes, J. Chem. Phys., 1983, 78, 4174–4185.

58 G. van der Zwan and J. T. Hynes, Chem. Phys., 1984, 90, 21–35.

59 R. Lampert, S. Meech, J. Metcalfe, D. Phillips and A. Schaap, Chem. Phys. Lett., 1983, 94, 137–140.

60 T.-I. Shibuya, Chem. Phys. Lett., 1983, 103, 46–48.

61 D. Toptygin, J. Fluoresc., 2003, 13, 201–219.

62 J. S. Rosen, J. Opt. Soc. Am., 1947, 37, 932–938.

63 J. Xu and J. R. Knutson, Methods Enzymol., 2008, 450, 1159–183.

64 J. Spooner, B. Smith and N. Weinberg, Can. J. Chem., 2016, 94, 1057–1064.

Table of Contents Entry

1 bar 1 kbar

Application of high hydrostatic pressure leads to changes in

(sub)picosecond emission dynamics, depending on the mecha-

nism at work for the photoreaction.

Abbildung

Fig. 1 a) Chemical structure of the two studied compounds (counterions not shown). The arrows indicate the photoisomerization mechanisms.
Fig. 2 Fluorescence traces at an emission wavelength of 480 nm under pressure variation for 1 dissolved in water (a) and in isopropanol (c), as well as 2 dissolved in water (b) and isopropanol (d)
Fig. 3 a) Log-log plot of the solvent-viscosity dependence of the fluo- fluo-rescence decay rates for 1 (upper line) and 2 (lower two lines) dissolved in isopropanol

Referenzen

ÄHNLICHE DOKUMENTE

The one of them that first sets up images seems to be accurate lightness of software supported by the accurate weight of hardware: it allows her to be not mere surface but deep

c) Ich bin ursprünglich ein Mann, der dem Himmel gefügig und einem ruhigen Leben ergeben ist. Weil das Mingreich mit den Cahar und den Kalka mich allzu schwer beleidigt, kann ich

In the case of intensive assimilation, the well-being of the natives will not be lowered when ARD N N ( | )  ARD N M ( | ) , namely, when the aggregate relative deprivation of

Com base no capítulo introdutório, mais especificamente no Gráfico 1.2, observa-se que entre os anos de 2002 (ano base da matriz de insumo-produto estimada neste trabalho) a 2006

Yet, Hofstede’s definition of culture will have less explanatory value if recent economic developments are the reason for changes in privacy legislation (e.g. introduce an open

For the first sub-sample we found, only for one index, an increase of the mean returns during the Great Lent and a decline of volatility during the Nativity Fast.. For the

It seems that even through China increases its exports more heavily to ROW (Part 1 in Table 7 and 8, Table 10), there is a substitution effect in the interregional trade flows in

Porri and-co-workers reported the generation of a mixture of linear butenes, pentenes, hexenes and olefins higher than C 7 , from 1-pentene by isomerizing self-