Alternative Splicing: Gateways to functional diversity
Inaugural - Dissertation
zur
Erlangung des Doktorgrades
der Mathematisch-Naturwissenschaftlichen Fakult¨at der Universit¨at zu K¨oln
vorgelegt von
Dale Newton Richardson III aus Illinois
K¨oln, 2010
Tag der letzten m¨undlichen Pr¨ufung: November 2010
Eines der Ziele dieser Dissertation ist es die Rolle zweier fundamentaler bio- logischer Prozesse, die Genomduplikation und das alternative Spleißen, in der Regulation der Genexpression zu verstehen. Die Genomduplikation und das alternative Spleißen haben tiefgreifende Auswirkungen auf die Genregu- lation, wie zum Beispiel dass die kontrollierte Expression duplizierter Gene die Evolution von Genomen beeinflusst, w¨ahrend das alternative Spleißen regulatorischer Gene enorme Auswirkungen auf die Funktionalit¨at nahezu aller expressionierten Gene hat. Die Gesamtgenom-Duplikation (WGD) hat die Entstehung neuer Spezies, die Formation von Genen mit neuen Funk- tionen, oder auch die Modifizierung von Expressionsmustern beschleunigt und Organismen eine Form genetischer Robustheit verliehen.
Wir haben die Langzeit-Evolution und das Zusammenspiel von 5’ ”up- stream” regulatorischen Sequenzen (URSs), Protein-kodierenden Sequen- zen (CDSs) und Expressionskorrelationen (EC) von duplizierten Gen- Paaren im Modellorganismus Arabidopsis thaliana untersucht. Drei ver- schiedene Methoden haben eine signifikante evolution¨are Konservierung zwischen paralogen URSs verdeutlicht und waren mit Microarray-basierten Expressions-korrelationen der betreffenden Gen-Paare hoch korreliert. Die positionale Information von genauen zwischensequenzlichen ¨Ubereinstim- mungen hat den Beitrag mikro-chromosomaler Neuordnungen f¨ur die Expressionsdivergenz demonstriert. Eine Drei-Wege Ranganalyse der URS-Similarit¨at, der CDS-Divergenz und der EC haben spezifische Gen- funktionale Ver-zerrungen aufgezeigt. Transkriptionsfaktoraktivit¨at wurde mit Gen-Paaren, die konservierte URSs und divergente CDSs aufweisen, assoziiert, w¨ahrend eine große Anzahl metabolischer Enzyme mit Gen- Paaren, die sich durch divergente URSs und konservierte CDSs auszeich- nen, in Verbindung gebracht werden konnten. Bemerkenswerterweise wird die Mehrheit an duplizierten Genen in den verschiedenen Entwicklungssta- dien von Arabidopsis thaliana unterschiedlich expressioniert, was darauf hindeutet, dass oft eine der beiden Genkopien bevorzugt wird, und dass der
Zusammen mit der WGD ist das alternative Spleißen (AS) der pre- mRNA ein fundamentaler molekularer Prozess, der genetische Diversit¨at im Transkriptom und Proteom verursacht. Zahlreiche Komponenten, wie L¨ange und Sequenz der Exons und Introns, Trans-Faktoren und Transkrip- tionsraten, beeinflussen die Spleißreaktion. SR-Proteine, eine Familie von Spleiß-Regulatoren mit einem oder zwei RNA-Erkennungsmotiven (RRMs) am N-Terminus und einem ”arg/ser-rich” am C-Terminus, wirken sowohl beim konstitutiven als auch beim alternativen Spleißen.
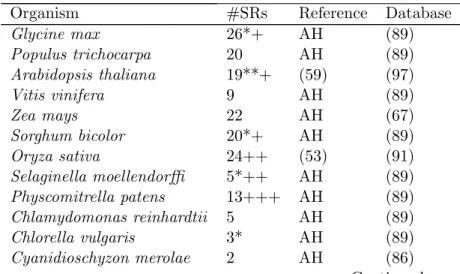
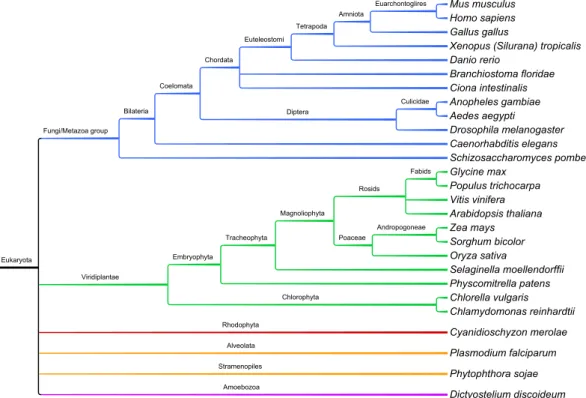
Wir haben Datenbanksuchen f¨ur SR-Proteine 27 eukaryotischer Spezies durchgef¨uhrt, die die Taxone der Pflanzen, Tiere, Fungis und basalen Eukaryonten, die außerhalb dieser Abstammungslinien liegen, umfasst.
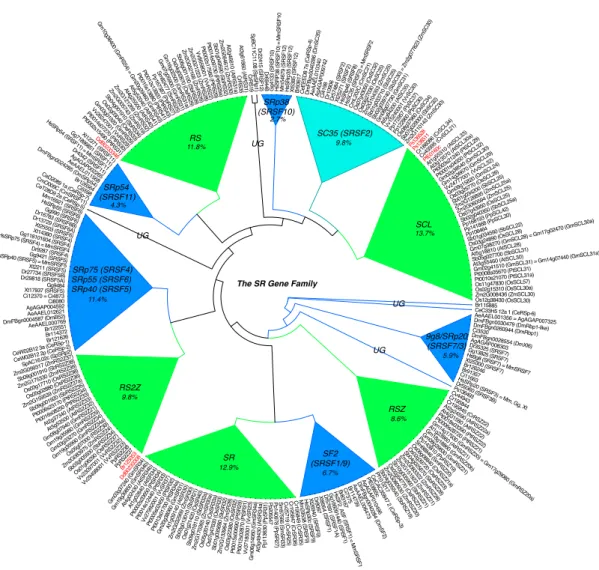
Mithilfe von RRMs als phylogenetische Marker haben wir mindestens 12 SR-Protein-Subfamilien feststellen k¨onnen, von denen vier in Pflanzen weit verbreitet sind. Zudem befinden sich RRMs innerhalb der Subfamilien von SR-Proteinen an hoch konservierten Positionen, jedoch sind ihre vorherge- sagten RNA-Bindungsresiduen degeneriert. Damit einhergehend stellten wir fest, dass die Mehrheit pflanzlicher SR Gene unter purifizierender Se- lektion steht. Dar¨uberhinaus ist die Mehrheit an paralogen SR-Genen in Arabidopsis und Reis in den diversen Entwicklungsstadien unterschiedlich expressioniert, was mit unserer Beobachtung bez¨uglich duplizierter Gene im Einklang steht. Wir haben das Ausmaß an SR-Gen betreffendes AS unter der Verwendung von Spleiß-Graphen, die auf multiple ”alignments”
von ESTs/cDNAs und SR-genomischen Sequenzen beruhen, abgesch¨atzt.
Das AS von SR-Genen ist ein weit verbreitetes Ph¨anomen ¨uber zahlreiche Abstammungslinien und ein h¨aufiges Merkmal unter Eukaryonten. Zu- dem variiert die Art der Ausf¨uhrung des AS unter Organismen und SR- Subfamilien. Abschließend suggerieren wir einen Zusammenhang zwischen der DNA-Methylation innerhalb kodierender Regionen von SR-Genen und deren Spleißmuster.
One of the goals of this dissertation is to understand how two fundamen- tal biological processes, genome duplication and alternative splicing, factor into the regulation of gene expression. Genome duplication and alternative splicing have profound implications on gene regulation, as the controlled expression of duplicated genes affects the evolution of genomes, whereas alternative splicing of regulatory genes has enormous ramifications on the functionality of nearly all expressed genes.
Whole genome duplication (WGD) has catalyzed the formation of new species, genes with novel functions, altered expression patterns, complexi- fied signaling pathways and has provided organisms a level of genetic ro- bustness. We studied the long-term evolution and interrelationships of 5’
upstream regulatory sequences (URSs), protein coding sequences (CDSs) and expression correlations (EC) of duplicated gene pairs in the model or- ganism, Arabidopsis thaliana. Three distinct methods revealed significant evolutionary conservation between paralogous URSs and were highly cor- related with microarray-based expression correlation of the respective gene pairs. Positional information on exact matches between sequences unveiled the contribution of micro-chromosomal rearrangements on expression diver- gence. A three-way rank analysis of URS similarity, CDS divergence and EC uncovered specific gene functional biases. Transcription factor activity was associated with gene pairs exhibiting conserved URSs and divergent CDSs, whereas a broad array of metabolic enzymes was found to be associated with gene pairs showing diverged URSs but conserved CDSs. Strikingly, the majority of duplicate genes are differentially expressed in magnitude throughout various developmental stages in Arabidopsis, suggesting that often one of the two gene copies is preferred and may hint at a mechanism of sub-functionalization acting at the gene regulatory level.
Along with WGD, alternative splicing (AS) of pre-mRNA is a funda- mental molecular process that generates diversity in the transcriptome and proteome of eukaryotic organisms. Multiple factors influence the splicing reaction, such as the length and sequence of exons, introns, the presence and
the N-terminus and an arg/ser-rich at the C-terminus, function in both constitutive and alternative splicing.
We performed database searches for SR proteins in 27 eukaryotic species, which included taxa from plants, animals, fungi and basal eukaryotes that lie outside of these lineages. Using RRMs as a phylogenetic marker, we ob- served at least 12 SR protein sub-families, four of which are vastly expanded in plants. Furthermore, RRMs are in highly conserved positions within SR proteins within sub-families, yet their predicted RNA binding residues are degenerate. In line with this finding is our observation that the majority of plant SR genes are under purifying selection. Moreover, the majority of paralogous SR genes in Arabidopsis and rice are divergently expressed in different developmental stages, suggesting that these gene pairs have sub- functionalized at the expression level, reminiscent of the patterns we ob- served in our duplicated genes study. We assessed the extent of SR gene AS by generating splice graphs based on multiple alignments of ESTs/cDNAs to SR genomic sequences. AS of SR genes is a widespread phenomenon throughout multiple lineages and is a common trait among eukaryotes. Fur- thermore, the types of AS vary by organism and by SR sub-family. Lastly, we suggest that there is a link between DNA methylation within coding regions of SR genes and their AS patterns.
spent their lives encouraging me and being nothing more than a bastion of love and patience. I could have never done any of this without you.
and most importantly, this is for you, Dad
I would like to convey my gratitude to those who have provided me with helpful scientific discussion, criticism and general commentary, without whose help the soundness of my studies would have been otherwise called into question. I would like to thank my supervisor, Dr. Thomas Wiehe, for his incredible understanding in my moments of desperation, exhaustion, petulance and insubordination. My thanks also go out to Dr. Heiko Schoof who has provided me with additional support and invaluable insight into the world of plant genomics. Dr. ASN Reddy ofColorado State University also deserves my sincere respect for always being open to collaboration and imparting his insurmountable expertise to me. Dr. Asa Ben-Hur, Adam Labadorf and Mark Rogers (also from Colorado State University) are ac- knowledged for their computational efforts to make feasible the study of alternative splicing across diverse phylogenetic taxa. Last but not least, I would also like to thank the members, colleagues and friends of the Wiehe lab, who have made my stay in Germany worthwhile and all together more interesting. Dr. Daniel (”JKL”) ˘Zivkovi´c has always been there to tell the horrible truth, Dr. Ivana (”KillerBee”) Vukusic who was the third mem- ber of our mighty triumvirate and who welcomed me to the hospitality of Hilden, to Robert Fuerst and Andreas (”Wolle”) Wollstein for computa- tional queries and software development, to Dr. Sabari (”S-Man”) Sankar Thirupathy for his eastern wisdom and finally, to Anton Malina for his zeal for all things science-fiction and general linux-is-superior-to-all-that-exists attidude.
1 Preface and Aims 1
1.1 Preface . . . . 1
1.2 The criticality of gene regulation . . . . 2
1.2.1 Comparative genomics as a research tool . . . . 3
1.3 Aims . . . . 4
1.3.1 Project I – Intra-species comparative genomics in Arabidopsis . . 4
1.3.2 Project II – Inter-species comparative genomics in 27 eukaryotes 4 2 Project I Introduction 5 2.1 Project I – Intra-species comparative genomics in Arabidopsis . . . . 5
2.1.1 General background information on Arabidopsis thaliana . . . . 5
2.1.2 Whole genome duplication and Arabidopsis . . . . 6
2.1.2.1 Prior research . . . . 7
2.1.2.2 Limitations and extensions of prior research . . . . 7
3 Results – Project I 9 3.1 Similarity profiles of Arabidopsis upstream regulatory sequences (URSs) 9 3.2 Inter-relationships between URSs, CDSs and expression correlation . . . 11
3.2.1 Substitution rates of CDS and their relationship with EC . . . . 13
3.3 Micro-chromosomal rearrangements of exact matches . . . . 14
3.4 Three-way rank analysis . . . . 17
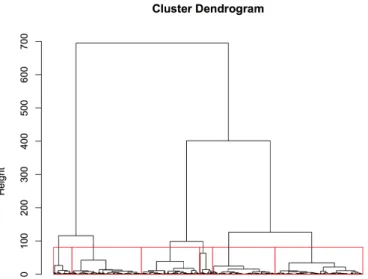
3.5 Cluster analysis of gene expression magnitude during Arabidopsis devel- opment . . . . 22
3.5.1 GO term enrichment by cluster . . . . 25
4 Discussion – Project I 39
4.1 Intra-species comparative genomics reveals insights into paralogous gene evolution . . . . 39 4.2 Traditional versus specialized methods for assessing URS similarity . . . 40 4.2.1 Same sequences, different measures . . . . 40 4.3 Delimitation of regions of high similarity within paralogous URSs . . . . 41 4.4 Positional information on exact matches . . . . 41 4.5 Gene components appear to evolve independently . . . . 42 4.6 Arabidopsis paralogs are divergently expressed . . . . 43
5 Introduction – Project II 47
5.1 Background . . . . 47
6 Results – Project II 51
6.1 SR genes comprise at least 12 sub-families . . . . 51 6.2 No particular SR sub-family is broadly conserved across eukaryotes . . . 55 6.3 SC35 (SFRS2) is likely an ancient SR gene . . . . 57 6.4 Five sub-families are vastly expanded in plants, with three of them plant-
specific . . . . 57 6.5 Five SR sub-familes are conserved across bilateral metazoans . . . . 62 6.6 Basal eukaryotes have the fewest SR sub-families . . . . 62 6.7 RRM domains are highly collinear within sub-families and across species 65 6.8 Intron number is conserved within sub-families . . . . 65 6.9 RNA binding motifs are variable within RRM regions . . . . 67 6.10 SR genes in photosynthetic eukaryotes are mostly under purifying selection 68 6.11 SR paralogs in photosynthetic eukaryotes are expressed at different mag-
nitudes . . . . 68 6.12 Alternative splicing of SR genes is widespread . . . . 71 6.13 AS event types vary by sub-family . . . . 80 6.14 DNA methylation is linked to alternatively spliced regions in Arabidopsis
SR genes . . . . 82
7 Discussion – Project II 85
7.1 The SR gene family is large and diverse . . . . 85
7.2 SR sub-family expansion in plants, structural constraints and selective pressures . . . . 87
7.3 Alternative splicing of SR genes is a common characteristic among eu- karyotes . . . . 89
7.4 Not all AS event types are created equal . . . . 90
7.5 Summary and Outlook . . . . 91
8 Materials & Methods 93 8.1 Project I – Intra-species comparative genomics in Arabidopsis . . . . 93
8.1.1 Arabidopsis duplicate gene pair sequences . . . . 93
8.1.2 Arabidopsis expression information . . . . 94
8.1.3 Working data set . . . . 94
8.1.4 Upstream regulatory sequence anaylsis . . . . 94
8.1.4.1 Shared Motif Method . . . . 95
8.1.4.2 The Index of Repetitiveness . . . . 96
8.1.4.3 DIALIGN-TX . . . . 98
8.1.5 Coding sequence analyses . . . . 99
8.2 Project II - Inter-species comparative genomics in 28 eukaryotes . . . . 100
8.2.1 Species selection . . . 100
8.2.2 Organism sampling and SR sequence acquisition . . . 101
8.2.3 Alignment procedure . . . 102
8.2.4 Gene tree inferences . . . 103
8.2.5 Genomic and cDNA/EST sequences for Alternative Splicing (AS) analysis . . . 104
8.2.6 Alternative splicing analysis . . . 104
8.2.7 Normalization of Alternative splicing measurements . . . 106
References 109
1
Preface and Aims
1.1 Preface
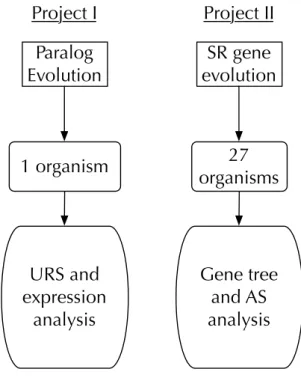
This dissertation is comprised of two major independent but thematically linked anal- yses as shown below in Fig 1.1:
Paralog
Evolution SR gene
evolution
1 organism 27
organisms
URS and expression
analysis
Gene tree and AS analysis Project I Project II
Figure 1.1: The two projects - Top-level organization of projects comprising this thesis.
The two projects are further described:
1. the analysis of whole genome duplication (WGD) derived genes in Arabidopsis thaliana with respect to upstream regulatory sequence (URS) and coding se- quence (CDS) evolution within the context of paralogous expression correlation, and
2. a study of serine-arginine (SR) rich splicing factors, which focuses on their classifi- cation into sub-families, lineage-specific abundance, conservation and alternative splicing (AS) across 27 phylogenetically distinct eukaryotic genomes.
Consequently, the remainder of this thesis is partitioned accordingly and when possible, attempts will be made to unify the two topics into a cohesive whole. For the sake of clarity and ease, each of the projects will henceforth be referred to as ”Project I” and ”Project II”. As each project was written in a modular format, the reader may choose either to begin with.
1.2 The criticality of gene regulation
How organisms develop into morphologically distinct species and respond to ever chang- ing environmental conditions can be thought of in terms of gene regulation, that is, the timing at which particular genes are expressed, the quantity and quality of the re- sultant transcripts as well as the cellular localization of those transcripts. Certainly, there are many factors that influence gene regulation either before or after an mRNA transcript has been produced, such as accessibility of genes and their promoters based on chromatin states, competitive binding of transcription activators or repressors, dif- ferential expression of transcription factors, mRNA editing, or regulated degradation of nascent transcripts by RNA surveillance mechanisms (i.e., miRNA/siRNA induced degradation). While this list is far from exhaustive, it nevertheless serves to illustrate the importance of controlling the timing and location of gene expression in order for an organism to develop and dynamically adapt to a variable environment.
However, from where do genes arise? While the question of how the first gene came into being may be largely speculative, what is more certain is that new genes can arise from pre-existing genes by means of tandem, segmental or whole genome duplication events. These duplication events have consequences on gene regulation because an
organism must now deal with superfluous copies of genes. Too much or too little of a given gene product could severely affect the viability of the organism, but extra gene copies may also provide a pathway to adaptation through natural selection. The variability conferred by gene or genome duplication and the consequent regulation of these duplicated genes can lead to the formation of new species through reproductive isolation at the molecular level due to technicalities during meiosis.
In addition to the fundamental biological process of gene/genome duplication, many eukaryotic organisms have evolved another means to generate genetic variability: al- ternative splicing. Instead of a single gene always producing the same transcript or protein product, a single gene may give rise to multiple transcript isoforms or proteins by virtue of differential combinations of exons and introns. The resultant combinations may form a viable gene product, or result in subtle variations that confer different func- tions onto the protein. Often times, alternative splicing of nascent mRNA molecules results in truncated transcripts which are degraded by mRNA surveillance mechanisms in the cell. This may at first sound wasteful, but it is an elegant way to fine tune the quantity of available mRNA transcripts for translation into proteins, thus adding a layer of complexity to post-transcriptional gene regulation. Gene/genome duplica- tion and alternative splicing are not mutually exclusive events, but instead are critical components of gene regulation, and thus, organismal complexity and development.
This thesis relies upon comparative genomics to understand how particular aspects of gene/genome duplication and alternative splicing have affected gene regulation and is primarily focused on photosynthetic eukaryotes.
1.2.1 Comparative genomics as a research tool
Comparative genomics has become one of the cornerstones of bioinformatic analyses in the post-genomic era (120). Comparative genomics is multifaceted and multi-layered.
Not only is it a foundation for basic genome annotation, it is also the window in which we are able to observe the traces of evolution within and between species, which in turn, permits new insights into the biology and natural history of life.
Given its power and soundness, comparative genomics methodology is used through- out this dissertation from both anintra- andinter-species perspective. First, we exam- ine 5’ upstream regulatory regions of paralogous genes in Arabidopsis thaliana (intra- species comparative genomics in Project I) followed by an investigation of orthologous
and paralogous genes from 27 pyhlogenetically distinct species (inter-species compara- tive genomics in Project II). Both are described in detail in the following sections.
1.3 Aims
1.3.1 Project I – Intra-species comparative genomics in Arabidopsis The primary goal of this project was to ascertain the inter-relationships of different gene components across a large group of paralogous gene pairs that arose from a single polyploidy event millions of years in the past. We will conduct analyses to address the evolution of 5’ upstream regulatory sequences (URSs) versus that of protein coding sequences (CDSs). Furthermore, we will look at how each component (regulatory or coding) dictates expression correlation between paralogs, as well as biological function on a genome-wide scale.
1.3.2 Project II – Inter-species comparative genomics in 27 eukary- otes
In contrast to the above project, here the focus is on the recovery, classification and analysis of the ”full” SR gene repertoire in 27 different eukaryotic species, with emphasis on 12 photosynthetic organisms and the extent of alternative splicing (AS) in the SR genes. Analyses will be performed to answer questions relating to SR gene sub-family expansions or losses in certain lineages, the extent of their AS, and characteristics of their sequence evolution within the context of gene duplication and speciation.
2
Project I Introduction
2.1 Project I – Intra-species comparative genomics in Ara- bidopsis
We begin by providing some background information on Arabidopsis and how it has become the model organism of choice to study basic plant biology.
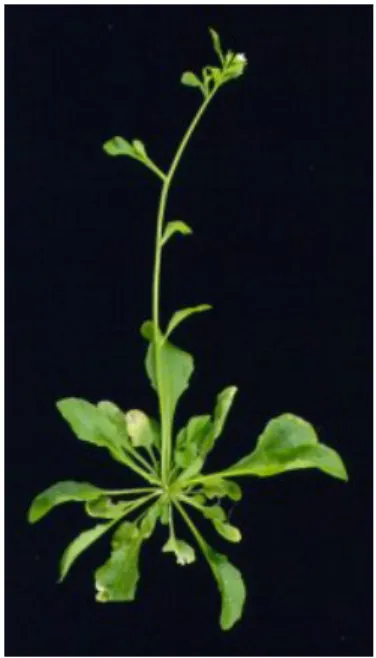
2.1.1 General background information on Arabidopsis thaliana Arabidopsis has become the prominent flowering plant, or angiosperm model to study plant morphogenesis, reproduction, evolution and molecular and cellular biology. Fig- ure 2.1 depicts a photograph of an Arabidopsis adult sporophyte.
Arabidopsis was the first plant genome to be sequenced (54); consequently, it pos- sesses one of the most curated and well-annotated genomes available within the plant kingdom. As with any model organism, Arabidopsis has many characteristics that make it an ideal organism for study:
• it has a short generation time (6 weeks)
• its genome is fully sequenced
• its genome is relatively small (5 chromosomes, 125 MB)
• there is a substantial amount of microarray expression data, and
Figure 2.1: Arabidopsis sporophyte - Wild-type, adult Arabidopsis photo taken from OpenWetWare.
• the fundamental aspects of its genetic evolution and molecular biology can be readily transferred to other, agronomically important crops.
The constantly refined sequence databases of Arabidopsis have permitted researchers to not only employ reverse genetic strategies in their studies, but also allows for the consideration of natural phenomena that have influenced the evolution of its genome.
One important evolutionary force that has played a role in many plant lineages is that of whole genome duplication.
2.1.2 Whole genome duplication and Arabidopsis
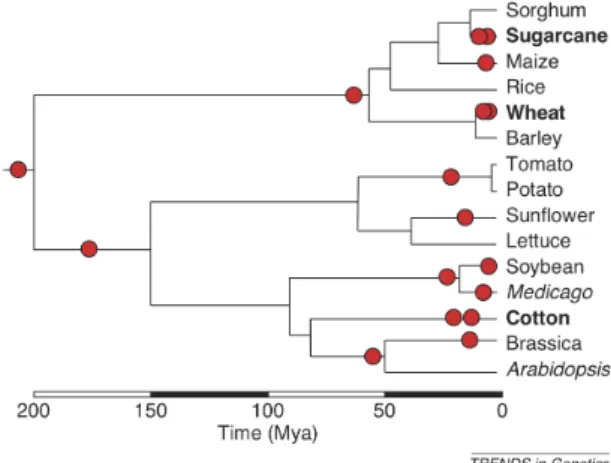
Whole genome duplication (WGD) is a powerful force that has shaped the evolution of many, if not all, eukaryotic genomes. WGD is especially prevalent in the flowering plants, with duplications occurring multiple times throughout multiple lineages (27;
126) (Figure 2.2). WGD has had an important role in the origin and diversification of flowering plants (27) and it is estimated that at least 70% of flowering plants have polyploidy in their history (76). Arabidopsis has experienced at least three WGD events (106; 122), with the most recent WGD event having occurred between 20-60 million years ago (10; 14).
Figure 2.2: Polyploidy in plants- Figure showing the prevalence of polyploidization events (red circles) in selected flowering plants (70).
2.1.2.1 Prior research
Previous studies in Arabidopsis have focused primarily on how duplicated genes di- verged in protein coding sequence (CDS) and expression divergence since the time of duplication. Blanc and Wolfe (2004) showed that gene pairs are not lost randomly over time, but lost according to gene functional biases, where transcription factors and sig- nal transduction proteins were preferentially retained, whereas genes involved in DNA repair were preferentially lost. Furthermore, they reported an asymmetric rate of se- quence evolution in the CDSs of more than 20% of the analyzed pairs (11). Haberer et al. (2004) reported that expression divergence occurs frequently between duplicated gene pairs and may be the primary mechanism behind preserving redundant genes (40).
They also revealed a moderate but significant correlation between promoter sequence similarity and expression divergence for polyploidy derived pairs. Ganko et al. (2007) examined levels of expression divergence between duplicated genes in Arabidopsis and reported that the strength of purifying selection acting on CDSs is coupled to the corresponding pairs expression pattern (35).
2.1.2.2 Limitations and extensions of prior research
Most studies thus far have focused primarily on the properties of coding sequence evolu- tion after duplication, measured in terms of non-synonymous (Ka), synonymous (Ks), or the ratio of non-synonymous to synonymous substitutions (Ka/Ks). However, the
evolution of upstream regulatory sequences (URSs) of duplicated genes has received less attention in Arabidopsis. This is partly due to the inherent difficulty of assessing sequence similarity in non-coding DNA, where the number, order and spacing of shared sequence elements may confound traditional, alignment-based approaches. Addition- ally, the well-defined models for coding sequence substitution rates are not applicable to URSs, which lack the discrete nature of codons. Moreover, the limited number of known in conjunction with the vast number of computationally predicted transcription factor binding sites (TFBSs) for Arabidopsis makes it difficult to recover a meaningful signal from background noise. One of the major public sources for obtaining TFBSs, PLACE (49), is no longer maintained and has not been updated since 2007 (only 409 motifs are readily available from PLACE ).
Previously, Haberer et al. (2004) looked at similarities/dissimilarities in duplicated Arabidopsis promoters using a simple alignment-based approach (40). Here, by using the Shared Motif Method (21), DIALIGN-TX (an improved version of the algorithm used in (21)) (113; 114) and an alignment-free measure of word repetitiveness, (known as the IR (43; 45)) we were able to characterize aspects of Arabidopsis URS similarity in paralogous genes at a more detailed level. Furthermore, the incorporation of positional information on exact matches between paralogous URSs provided insights into URS sequence evolution and expression divergence that raw similarity values simply cannot provide. An evolutionary analysis of the protein coding sequences of the WGD-derived paralogs revealed distinct functional classifications of the duplicates, dependent on whether the URS or CDS is more conserved. Moreover, the joint consideration of URSs and CDSs revealed that different components of a gene experience different selective pressures following gene duplication.
3
Results – Project I
3.1 Similarity profiles of Arabidopsis upstream regulatory sequences (URSs)
After taking several steps to assemble a clean working data set of 815 paralogous URSs (Figure 3.1, and section 8), all of which are assumed to have arisen in a single WGD event between 20-60 million years ago (10), we applied three distinct means to assess similarity between each of the gene pairs: the Index of Repetitiveness (IR) (43; 45), Shared Motif Method (SMM) (21) and DIALIGN-TX (DTX) (113).
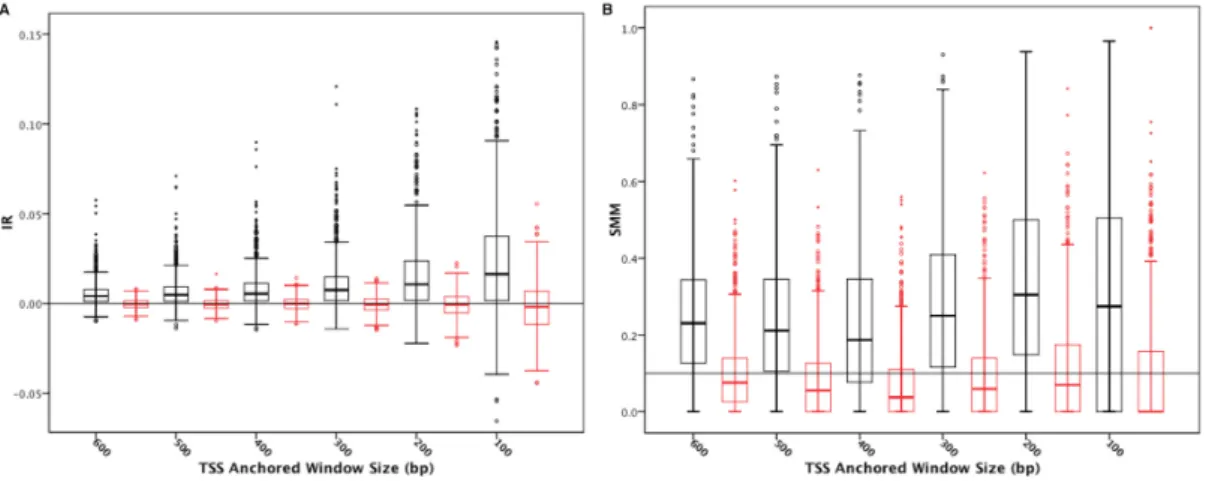
First, we confirmed that the IR and SMM values for the real data (Figure 3.2A and 3.2B, black boxes), as well as the measurements using DTX are significantly different from the randomized data (Figure 3.2A and 3.2B, red boxes; DTX data not shown).
A noticeable property of the IR was that its level of variance depended more heavily on the sequence lengths of analyzed URSs than the SMM. The inter-quartile range (IQR) for the IR values for sequences of length 600 bp was only 20% of the IQR for sequences of length 100 bp. For the SMM, the IQR was almost independent of sequence length. Furthermore, there are many more outliers and extreme values in the real data measured by IR (Figure 3.2A, black boxes) than by the SMM (Figure 3.2B, black boxes), whereas the converse is true for the random data (Figure 3.2A and 3.2B, red boxes). However, in general, median values of conservation for duplicated URSs decrease as the size of the TSS-anchored window increases.
Next, we tried to localize the regions within the URSs that harbor the highest
Figure 3.1: Dataset construction- Brief summary of the steps taken to generate the working data sets for Project I. For more details, the reader is referred to chapter 8.
Figure 3.2: Anchored window analysis - Observed and randomized data (black and red box plots, respectively) for the IR (Panel A) and the SMM (Panel B).
conservation signals. We performed a sliding window analysis with the window size fixed at 200 bp and moving away from the 5’ TSS in 50 bp steps (Figure 3.3).
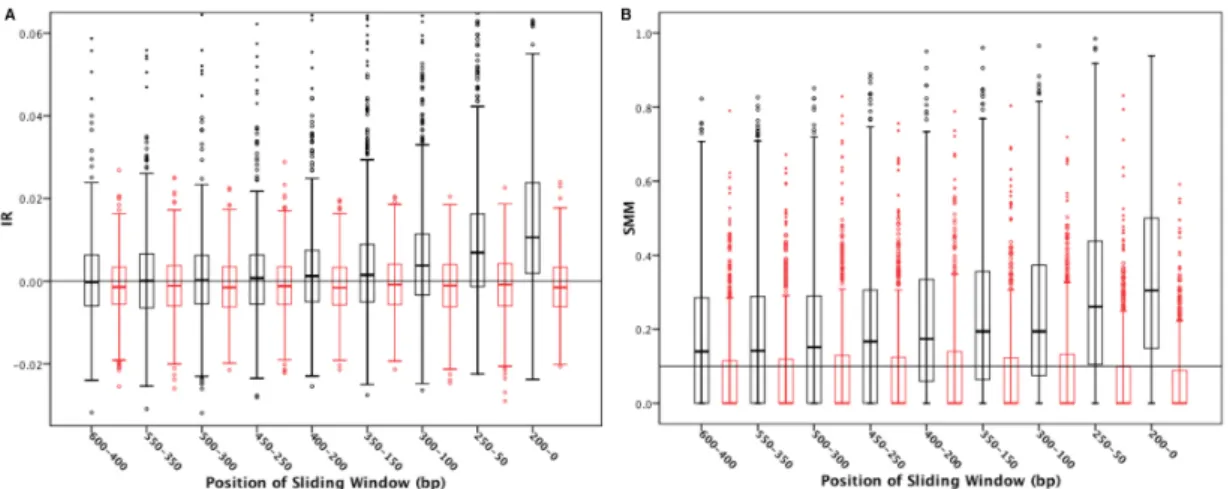
Figure 3.3: Sliding window analysis - Observed and randomized data (black and red box plots, respectively) for the IR (Panel A) and the SMM (Panel B).
Again, similar trends were observed with respect to the behavior of the two meth- ods: all real data values were significantly different from random data (Wilcoxon Signed Ranks test,p <<10−5) and the pattern of outliers was reflective of what was observed in Figure 3.2. Furthermore, note that the variability pattern in the IR and SMM for random data, exhibited fewer outliers for IR and a relatively constant level of variance (Figure 3.3A and 3.3B, red boxes). Nevertheless, despite the qualitative differences in both programs, a distinct pattern emerged with respect to the sliding window analy- sis. Both programs showed a nearly monotonic decrease as distance from the 5 TSS increased. Such a result suggests that most of the conservation signal (sequence simi- larity) is within the first 300 bp upstream of the TSS.
3.2 Inter-relationships between URSs, CDSs and expres- sion correlation
Haberer et al. (2004) found only a marginal correlation (r = 0.12, 0.01 < p < 0.05) between URS similarity and expression correlation in their study of WGD-derived du- plicate pairs in Arabidopsis (40). Therefore, we correlated the IR, SMM and DTX data
compiled in the window analyses (Figures 3.2 and 3.3) with relative levels of gene ex- pression between each gene pair (Table 3.1). We observed highly significant Spearman rank correlations (ρ) between URS similarity and expression correlation (range of cor- relation: 0.159 – 0.277,p << 0.01); in some cases, the correlation was more than twice that previously reported. The IR yielded higher correlations than the SMM, except for the first 100 bp TSS-anchored window. A peak in correlation was observed in the 300 bp window for IR (ρ = 0.277), whereas a bimodality was evident in the 100 bp and 200 bp windows of the SMM (ρ = 0.226). We also calculated the correlation between all three programs. In agreement with our observation that most of the conservation signal was found in the immediate upstream region of about 300 bp, we also observed that the three methods were most highly correlated at smaller window sizes (last three rows of Table 3.1).
Table 3.1: Spearman rank correlations in the anchored window
Anchored Window IR-EC SMM-EC DTX-EC IR-SMM IR-DTX SMM-DTX
600 0.222 0.159 0.158 0.451 0.251 0.391
500 0.228 0.169 0.153 0.471 0.273 0.401
400 0.247 0.192 0.191 0.510 0.269 0.437
300 0.277 0.207 0.175 0.525 0.295 0.388
200 0.252 0.226 0.178 0.582 0.313 0.412
100 0.214 0.226 0.097 0.619 0.292 0.380
Spearman rank correlations for the 815 pairs of URS regions, as well as inter-application correlations. All values for the anchored window URS regions are significant at the 1%
level. A single asterisk denotes significance at the 0.05 level. IR, Index of Repetitiveness;
SMM, Shared Motif Method; DTX, DIALIGN-TX; EC, expression correlation.
Table 3.2: Spearman rank correlations in the sliding window
Sliding Window IR-EC SMM-EC DTX-EC IR-SMM IR-DTX SMM-DTX
400-600 0.059 0.059 0.021 0.287 0.016 0.188
350-550 0.049 0.074* 0.022 0.261 -0.016 0.225
300-500 0.064 0.042 0.034 0.308 -0.044 0.165
250-450 0.094 0.036 0.040 0.265 0.019 0.190
200-400 0.121 0.063 0.041 0.329 0.065 0.209
Continued. . .
Sliding Window IR-EC SMM-EC DTX-EC IR-SMM IR-DTX SMM-DTX
150-350 0.190 0.085* 0.042 0.356 0.115 0.217
100-300 0.217 0.150 0.079 0.431 0.139 0.299
50-250 0.257 0.198 0.108 0.472 0.232 0.316
0-200 0.253 0.226 0.170 0.582 0.314 0.404
Spearman rank correlations for the 815 pairs of URS regions, as well as inter-application correlations. Values in bold for the sliding window URS regions are significant at the 1%
level. A single asterisk denotes significance at the 0.05 level. IR, Index of Repetitiveness;
SMM, Shared Motif Method; DTX, DIALIGN-TX; EC, expression correlation.
We also correlated the data from the sliding window analysis with expression cor- relation (Table 3.2). The pattern in correlation mirrors that of what was observed for URS conservation in Figure 3.3; that is, increasing distance from the 5 TSS translates not only into a reduced level of sequence conservation but also into a reduced correla- tion with expression. Considering only the windows that had correlations significant at the 1% level (bold values in Table 3.2), all programs reported high correlations with EC within the three sliding windows most proximal to the 5’ TSS. The same pattern was evident in terms of the inter-application correlations reported for the anchored window analysis: the closer to the 5’ TSS, the more congruent the methods were.
Note that In both the anchored window and sliding window analyses, the IR and the SMM yielded higher correlation values with EC than DTX. Additionally, the inter- program correlation values were higher between the IR and the SMM than either was with DTX.
3.2.1 Substitution rates of CDS and their relationship with EC As our focus was not solely on the contribution of the URS to EC, we also measured properties of the coding sequences, such as sequence identity, synonymous (Ks) and non-synonymous (Ka) substitution rates and their ratio (Ka/Ks) (Table 3.3). Se- quences were carefully aligned using the amino acid sequences of the respective gene pairs as a backbone to aid in the construction of the DNA coding sequence alignment (see chapter 8 for specifics).
Table 3.3: Spearman rank correlations for coding sequences
Coding Seq. Property EC Identity (protein) 0.157
Ks 0.032
Ka -0.185
Ka/Ks -0.213
Ti/Tv −0.132
∆ Length -0.150
Spearman rank correlations for coding sequence characteristics. Values in bold indicate significance at the 0.01 level.
A marginal but significant positive correlation was observed between protein se- quence identity and expression correlation (Table 3.2). In complete agreement with this result, we also observed a significant negative correlation between expression cor- relation and the rate of non-synonymous substitutions, Ka. On the other hand, no correlation was found between expression correlation and the rate of synonymous sub- stitutions, Ks. Also, the transition to transversion ratio (Ti/Tv) and the difference in length between duplicate pairs exhibited a significantly negative correlation. Taken together, there is concomitant functional constraint on the protein and its expression profile, as evidenced by the significantly negative correlation between expression cor- relation and Ka/Ks. Markedly, no significant correlation was observed between any of the URS windows and any evolutionary property of the coding sequences listed in Table 3.2 (data not shown).
3.3 Micro-chromosomal rearrangements of exact matches
Since similarity values alone do not encompass the entire range of sequence evolution, we analyzed the 300 bp URSs using the positional information and lengths of exact matches (7-19 bp) between these sequences. We analyzed the whole data set, gene pairs in the upper 25% and lower 25% quantiles based on EC. We considered four mutually exclusive arrangement classes for the type of exact matches that can occur:
proximal exact matches (pem), distal exact matches (dem), inverse proximal exact matches (ipem) and inverse distal exact matches (idem) (Figure 3.4)
Figure 3.4: Distribution of exact match arrangement classes in all gene pairs - The four mutually exclusive arrangement classes are indicated by color. The solid black rectangle indicates the location of the exact match in the query. The large black brackets indicate the boundaries that define what we consider in this work to be ”proximal”. Pem, proximal exact match; dem, distal exact match; ipem, inverse proximal exact match; idem, inverse distal exact match.
Pem and ipem are defined as an exact match in the query sequence that is located within the subject sequence constrained by ±30 bp boundaries (blue and green boxes in Figure 3.4), whereas dem and idem are exact matches that are located outside of these boundaries (red and purple boxes in Figure 3.4).
We observed that as the length of the exact match increases, there is concordant increase and decrease in the fraction of pem and idem (blue and purple lines, Figure 3.5. By contrast, the fraction of ipem and dem (red and green lines) remained relatively constant as length increased.
Figure 3.5: Distribution of exact matches into the four arrangement classes for all gene pairs - The four mutually exclusive arrangement classes are indicated by color. Pem, proximal exact match; dem, distal exact match; ipem, inverse proximal exact match; idem, inverse distal exact match.
A similar pattern was reflected in the upper 25% EC quantile gene pairs (Figure 3.6).
Figure 3.6: Distribution of exact matches into the four arrangement classes for gene pairs in the upper 25% EC quantile - The four mutually exclusive arrangement classes are indicated by color. Pem, proximal exact match; dem, distal exact match; ipem, inverse proximal exact match; idem, inverse distal exact match.
However, a distinctly different pattern emerged in the lower 25% EC quantile gene pairs Figure 3.7. Here, as length increased, the fraction of pem and dem decreased and increased, respectively. Also with increased length, the fraction of idem (purple line) was higher for the first three length categories.
Figure 3.7: Distribution of exact matches into the four arrangement classes for gene pairs in the lower 25% EC quantile - The four mutually exclusive arrangement classes are indicated by color. Pem, proximal exact match; dem, distal exact match; ipem, inverse proximal exact match; idem, inverse distal exact match.
3.4 Three-way rank analysis
To understand what kind of gene functional biases result as a consequence of URS and CDS evolution within the context of expression correlation, we performed a joint rank analysis of three variables: the IR of the 300 bp anchored URS window,Kaof the CDS and the EC of the duplicate pairs. For each variable there were three equally populated classes (n= 245): high conservation, middle conservation and low conservation (Table 3.4).
Table 3.4: Rank classifications
low middle high
IR -0.014-0.004 0.004-0.012 0.012-0.123 Ka 0.159-2.221 0.103-0.159 0.000-0.103 EC -0.578-0.273 0.273-0.499 0.500-0.958
A total of 735 gene pairs (after excluding pairs withKs>1.5) were ranked for the IR,Ka and expression correlation values. For each variable, the ranks were split into three equal classes (n= 245): low ranks, middle ranks and high ranks. The table presents the ranges of raw values for each of the variables for each rank class.
Of the 27 possible combinations for each rank class, we focused on two specific categories: those gene pairs that fell into high rank categories for IR and expression correlation but had low Ka ranks (26 pairs) and a second grouping that included high rank categories for Ka and expression correlation but low IR ranks (36 pairs). We checked for overrepresented GO slim terms using the web interface at AmiGO (20) for each of these data sets. The enriched molecular function terms for the gene pairs with high ranked Ka and expression correlation but low ranked IR values are reported in Table 3.5.
Interestingly, about half of the genes in this rank grouping are associated with tran- scription regulator activity (GO:0030528), transcription factor activity (GO:0003700) or DNA binding (GO:0003677) (first three rows in Table 3.5). In contrast, the rank grouping with high ranked Ka and expression correlation but low ranked IR values have completely different functional biases (Table 3.6).
Table3.5:GOtermenrichmentinhighIRbutlowKarankedgenepairs GOTermDescriptionP-valueSamplefrequencyBackgroundfrequency GO:0030528transcriptionregulatoractivity4.30E-2737/73(50.7%)1813/32333(5.6%) GO:0003700transcriptionfactoractivity1.72E-2333/73(45.2%)1659/32333(5.1%) GO:0003677DNAbinding1.17E-2235/73(47.9%)2083/32333(6.4%) GO:0003676nucleicacidbinding1.23E-1636/73(49.3%)3437/32333(10.6%) GO:0005488binding4.57E-0837/73(50.7%)7006/32333(21.7%) GO:0016563transcriptionactivatoractivity9.27E-054/73(5.5%)104/32333(0.3%) GO:0004568chitinaseactivity4.50E-042/73(2.7%)14/32333(0.0%) GO:0008308voltage-gatedanionchannelactivity4.50E-042/73(2.7%)14/32333(0.0%) GO:0005253anionchannelactivity5.18E-042/73(2.7%)15/32333(0.0%) GO:0009982pseudouridinesynthaseactivity6.69E-042/73(2.7%)17/32333(0.1%) GO:0016564transcriptionrepressoractivity2.10E-032/73(2.7%)30/32333(0.1%) GO:0004693cyclin-dependentproteinkinaseactivity2.39E-032/73(2.7%)32/32333(0.1%) GO:0000156two-componentresponseregulatoractivity2.85E-032/73(2.7%)35/32333(0.1%) GO:0022832voltage-gatedchannelactivity3.18E-032/73(2.7%)37/32333(0.1%) GO:0005244voltage-gatedionchannelactivity3.18E-032/73(2.7%)37/32333(0.1%) GO:0016866intramoleculartransferaseactivity4.88E-032/73(2.7%)46/32333(0.1%) GO:0022836gatedchannelactivity7.92E-032/73(2.7%)59/32333(0.2%) MolecularFunctionGOtermsforgenepairswithdivergentcodingsequencesbutconservedupstreamsequencesandexpression correlation
Table3.6:GOtermenrichmentinlowIRbuthighKarankedgenepairs GOTermDescriptionP-valueSamplefrequencyBackgroundfrequency GO:0016835carbon-oxygenlyaseactivity1.46E-065/52(9.6%)120/32333(0.4%) GO:00086763-deoxy-8-phosphooctulonate synthaseactivity2.54E-062/52(3.8%)2/32333(0.0%) GO:0051002ligaseactivity,forming nitrogen-metalbonds7.60E-062/52(3.8%)3/32333(0.0%) GO:0051003ligaseactivity,forming nitrogen-metalbonds,form- ingcoordinationcomplexes
7.60E-062/52(3.8%)3/32333(0.0%) GO:0010280UDP-L-rhamnosesynthase activity7.60E-062/52(3.8%)3/32333(0.0%) GO:0016851magnesiumchelataseactivity7.60E-062/52(3.8%)3/32333(0.0%) GO:0005198structuralmoleculeactivity8.68E-067/52(13.5%)460/32333(1.4%) GO:0016857racemaseandepimeraseactiv- ity,actingoncarbohydrates andderivatives
1.25E-053/52(5.8%)28/32333(0.1%) GO:0016854racemaseandepimeraseactiv- ity2.07E-053/52(5.8%)33/32333(0.1%) GO:0003978UDP-glucose4-epimeraseac- tivity2.53E-052/52(3.8%)5/32333(0.0%) GO:0004739pyruvatedehydrogenase (acetyl-transferring)activity3.79E-052/52(3.8%)6/32333(0.0%) GO:0004738pyruvatedehydrogenaseac- tivity3.79E-052/52(3.8%)6/32333(0.0%) GO:0004386helicaseactivity6.93E-054/52(7.7%)136/32333(0.4%) GO:0016829lyaseactivity8.61E-055/52(9.6%)279/32333(0.9%) GO:0003824catalyticactivity1.77E-0422/52(42.3%)6410/32333(19.8%) Continued...
GOTermDescriptionP-valueSamplefrequencyBackgroundfrequency GO:0016624oxidoreductaseactivity,act- ingonthealdehydeoroxo groupofdonors,disulfideas acceptor
1.96E-042/52(3.8%)13/32333(0.0%) GO:0016836hydro-lyaseactivity1.99E-043/52(5.8%)70/32333(0.2%) GO:0003735structuralconstituentofribo- some3.00E-045/52(9.6%)365/32333(1.1%) GO:0004089carbonatedehydrataseactiv- ity3.40E-042/52(3.8%)17/32333(0.1%) GO:0003724RNAhelicaseactivity3.82E-042/52(3.8%)18/32333(0.1%) GO:0017111nucleoside-triphosphataseac- tivity7.67E-045/52(9.6%)449/32333(1.4%) GO:0030570pectatelyaseactivity8.04E-042/52(3.8%)26/32333(0.1%) GO:0016837carbon-oxygenlyaseactivity, actingonpolysaccharides8.04E-042/52(3.8%)26/32333(0.1%) GO:0016462pyrophosphataseactivity9.41E-045/52(9.6%)470/32333(1.5%) GO:0016818hydrolaseactivity,act- ingonacidanhydrides, inphosphorus-containing anhydrides
9.50E-045/52(9.6%)471/32333(1.5%) GO:0016817hydrolaseactivity,actingon acidanhydrides9.50E-045/52(9.6%)471/32333(1.5%) GO:0008374O-acyltransferaseactivity1.00E-032/52(3.8%)29/32333(0.1%) GO:0005200structuralconstituentofcy- toskeleton1.07E-032/52(3.8%)30/32333(0.1%) GO:0016853isomeraseactivity3.31E-033/52(5.8%)185/32333(0.6%) Continued...
GOTermDescriptionP-valueSamplefrequencyBackgroundfrequency GO:0016903oxidoreductaseactivity,act- ingonthealdehydeoroxo groupofdonors
4.09E-032/52(3.8%)59/32333(0.2%) GO:0046983proteindimerizationactivity4.95E-032/52(3.8%)65/32333(0.2%) GO:0008026ATP-dependenthelicaseac- tivity8.13E-032/52(3.8%)84/32333(0.3%) GO:0070035purineNTP-dependentheli- caseactivity8.13E-032/52(3.8%)84/32333(0.3%) MolecularfunctionGOtermsforgenepairswithdivergentupstreamsequencesbutconservedcodingsequencesandexpression correlation.