Review article:
TOWARDS UNDERSTANDING AROMATASE INHIBITORY ACTIVITY VIA QSAR MODELING
Watshara Shoombuatong, Nalini Schaduangrat, Chanin Nantasenamat
*Center of Data Mining and Biomedical Informatics, Faculty of Medical Technology, Mahidol University, Bangkok 10700, Thailand
* Corresponding author: E-mail: chanin.nan@mahidol.edu (C.N.);
Phone: +66 2 441 4371; Fax: +66 2 441 4380
http://dx.doi.org/10.17179/excli2018-1417
This is an Open Access article distributed under the terms of the Creative Commons Attribution License (http://creativecommons.org/licenses/by/4.0/).
ABSTRACT
Aromatase is a rate-limiting enzyme for estrogen biosynthesis that is overproduced in breast cancer tissue. To block the growth of breast tumors, aromatase inhibitors (AIs) are employed to bind and inhibit aromatase in order to lower the amount of estrogen produced in the body. Although a number of synthetic aromatase inhibitors have been released for clinical use in the treatment of hormone-receptor positive breast cancer, these inhibitors may lead to undesirable side effects (e.g. increased rash, diarrhea and vomiting; effects on the bone, brain and heart) and therefore, the search for novel AIs continues. Over the past decades, there has been an intense effort in em- ploying medicinal chemistry and quantitative structure-activity relationship (QSAR) to shed light on the mecha- nistic basis of aromatase inhibition. To the best of our knowledge, this article constitutes the first comprehensive review of all QSAR studies of both steroidal and non-steroidal AIs that have been published in the field. Herein, we summarize the experimental setup of these studies as well as summarizing the key features that are pertinent for robust aromatase inhibition.
Keywords: aromatase, aromatase inhibitors, breast cancer, estrogen, QSAR, structure-activity relationship, data mining
INTRODUCTION
Breast cancer is one of the leading causes of death worldwide, with a greater prevalence in developed countries and a rapidly growing health concern in developing countries. It is also the most frequently occurring cancer found in women with an estimated 1.5 million new cases resulting in 570,000 deaths in 2015 (WHO, 2015). In addition, the prevalence of breast cancer in Asia is the highest among the world population (59 % of world population), out of which new cases account for 39 % with 44 % of cases resulting in deaths. In compar- ison, the prevalence of breast cancer in the
continents of North America and Africa rep- resent 5 % and 15 % of the world statistics, respectively (American Cancer Society, 2015).
Estrogen is the primary female sex hor-
mone that acts as a double-edged sword
where on one side it regulates important phys-
iological functions for sustaining life (i.e. reg-
ulating the menstrual cycle, modulating bone
density, maintenance of vessels and skin etc.)
while on the other side, it is implicated in the
development of breast cancer. Estrogen bio-
synthesis is catalyzed by aromatase, which
converts androstenedione, a 19-carbon (C
19)
steroid hormone, to estrone (E1) via a three-
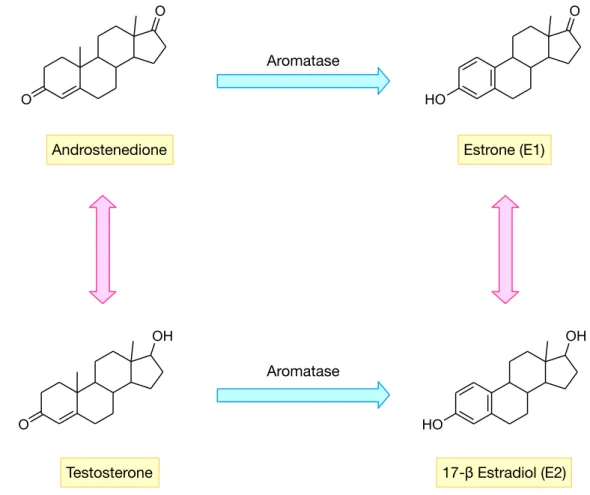
step A-ring aromatization. Aromatase also catalyzes the oxidation of testosterone, which is also then converted to estradiol (E2) (Ah- mad and Shagufta, 2015) (Figure 1).
A common treatment for early-stage, hor- mone-sensitive breast cancer is surgery fol- lowed by radiotherapy. Furthermore, adju- vant endocrine therapy is given with or with- out chemotherapy depending on the tumor stage. In pre-menopausal women, most of the estrogen are made in the ovaries with the up- take of androstenedione from the circulation (Nelson and Bulun, 2001). Ovaries can con- vert androstenedione to estrone via the cata- lytic activity of aromatase, which is then transported to breast cells. However, in post- menopausal women, the main site of estrogen production are the breasts. As for the latter, the level of estrogens produced in the breast are comparable to that produced in the ovaries by pre-menopausal women, which is four to six times higher than those found in serum.
Approximately 60 % of pre-menopausal and 75 % of post-menopausal cancers are hor- mone-dependent (Russo et al., 2003), imply- ing that endogenous estrogens are essentially required for proliferation. Many drugs that are used for the treatment of estrogen receptor- positive breast cancer are mechanistically based on the interference of either the estro- gen production or the estrogen action.
Aromatase, also known as estrogen syn- thase or CYP19A1, is part of the cytochrome P450 family. It is consisting of 503 amino- acid residues spanning twelve α-helices and ten β-strands, inside which a heme cofactor is coordinated by a cysteine residue at position 437 (Ghosh et al., 2009). Aromatase is the major producer of estrogen in post-menopau- sal women and it catalyzes the rate-limiting step for converting androgens to estrogens (Simpson, 1994). As aromatase catalyzes the biosynthesis of estrogen from androgens, thus the inhibition of aromatase activity has be-
Figure 1: Summary of estrogen biosynthesis pathway as mediated by aromatase.
O
O
OH
O
O
HO
OH
HO Androstenedione
Testosterone
Estrone (E1)
17-β Estradiol (E2) Aromatase
Aromatase
come the standard treatment for hormone-de- pendent breast cancers in women (Eisen et al., 2008). Aromatase is located in the plasma membrane of the endoplasmic reticulum of estrogen producing cells and plays a role in development, reproduction, sexual different- iation and behavior as well as in bone and li- pid metabolism, brain functions and diseases such as breast and testicular tumors. Hence, in order to block the estrogen production, it is necessary to inhibit the aromatase enzyme that is responsible for its synthesis by using aromatase inhibitors (AIs). AIs constitute the front-line therapy for estrogen-dependent breast cancers. For this reason, inhibiting this terminal step in the estradiol biosynthesis pathway is considered to be a specific and therefore, a preferable strategy.
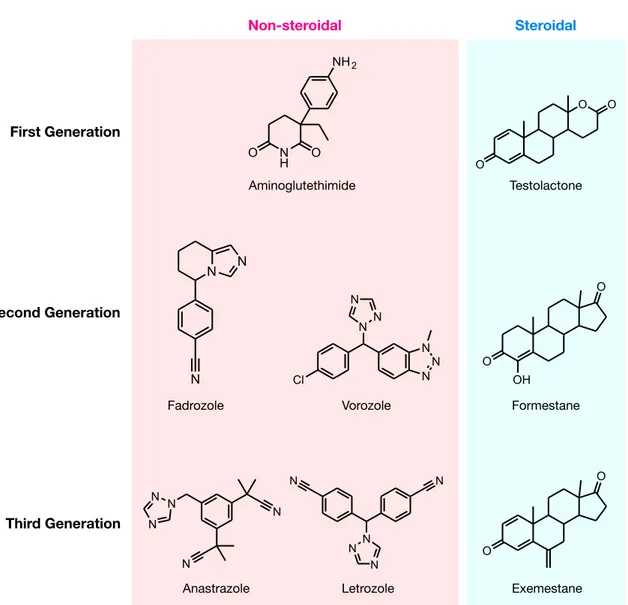
AROMATASE INHIBITORS To date, there are three generations of FDA-approved AIs available for inhibiting the activity of aromatase. The first-generation of AIs includes aminoglutethimide, which is marketed in the late 1970s (Santen et al., 1978, 1982; Santen and Misbin, 1981; Graves and Salhanick, 1979) (Figure 2), a derivative of the sedative agent glutethimide that was in- itially introduced as an anticonvulsant. How- ever, due to its adverse effects, such as high toxicity and lack of selectivity (Demers et al., 1987; Hughes and Burley, 1970), this AI was found to interfere with other CYP450 en- zymes involved in cortisol and aldosterone bi- osynthesis (Santen et al., 1980). Thus, amino- glutethimide was withdrawn from the market.
In addition, testolactone was the first-genera- tion steroidal AI that was used to treat ad- vanced-stage breast cancers, albeit with weak potency (Avendaño and Menéndez, 2008).
Nevertheless, these first-generation AIs served as the prototype for future generations with an emphasis on developing more potent drugs with higher selectivity and reduced tox- icity. Continuing on to the second-generation, fadrozole, which contains an imidazole group (Bonnefoi et al., 1996), is more selective and potent than aminoglutethimide. Nevertheless,
it still displayed effects on aldosterone, pro- gesterone and corticosterone biosynthesis.
Formestane (Brueggemeier et al., 2005), a steroidal analogue, was the first selective AI to reach clinical trials in the 1990s. It was demonstrated to be effective and was well tol- erated (Dowsett and Lloyd, 1990). However, formestane exhibited poor oral bioactivity and had to be administered bi-weekly and thus, lost popularity with the discovery of the newer, more effective third-generation AIs (DrugBank, 2013).
Finally, the third-generation of AIs, are comprised of triazole derivatives, anastrozole and letrozole and one steroidal analogue, ex- emestane (Dutta and Pant, 2008). These AIs displayed improved efficacy and lower tox- icity as compared with the estrogen antago- nist, tamoxifen, in both early and advanced breast cancer (Thürlimann et al., 2004). For this reason, the last generation of AIs has been recommended by the FDA as first-line drugs for the therapy of breast carcinoma. Anastro- zole and letrozole, are non-steroidal deriva- tives and competitive inhibitors of andros- tenedione. Both contain a triazole group that can interact with the prosthetic heme group of aromatase. Exemestane is a steroidal analog of androstenedione thus, permanently binding to the enzyme and deactivating its catalytic activity (Coombes et al., 2007).
Initial attempts to clarify the interaction mechanism of aromatase and its inhibitors have relied on the use of homology-derived models (Loge et al., 2005). Such studies have focused on clinically used AIs such as fadro- zole, letrozole and exemestane as well as other natural products such as ligands, flavo- noids and coumestrol (Karkola and Wähälä, 2009; Paoletta et al., 2008; Awasthi et al., 2015; Worachartcheewan et al., 2014b;
Nantasenamat et al., 2014).
Since the crystal structure of human pla-
cental aromatase has been solved by Ghosh et
al. (2009), the availability of structural details
on the active site of aromatase helps in under-
standing of the binding characteristics of AIs
as well as the evaluation of key reactions
needed in the mechanism of aromatase.
Figure 2: Chemical structures of the three generations of FDA-approved aromatase inhibitors.
This has opened up a plethora of opportu- nities by enabling the understanding of the molecular basis for the specificity of the aro- matase enzyme and its unique catalytic mech- anisms, which is imperative for the develop- ment of the next-generation of AIs.
CONCEPTS OF QSAR MODELING Quantitative structure-activity relation- ship (QSAR) (Nantasenamat et al. 2009, 2010) is a ligand-based approach that seeks to discern the mathematical relationship be- tween chemical structures (i.e. as described by various types of molecular descriptors) and the investigated biological activity through the use of statistical and machine learning
Historically, the work of Cros (1863), Crum Brown and Fraser (1868) and especially that of Muir et al. (1949) laid the foundations for the subsequent birth of QSAR as formally introduced by Hansch and Fujita (1964) in their landmark work investigating substituent effects of various compounds against various biological activities (i.e. benzoic acids against mosquito larvae, phenols against gram-posi- tive and gram-negative bacteria, phenyl ethyl phosphate insecticides against houseflies, thyroxine derivatives against rodents, diethyl- aminoethyl benzoates against guinea pigs and carcinogenic compounds against mice) by uti- lizing substituent constants as descriptors.
Ever since, QSAR had been an integral part of
O N H O
NH2
FirstGeneration
Aminoglutethimide
O O
O
Testolactone
Second Generation
N N
N Fadrozole
N Cl
N N
N
N
N O
O
OH
Vorozole Formestane
Third Generation N
N N
N
N
N N
N N N
O
O
Anastrazole Letrozole Exemestane
Non-steroidal Steroidal
been utilized to probe the underlying mecha- nistic basis of various biological activities (Nantasenamat and Prachayasittikul, 2015).
Recently, Fujita and Winkler (2016) had shared their perspectives on the two QSAR worlds consisting of (i) classical QSAR and (ii) modern QSAR.
The early years of classical QSAR entails investigation on the structure-activity rela- tionship of a congeneric set of compounds (i.e. compounds sharing a common chemical scaffold or chemotype) through the use of a few molecular descriptors. Classical QSAR methodology (Hansch et al., 1963) assumes that the biological activity of investigated chemicals can be explained by simple and in- terpretable physicochemical properties.
These physicochemical properties encode structural features that are considered to be statistically important and that can provide useful insights and understanding pertaining to the interaction being studied. Typically, classical QSAR models are built using partial least-squares (PLS) and multiple linear re- gression (MLR). It should be noted that this approach does not take into consideration the 3D structure of the receptor-ligand interac- tion. Thus, this had inspired the development of a 3D-QSAR technique by Cramer et al.
(1988) that essentially involves the alignment of a congeneric set of compounds (i.e. com- pounds sharing a common scaffold or chemo- type) and followed by the computation of mo- lecular fields (steric and electrostatic). Fur- thermore, modifications to the CoMFA con- cept known as comparative molecular simi- larity indices analysis (CoMSIA) was pro- posed by Klebe et al. (1994) to extend CoMFA via the utilization of Gaussian poten- tials as the basis for calculating similarity and thus, expand its applicability (Kubinyi, 1997).
Over the years, advancements in compu- tation has given rise to modern QSAR in which an extensive list of molecular de- scriptors as well as a wide range of machine learning algorithms can be applied in studying the structure-activity relationship of large sets of heterogeneous and chemically diverse set of compounds. On one end, modern QSAR
makes it possible to harness the big data of bi- oactivity information accumulated over the years for model development while on the other end, the resulting models are often com- plex and not readily comprehensible to bench scientists. The need for simple and interpreta- ble QSAR models along with best practices has been discussed in a recent book chapter (Shoombuatong et al., 2017). Briefly, desira- ble characteristics of robust QSAR models have been set forth by the Organisation for Economic Co-operation and Development (OECD) as to encourage the utilization of QSAR models for regulatory purposes. These main OECD principles for the development of robust QSAR models are summarized in Ta- ble 1.
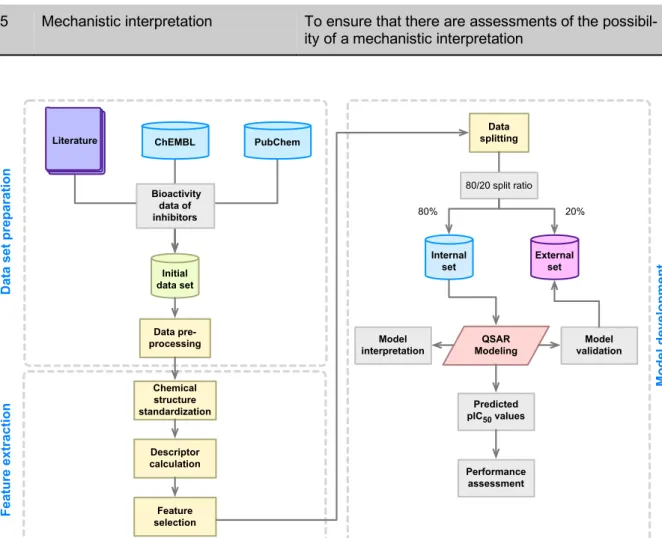
The typical workflow for the development
of QSAR models is depicted in Figure 3. First,
the QSAR modeling process starts by the
compilation of a data set that entails collect-
ing information pertaining to the compound
name along with their SMILES notation, bio-
activity values (e.g. IC
50, EC
50, K
i, % activ-
ity, etc.) as well as reference to the original
paper. Second, the data set is subjected to data
pre-processing as to ensure the completeness
of the data and that there are no missing infor-
mation or misspellings. Third, chemical struc-
tures are drawn and subjected to structure
standardization as to remove salts, ensure ap-
propriate charge of functional moieties, select
appropriate tautomeric structures, etc. Fourth,
molecular descriptors are computed as to pro-
vide quantitative description of chemical
structures and this is followed by feature se-
lection as to remove useless and/or collinear
variables. Fifth, the curated data set is em-
ployed for model construction via the use of
machine learning algorithms and this entails
data splitting, data balancing, data validation,
model validation and performance assess-
ment. Finally, the resulting model is subjected
to scrutiny on the feature importance as to
identify key features contributing to the origin
of the biological activity. Summary and
guidelines pertaining to the best practices for
QSAR model development has been de-
scribed previously (Tropsha, 2010).
Table 1: The OECD principle guidelines for developing and validating QSAR model.
# OECD principle Description
1 Defined endpoint To ensure that all endpoint values, within a given da- taset, are consistent
2 Unambiguous algorithm To ensure the ability of transparency and reproduci- bility in the proposed QSAR model
3 Defined domain of applicability To define how robust, significant and validated QSAR model could be
4 Appropriate measures of goodness-
of-fit, robustness and predictivity To simplify the overall criteria of model validation: the internal performance of a model and the predictivity or predictive power of model
5 Mechanistic interpretation To ensure that there are assessments of the possibil- ity of a mechanistic interpretation
Figure 3: General workflow of QSAR model development.
Since then, the breadth of available mo- lecular descriptors have expanded to encom- pass a wide range of descriptors spanning one to several dimensions. Such descriptors may account for the general features of a molecule
or may consider the fine details of a molecule down to its atomic constitution. A summary of common molecular descriptors (along with its description) used in QSAR models of AIs is provided in Table 2.
ChEMBL
Bioactivity data of inhibitors
Initial data set
Literature PubChem
Data pre- processing
Chemical structure standardization
Descriptor calculation
Feature selection
Data splitting
QSAR Modeling 80/20 split ratio
External set Internal
set
80% 20%
Feature extraction Model development
Model validation
Predicted pIC50 values
Performance assessment Model
interpretation
Data set preparation
Table 2: Summary of common classes of molecular descriptors.
Descriptor class Description References
Molecular field Steric and electrostatic properties of a mole- cule as derived from the superimposition of molecules in CoMFA analysis
Cramer et al., 1988
Molecular similarity indices Descriptors as used in CoMSIA that are computed from Steric and Electrostatic ALignment (SEAL) similarity fields as to generate steric, electrostatic, hydrophobic, and hydrogen bonding descriptors
Kubinyi et al., 1998
Molecular surface As implemented in CoMSA, descriptors are derived from Coulomb electrostatic potential on the molecular surface
Polanski and Gieleciak, 2003
Multivariate image analysis Pixels derived from 2D image of chemical
structures Barigye et al., 2018
Physicochemical Pertains to various 1D-3D chemical and physical properties of a molecule
Todeschini and Consonni, 2000 Pharmacophore mapping A 4D-QSAR approach coupled to self-organ-
izing map that entails the incorporation of conformational freedom into 3D-QSAR model
Bak and Polanski, 2007
Quantum chemical Electronic properties of a molecule as derived from low-energy conformer as computed by quantum mechanical calculation
Karelson et al., 1996
SMILES Atomic and bond constituents of a molecule Worachartcheewan et al., 2014a Spectral Based on 13C NMR spectroscopic data of a
compound that essentially pertains to electro- static and electronic properties as derived from frequencies of quantum mechanical properties of a nuclear magnetic moment
Beger et al., 2004
Machine learning
Machine learning is an implementation of artificial intelligence in which computers can automatically learn from data sets by extract- ing important patterns and making decisions or predictions. A summary of common ma- chine learning algorithms that are used for QSAR modeling along with their strengths and weaknesses are provided in Table 3.
The concepts and in-depth treatment of machine learning is beyond the scope of this review and readers are directed to a previous
comprehensive treatment of the topic (Shoombuatong et al., 2017; van Westen et al., 2011). Herein, we cover common machine learning algorithm that have been used in the study of AI activity.
The simplest learning algorithm is multi-
ple linear regression (MLR) (Aiken et al.,
2003), which is an extension of the simple lin-
ear regression and is used to explain the rela-
tionship between a series of features, X=(𝑥
",
𝑥
#, 𝑥
#,..., 𝑥
$), and output values, Y=(𝑦
", 𝑦
#,
𝑦
#,..., 𝑦
$), as follows:
(1) where 𝑦
&is the output value, 𝑥
&'is repre- sented a data for i
thcompound and j
thde- scriptor of i
thcompound and is the coeffi- cient parameter.
Partial least squares regression (PLS).
This method is a well-known method for con- structing predictive models when features or descriptors have inter-correlated latent varia- bles (Helland, 1988; Helland, 2001). PLS is closely related to principal component analy- sis (PCA) that consists of matrix decomposi- tion into a matrix of eigenvectors and a matrix of its loadings factors. Given a dataset 𝑋
$×*with N rows and M columns, the general ap- proach can be written as follows:
(2) This is equivalent to a reduction of an M- dimensional variable space to an A-dimen- sional space. The variables in dimension A are also called latent variables.
The matrix T contains orthogonal column vectors, also called score vectors, that repre- sents the latent variables.
Artificial neural network (ANN). This method is a computation-based method in- spired by networks of biological neurons in the human brain (Puri et al., 2016). Basically, there are 3 different layers in the architecture of ANN: input layer (the input (X) is fed into the model through this layer), hidden layers (in general, there can be more than one hidden layers which utilizes some method to operate X and deliver to an output layer) and output layer (the data after processing is made avail- able at the output layer).
Support vector machine (SVM). This sta- tistical learning approach is based on the prin- ciples of structure-risk minimization and ker- nel method as proposed by Cortes and Vapnik (1995), which are used to construct a maxi- mum-margin-separating hyperplane. The main advantage of SVM model is to seek the best compromise between the computational cost and the prediction error as to obtain the optimum generalization ability. SVM can be categorized as support vector classification (SVC) and support vector regression (SVR) (Cortes and Vapnik, 1995; Smola and Schölk- opf, 2004). The principle idea of this method is to transform an input space with m-dimen-
Table 3: Summary of the strength and weakness of the machine-learning algorithms for performing QSAR modeling discussed in this review.
Factor MLR PLS ANN SVM DT RF
Non-linear ü ü ü ü
Classification and regression ü ü ü ü ü ü
Prediction error High Medium Low Low Medium Low
Computational cost Low Medium Medium Medium Medium High
Memory requirements Low Medium Low Low Medium Medium
Overfitting ü ü ü
Dimension reduction ü ü ü ü
Easy to interpret ü ü ü ü
MLR: multiple linear regression, PLS: partial least squares regression, ANN: artificial neural network, SVM: support vector machine, DT: decision tree, RF: random forest
0 1
b b +
= å
= ij
N i
i
i
x
y
b
iM N M A A N M
N
X P X
X
´=
´ ´+
´sional vector into a feature space with n-di- mensional vector where m < n, and select a separating hyperplane giving the largest dis- tance between the two classes.
Decision tree (DT). This machine learning technique is used for finding and describing a dataset (X,Y) with tree representation or struc- ture (Safavian and Landgrebe, 1991). The tree is composed of a root node, a set of internal nodes, and a set of terminal nodes (leaves).
This method is one of well-known built-in feature selector. The main purpose of using DT is to achieve a more concise and transpar- ency of the model to identify the relationship between X and Y variables.
Random forest (RF). This ensemble learn- ing method essentially integrates many clas- sification and regression trees (CART).
Breiman (2001) developed the RF method by growing many weak decision trees for en- hancing the prediction performance of CART.
The last decade has witnessed the significant achievement of RF model in applications of drug developments and related works (Win et al., 2017; Worachartcheewan et al., 2015;
Pratiwi et al., 2017; Simeon et al., 2016a;
Phanus-umporn et al., 2018; Suvannang et al., 2018). RF model takes advantage of two effi- cient machine learning techniques: bagging and random feature selection.
QSAR MODELS OF AROMATASE INHIBITORY ACTIVITY
The utilization of QSAR in aromatase re- search has only scratched the surface of the possible benefits that can be attained. Several classes of aromatase inhibitors have been cre- ated with only a few notable classes that have made it to the pre-clinical and clinical testing.
Thus, it is worthwhile to elucidate the physicochemical profiles of effective aroma- tase inhibitors in comparison with ineffective ones as such knowledge can aid in the optimi- zation of existing compound classes or devel- opment of novel classes from available scaf- folds and functional group fragments. Partic- ularly, questions such as “What molecular de- scriptors are crucial for highly potent com-
pound? How big should a potent aromatase inhibitor be? Which functional groups are most commonly found in potent com- pounds?” could be answered through QSAR efforts.
In 1997, Lipinski published a landmark paper on the Rule of 5 (Lipinski et al., 2001), which has been widely used in the pharma- ceutical industries as general guidelines for drug development efforts. The Rule of 5 con- siders ADMET issues that are critical towards the success of the identified compounds of in- terest as it may help reduce pre-clinical and clinical failures. A similar approach may be applied to the aromatase system where several Rules may be developed for the identification of potent aromatase inhibitors.
The earliest QSAR study performed for AIs was published in 1994 by Nagy et al.
(1994) whereby MLR analysis was conducted on models built with 5 quantum chemical de- scriptors for 24 compounds assessed by LOO- CV procedure. From the results obtained, the authors were able to discover 2 candidate AIs for further pharmacophore studies.
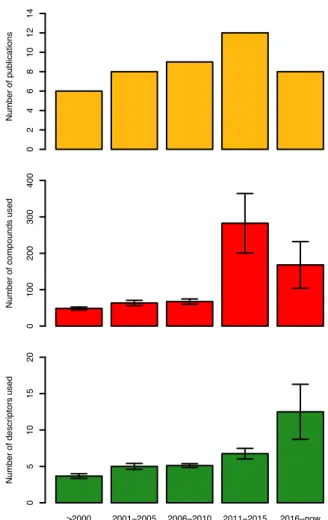
Furthermore, as can be seen from Figure 4 (top-left), in the years from 1994-2000 only five additional articles (Oprea and García, 1996; Recanatini, 1996; Sulea et al., 1997;
Recanatini and Cavalli, 1998; Cavalli et al., 2000) on QSAR of AIs were published, which utilized mainly molecular field descriptors and LOO-CV. For example, Cavalli et al.
(2000) quantitatively compared 3D-QSAR models of the cytochrome P450 active site via CoMFA modeling and homology modeling techniques. Once models were built, two non- steroidal AIs were docked into each model and the resulting interaction energies were recorded. The authors noted that although each technique had its drawbacks, both could be used together as a mutual validation tech- nique for ligand-based and target-based 3D models of ligand-target interactions.
In addition, Sulea et al. (1997) described
van der Waals envelopes as a steric potential
field in a 3D-QSAR CoMFA based modeling
of ligand-receptor interactions that was per-
formed on 78 steroidal AIs and evaluated
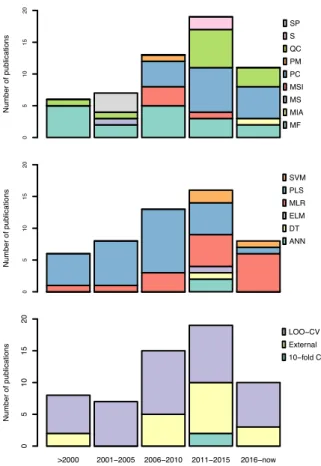
Figure 4: Overview on the number of publications (top), number of compounds (middle) and the number of descriptors (bottom) extracted from ar- ticles describing QSAR models of AIs.
LOO-CV procedure. The authors were able to prove that the van der Waals envelopes inter- section volumes (INVOL) could be used as an alternative replacement for the more com- monly used Lennard-Jones 6-12 potential for the identification of relevant features govern- ing biological activities within CoMFA and 3D-QSAR based models.
Similarly, Oprea and Garcia (1996) ana- lyzed the data of 50 steroidal AIs using CoMFA models coupled with chemometric based Generating Optimal Linear PLS Esti- mation (GOLPE) models validated using both the LOO-CV and the external test procedures.
The authors concluded that using CoMFA, differences in aromatase inhibition among the C6-substituted steroids were shown to be con- sistent with known, potent inhibitors of aro-
matase, included in the model. In addition, when direct alignment comparisons were made, these compounds exhibited distinct features that overlapped with the steric and electrostatic fields obtained in the CoMFA model.
Over the course of the next five years (2001-2005) (Gironés and Carbó-Dorca, 2002; Beger and Wilkes, 2002; Beger et al., 2001; Polanski and Gieleciak, 2003; Beger et al., 2004; Leonetti et al., 2004; Cavalli et al., 2005), it can be seen that studies employed higher number of descriptors as well as made use of more descriptor types (e.g. molecular fields, spectral, molecular surface and quan- tum chemical) were observed in seven publi- cations where the only CV method applied on the datasets was the LOO-CV (Figure 4). Be- ger et al. (2004) developed a technique which was similar to QSAR modeling, which they called the minimum deviation of structurally assigned spectra analysis (MiDSASA). This method was based on minimum chemical shift differences on substructure fragments in- stead of relying on substructure fragments as a whole for model production as is typical in SAR modeling. The authors used this MiD- SASA template on 50 steroids binding the aromatase enzyme based on the average ac- tivity of the four nearest compounds, resulting in a correlation of 0.71. The authors further suggested that models made using the mini- mum deviation concept can be applied to other chemoinformatic data analyses such as metabolite concentrations in metabolic path- ways for metabolomics research.
In addition, Beger et al. (2001) built quan- titative spectroscopic data-activity relation- ship (QSDAR) models for 50 steroidal AIs developed based on data collected via simu- lated
13C nuclear magnetic resonance (NMR).
The models were based on comparative spec- tral analysis (CoSA) and comparative struc- turally assigned spectral analysis (CoSASA).
From the PLS analysis, the CoSA models ex- hibited R
2of 0.78 and Q
2of 0.71 while the CoSASA based models provided R
2of 0.75 and Q
2of 0.66.
Number of publications 02468101214
Number of compounds used 0100200300400
>2000 2001−2005 2006−2010 2011−2015 2016−now Number of descriptors used 05101520
Similarly, Polanski and Gieleciak (2003) used CoMSA to analyse the 3D-QSAR mod- els built for 50 steroidal AIs. The authors aimed to predict regions that are important for the binding activity of the ligand with the en- zyme. Using uniformative variable elimina- tion as coupled to partial least squares (UVE- PLS) or modified iterative UVE procedure (IVE-PLS), the authors were able to deter- mine that the 3D-QSAR models generated (Q
2= 0.96) outperformed those reported at the time using CoMFA, CoSA or CoSASA.
Furthermore, the number of articles on QSAR of AIs were seen to increase rapidly for the years 2006-2010 (Figure 4) with the publication of ten articles in the time period (Bak and Polanski, 2007; Nagar et al., 2008;
Castellano et al., 2008; Mittal et al., 2009;
Gueto et al., 2009; Nagar and Saha, 2010a, b;
Roy and Roy, 2010a, b; Dai et al., 2010).
Most of the QSAR models in this time frame were built utilizing physicochemical de- scriptors as compared to other techniques in the previous years.
Additionally, the validation methods for AIs QSAR publications in the abovemen- tioned years were tied between LOO-CV only and LOO-CV in conjunction with external validations (Figure 5). For example, Bak and Polanski (2007) conducted a 4D-QSAR study based on the self-organizing map (SOM), which is an unsupervised method based on the Kohonen neural network coupled with the IVE-PLS analysis. The use of this combined 4D-QSAR and IVE-PLS method provided a very stable and predictive modeling tech- nique. The method enabled the authors to identify molecular motifs contributing to the aromatase enzyme binding activity. Gueto et al. (2009) employed structure-based drug de- sign approach using receptor-independent CoMFA maps that were generated from Leap- Frog calculations.
A robust model as verified by the boots- trapping method produced statistically signif- icant results via cross-validated analysis, which consisted of 45 and 10 molecules in the training and test sets, respectively. Using this
model, the authors were able to predict the ac- tivity of novel AI molecules which had more potency than previously reported compounds.
Roy and Roy (2010a) performed a 3D-QSAR study on a diverse set of compounds using the crystal structure of aromatase whereby the da- taset was divided into training (n=87) and testing (n=29) set by clustering techniques.
All the QSAR models were subjected to mul- tiple validation methods such as internal vali- dation, external validation and Y-randomiza- tion. The authors concluded that in order to exhibit ideal aromatase inhibitory activity, the compound should contain at least one or two hydrogen bond acceptor groups (such as NO
2and CN) with optimal hydrophobicity.
Additionally, the increase in popularity of QSAR models for predicting AIs was greatly observed in 2011-2015 (Narayana et al., 2012; Kishore et al., 2013; Nantasenamat et al., 2013a, b, 2014; Dai et al., 2014; Xie et al., 2014; Worachartcheewan et al., 2014a, b;
Shoombuatong et al., 2015; Awasthi et al., 2015; Xie et al., 2015; Kumar et al., 2016) whereby the number of publications increased to thirteen, with an even more dramatic rise in the number of compounds used for calculat- ing descriptors using LOO-CV and external validation (Figure 5). Worachartcheewan et al. (2014b) investigated the QSAR of couma- rins as potential AIs using 7 quantum chemi- cal descriptors. MLR was used for the analy- sis of models, which were shown to achieve good predictive performance as verified by LOO-CV affording Q
2of 0.9239 and RMSE
CVof 0.1304 while an external valida- tion confirmed its robustness with Q
2Extof 0.7268 and RMSE
Extof 0.2927.
Moreover, Nantasenamat et al. (2013b)
explored a set of 54 letrozole analogs as AIs
in a QSAR study using MLR, ANN and SVM
methods. The QSAR model was developed
using a set of descriptors giving rise to im-
portant physicochemical properties (i.e. num-
ber of rings, ALogP and HOMO-LUMO)
which were further used for predicting AI ac-
tivity. The authors observed a strong correla-
tion among the predicted pIC
50values with
Figure 5: Overview of the types of descriptors (top), machine learning algorithms (middle) and validation methods (bottom) extracted from arti- cles describing QSAR models of AIs.
(Abbreviations: SP, S, QC, PM, PC, MSI, MS, MIA and MF represents spectral, SMILES, quantum chemical, pharmacophore mapping, physicochemical, molecular similarity indice, molecular surface, multivariate image analysis and molecular field, respectively. SVM, PLS, MLR, ELM, DT and ANN represents support vector ma- chine, partial least square, multiple linear regression, efficient linear model, decision tree and artificial neural network, respectively. LOO-CV, external and 10-fold CV represents leave-one-out cross-validation, external test and 10-fold cross-validation, respectively)
their experimental values, displaying correla- tion coefficient Q
2values in the range of 0.72–0.83 while the external test set (Q
2Ext) afforded values in the range of 0.65–0.66.
Furthermore, Worachartcheewan et al.
(2014a) employed the bioactivity data on pIC
50of 973 AIs for constructing QSAR mod- els using CORelation And Logic (CORAL) software (http://www.insilico.eu/coral) where the molecular structures are represented by
their simplified molecular input line entry system (SMILES) notation and thus eliminat- ing the need to geometrically optimize molec- ular structures. The Monte Carlo optimization of correlation was used for predicting the aro- matase inhibitory activity. Results obtained from rigorous dataset splits and CV tech- niques indicated that models were reliable with R
2and Q
2in ranges of 0.6271–0.7083 and 0.6218–0.7024, respectively. Similarly, Nantasenamat et al. (2014) conducted the first large-scale QSAR study on a non-redundant set of 63 flavonoids using MLR, ANN, SVM and DT methods. The models obtained showed good predictive performance with Q values in the range of 0.8014–0.9870 and 0.8966–0.9943 evaluated by LOO-CV and external test, respectively. Furthermore, in an- other study conducted by our group Shoombuatong et al. (2015), proposed the simple and interpretable efficient linear method (ELM) for constructing a highly pre- dictive QSAR model. The results indicated that a robust performance was achieved using the ELM method with 10-fold CV MCC val- ues of 0.64 and 0.56 for steroidal and non-ste- roidal AIs, respectively. In addition, Xie et al.
(2014) constructed 3D QSAR models in order to elucidate the steroidal AIs with lower side effects using CoMFA and CoMSIA methods.
The models produced were reliable and pre- dictive good statistical results for CoMFA: Q
2= 0.636, R
2= 0.988, Q
2Ext= 0.658 and CoMSIA: Q
2= 0.843, R
2= 0.989, Q
2Ext= 0.601.
The current trend (2016–2018; Figure 4) shows that eight articles (Song et al., 2016;
Ghodsi and Hemmateenejad, 2016; Adhikari et al., 2017a; Prachayasittikul et al., 2017;
Pingaew et al., 2018; Lee and Barron, 2018;
Barigye et al., 2018) have already been pub- lished in comparison to a total of 13 publica- tions for the previous 5 years. Thus, it is promising that the number of publication re- garding AIs utilizing QSAR models for pre- diction will continue to grow.
SP S QC PM PC MSI MS MIA MF Number of publications 05101520
SVM PLS MLR ELM DT ANN Number of publications 05101520
>2000 2001−2005 2006−2010 2011−2015 2016−now LOO−CV External 10−fold CV
Number of publications 05101520
To further aid in that growth process, the number of compounds used as the data set has seen a steady rise with the number of de- scriptors for generating QSAR models saw a dramatic increase as compared to previous years. As for the types of descriptors, the trend has moved towards modern QSAR with the utilization of physicochemical properties and quantum chemical structures to build the models. In addition, the main validation tech- niques remain the same as previous years whereby LOO-CV and external validation were mainly used. Ghodsi and Hemma- teenejad (2016) conducted QSAR studies on a series of diarylalkylimidazole and dia- rylalkyltriazole derivatives previously evalu- ated as being potent AIs using 870 quantum chemical descriptors (such as dipole moment and energies of HOMO and LUMO orbitals, hydration energies, and lipophilicity) that were analyzed using MLR. The models were validated with the LOO-CV and the authors concluded that lipophilicity was an important factor for the strong binding to aromatase. In addition, the HOMO orbital shape and its im- idazole ring distribution was also considered as important. More recently, Adhikari et al.
(2017a) performed QSAR studies using vari- ous techniques (2D-QSAR, 3D-QSAR and HQSAR) on 67 non-steroidal letrozole-based analogs with promising AI activity. Stepwise multiple linear regression (SMLR) was used to build the models after which, the models were validated with the LOO for internal val- idation. The results from the 2D-QSAR study suggested the importance of the nitrogen at- oms in their electrotopological state thereby inferring that their orientation may modulate the inhibition. The authors noted that these re- sults were further validated with the 3D- QSAR analysis while the HQSAR model in- ferred the importance of the p-cyanophenyl moiety in regulating AI. Additionally, Lee and Barron (2018) conducted 3D-QSAR stud- ies on the bioactivity (IC
50) of 124 com- pounds exhibiting AI activity (steroidal and heterocyclic). Multiple linear regress-
ion combined with genetic algorithm (GA- MLR) was used to build the models which was then validated via the LOO and external validation methods. Furthermore, Prachaya- sittikul et al. (2017) investigated the aroma- tase inhibitory potency of a series of 2-amino (chloro)-3-chloro-1,4-naphthoquinone deriv- atives by constructing QSAR models using the IC
50values. The models were evaluated based on MLR and LOO-CV which indicated good predictive performance (Q
2= 0.9783 and RMSE
CV= 0.0748) of the constructed model. Therefore, 1,4-naphthoquinone deriv- atives can be seen as promising compounds needed further evaluations as AIs. The most recent article published by Barigye et al.
(2018) reported the first practical application of Discrete Fourier Transformation (DFT) based Multiple Image Analysis (MAI) de- rived 2D-QSAR model for the classification of an aforementioned set of 973 novel AIs as compiled from the literature (Nantasenamat et al., 2013a).
INSIGHTS FROM QSAR MODELS Model interpretation is the process by which the underlying features contributing the most to the investigated biological activity are deduced as to help guide the design of novel and robust drugs. The interpretability of a QSAR model is contingent upon the types of descriptors and machine learning algo- rithms used. As summarized in Table 4, it can be observed that prior to 2010, MLR and PLS models, also known as white-box approaches, were the most popular and yet simple learning algorithms used for QSAR modeling of AIs.
Although these two models are interpret-
able but they did not perform well on highly
complexed data. On the other hand, a black-
box approach like ANN and SVM can pro-
vide higher accuracy in the same case but they
cannot provide details pertaining to how the
factors exert its influence on the biological ac-
tivity of investigated compounds. Analysis of
key features for aromatase inhibition from
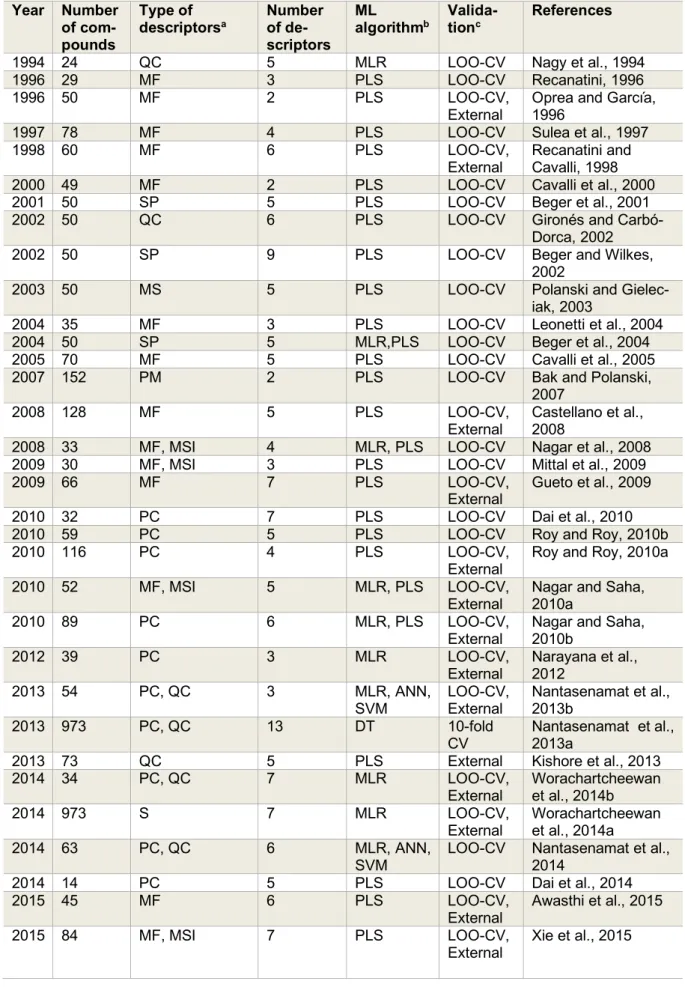
Table 4: Summary of machine learning algorithm used in QSAR modeling for predicting and analyzing aromatase inhibitor.
Year Number of com- pounds
Type of
descriptorsa Number of de- scriptors
ML
algorithmb Valida-
tionc References
1994 24 QC 5 MLR LOO-CV Nagy et al., 1994
1996 29 MF 3 PLS LOO-CV Recanatini, 1996
1996 50 MF 2 PLS LOO-CV,
External Oprea and García, 1996
1997 78 MF 4 PLS LOO-CV Sulea et al., 1997
1998 60 MF 6 PLS LOO-CV,
External Recanatini and Cavalli, 1998
2000 49 MF 2 PLS LOO-CV Cavalli et al., 2000
2001 50 SP 5 PLS LOO-CV Beger et al., 2001
2002 50 QC 6 PLS LOO-CV Gironés and Carbó-
Dorca, 2002
2002 50 SP 9 PLS LOO-CV Beger and Wilkes,
2002
2003 50 MS 5 PLS LOO-CV Polanski and Gielec-
iak, 2003
2004 35 MF 3 PLS LOO-CV Leonetti et al., 2004
2004 50 SP 5 MLR,PLS LOO-CV Beger et al., 2004
2005 70 MF 5 PLS LOO-CV Cavalli et al., 2005
2007 152 PM 2 PLS LOO-CV Bak and Polanski,
2007
2008 128 MF 5 PLS LOO-CV,
External Castellano et al., 2008
2008 33 MF, MSI 4 MLR, PLS LOO-CV Nagar et al., 2008
2009 30 MF, MSI 3 PLS LOO-CV Mittal et al., 2009
2009 66 MF 7 PLS LOO-CV,
External Gueto et al., 2009
2010 32 PC 7 PLS LOO-CV Dai et al., 2010
2010 59 PC 5 PLS LOO-CV Roy and Roy, 2010b
2010 116 PC 4 PLS LOO-CV,
External Roy and Roy, 2010a
2010 52 MF, MSI 5 MLR, PLS LOO-CV,
External Nagar and Saha, 2010a
2010 89 PC 6 MLR, PLS LOO-CV,
External Nagar and Saha, 2010b
2012 39 PC 3 MLR LOO-CV,
External Narayana et al., 2012
2013 54 PC, QC 3 MLR, ANN,
SVM LOO-CV,
External Nantasenamat et al., 2013b
2013 973 PC, QC 13 DT 10-fold
CV Nantasenamat et al., 2013a
2013 73 QC 5 PLS External Kishore et al., 2013
2014 34 PC, QC 7 MLR LOO-CV,
External Worachartcheewan et al., 2014b
2014 973 S 7 MLR LOO-CV,
External Worachartcheewan et al., 2014a
2014 63 PC, QC 6 MLR, ANN,
SVM LOO-CV Nantasenamat et al., 2014
2014 14 PC 5 PLS LOO-CV Dai et al., 2014
2015 45 MF 6 PLS LOO-CV,
External
Awasthi et al., 2015
2015 84 MF, MSI 7 PLS LOO-CV,
External
Xie et al., 2015
Year Number of com- pounds
Type of
descriptorsa Number of de- scriptors
ML
algorithmb Valida-
tionc References
2015 973 PC, QC 15 ELM 10-fold
CV
Shoombuatong et al., 2015
2015 66 MF, S 4 PLS LOO-CV,
External Xie et al., 2014
2016 46 MF 5 PLS LOO-CV Kumar et al., 2016
2016 76 PC, QC 9 MLR LOO-CV Ghodsi and Hemma-
teenejad, 2016
2016 13 PC 4 MLR LOO-CV Song et al., 2016
2017 11 PC, QC 4 MLR LOO-CV Prachayasittikul et
al., 2017
2017 67 MF 5 MLR LOO-CV,
External Adhikari et al., 2017a
2018 124 PC, QC 9 MLR LOO-CV,
External Lee and Barron, 2018
2018 34 PC 4 MLR LOO-CV Pingaew et al., 2018
2018 973 MIA 60 SVM External Barigye et al., 2018
aMF: molecular field, MIA: Multivariate image analysis, MS: Molecular surface, MSI: molecular similarity indices, PC: physicochemical, PM: Pharmacophore mapping, QC: quantum chemical, S: SMILES, SP: Spectral
bANN: artificial neural network, MLR: multiple linear regression, PLS: partial least squares regression, SVM: support vector machine
cLOO-CV: leave-one-out cross-validation, 10-fold CV: 10-fold cross-validation
selected QSAR works employing descriptors pertaining to quantum chemical and physico- chemical properties are performed hereafter (Table 5). Nantasenamat et al. (2013a) per- formed a large-scale QSAR modeling of a set of steroidal and non-steroidal AIs and re- vealed that the most important features from PCA analysis were found to be nHAcc, TPSA and LUMO for non-steroidal and Q
m, TPSA and nHAcc and ALogP for steroidal AIs. In addition, fragment analysis provided comple- mentary insights by suggesting that the pres- ence of the azole ring in non-steroidal inhibi- tors (i.e. known to coordinate with the heme iron) and the presence of carbonyl group in the C3 position of steroidal inhibitors were important for aromatase inhibition.
In addition, using the same set of data, Shoombuatong et al. (2015) used the ELM model to deduce the most important features associated with AI. It was observed that the top four most informative descriptors for the steroidal dataset were C-025 (atom centered fragments; R--CR--R), ESpm14u and ESpm13r (connectivity or bonding between atoms) and MATS6p (involved in polarizabil-
ity of molecules).
As for the non-steroidal dataset, the most
important feature was determined to be mo-
lecular graph, polarizability and electronega-
tivity of the compound. Therefore, the authors
concluded that the polarizability of the com-
pounds along with a suitable shape may be the
determining factors needed for both types of
AIs for reaching its intended target. Addition-
ally, Worachartcheewan et al. (2014a) con-
ducted a large-scale study on AIs using
SMILES-based descriptors and discovered
that the most notable features were the pres-
ence of cyclic rings (i.e. found in steroidal in-
hibitors) and the presence in the molecular
structure of oxygen atoms together with dou-
ble bonds that are disconnected in the struc-
ture (++++O---B2==) (i.e. analogous to the
ketone groups present in the natural substrate,
androstenedione) are important in increasing
aromatase inhibitory activity. Furthermore,
Ghodsi and Hemmateenejad (2016) con-
ducted QSAR on AIs based on long-chained
diarylalkylimidazole and diarylalkyltriazole
(non-steroidal) molecule skeletons in which
they determined important features to include
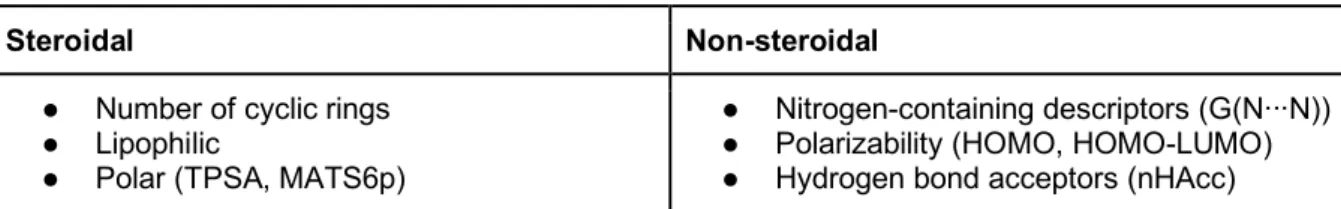
Table 5: Summary of key features for aromatase inhibition as deduced from QSAR modeling. Example descriptors are shown in the parenthesis.
Steroidal Non-steroidal
● Number of cyclic rings
● Lipophilic
● Polar (TPSA, MATS6p)
● Nitrogen-containing descriptors (G(N∙∙∙N))
● Polarizability (HOMO, HOMO-LUMO)
● Hydrogen bond acceptors (nHAcc)
TPSA: an empirical measure of the polar surface area of a molecule, MATS6p: Moran autocorrelation of lag 6 as weighted by polarizability, G(N∙∙∙N): Sum of geometric distances between N∙∙∙N, HOMO: the highest energy molec- ular orbitals, HOMO-LUMO: the energetic difference between the HOMO and LUMO states, nHAcc: the number of hydrogen bond acceptors present in a molecule
geometrical distances of N and N atoms as well as that of O and O atoms (i.e. nitrogen atoms of azole rings as well as oxygen atoms from steroidal ketones), length of the bridge carbon chain (i.e. methylene spacer separat- ing the azole ring and the phenol ring), num- ber of triple bonds (i.e. triple bond in the ni- trile or CN that is an integral part of FDA-ap- proved AIs), HOMO energy (i.e. localization of HOMO orbital predominantly in the imid- azolyl ring), etc. Furthermore, Nantasenamat et al. (2014) studied flavonoids with aroma- tase inhibitory activity, and found that active compounds were found to exhibit smaller size, higher degree of rigidity, lower polarity and charge distribution, and afforded lower electron-withdrawing tendency and higher chemical reactivity than those of the inactive class.
As for the analysis of 3D-QSAR models utilizing descriptors based on molecular fields, Castellano et al. (2008) revealed that the aligned molecules showed the presence of three major regions in which two were perti- nent for aromatase inhibition (i.e. one im- portant region afforded both electrostatic and hydrogen bonds while the second important region was occupied by the characteristic az- ole moiety) whereas the other region was not important for the activity. Adhikari et al.
(2017a) performed an extensive study em- ploying a wide range of QSAR models in- cluding 2D and 3D QSAR as well as molecu- lar docking to also confirm the importance of the electrostatic property of the nitrogen-con- taining azole moiety, p-cyanophenyl moiety,
p-nitrophenyl, hydro-phobicity as well as the appropriate size and shape of AIs were crucial for aromatase inhibitory activity. Xie et al.
(2015) performed both CoMFA and CoMSIA studies and both studies further supported the importance of bulky steric groups as well as the importance of electrostatic properties per- taining to the presence of azole nitrogen at- oms.
CONCLUSION
In spite of extensive research (i.e. medici- nal chemistry and QSAR work) in the quest of novel and potent aromatase inhibitors, there has been only a few review articles on the topic (Adhikari et al. 2017b; Yadav et al.
2015). Briefly, Yadav et al. (2015) carried out
a review focusing on molecular modeling as
well as QSAR of steroidal AIs whereas Adhi-
kari et al. (2017b) based their review on
QSAR studies of non-steroidal AIs. Herein,
we have performed an extensive review on
the mechanistic insights of pertinent features
as derived from all previous QSAR models of
both steroidal and non-steroidal AIs. Moreo-
ver, this review also summarized the experi-
mental setup of all QSAR studies such that a
comparative and holistic analysis could be de-
duced and used for providing a glimpse on the
current state-of-the-art in the field as well as
serving as the basis for planning future studies
to further gain insights on aromatase inhibi-
tion. For example, it is anticipated that in-
sights gained from QSAR models alone pro-
vides one aspect where it may be beneficial to
also call upon complementary methodologies
such as structure-based and systems-based approaches to facilitate and augment the lig- and-based QSAR approach. In fact, there have been a few studies employing a multi- tude of ligand, structure and systems-based approaches in studying aromatase inhibition (Simeon et al. 2016b); Suvannang et al. 2011) and future works along this line is expected to be of great benefit to the scientific commu- nity.
Conflict of interests
The authors have declared that no compet- ing interests exist.
Acknowledgements
This work is supported by the Office of Higher Education Commission and the Thai- land Research Fund (No. MRG6180226) and the New Researcher Grant (A31/2561) from Mahidol University. This work is also sup- ported by the Center of Excellence on Medi- cal Biotechnology (CEMB), S&T Postgradu- ate Education and Research Development Of- fice (PERDO), Office of Higher Education Commission (OHEC), Thailand. Partial sup- port from the annual budget grant (B.E. 2557- 2559) of Mahidol University is also acknowl- edged.
REFERENCES
Adhikari N, Amin SA, Jha T, Gayen S. Integrating re- gression and classification-based QSARs with molec- ular docking analyses to explore the structure-antiaro- matase activity relationships of letrozole-based ana- logs. Can J Chem. 2017a;95:1285–95.
Adhikari N, Amin SA, Saha A, Jha T. Combating breast cancer with non-steroidal aromatase inhibitors (NSAIs): Understanding the chemico-biological inter- actions through comparative SAR/QSAR study. Eur J Med Chem. 2017b;137:365–438.
Ahmad I, Shagufta. Recent developments in steroidal and nonsteroidal aromatase inhibitors for the chemo- prevention of estrogen-dependent breast cancer. Eur J Med Chem. 2015;102:375–86.
Aiken LS, West SG, Pitts SC. Multiple linear regres- sion. In: Schinka JA, Velicer WF (eds.): Handbook of psychology: Research methods in psychology, Vol. 2 (pp 483-507). Hoboken, NJ: Wiley, 2003.
American Cancer Society. Global cancer facts & fig- ures. 3rd ed. Atlanta, GA: American Cancer Society, 2015.
Avendaño C, Menéndez JC. Anticancer drugs that in- hibit hormone action. In: Avendaño C, Menéndez JC.
Medicinal chemistry of anticancer drugs (pp 53-91).
Amsterdam: Elsevier, 2008.
Awasthi M, Singh S, Pandey VP, Dwivedi UN. Molec- ular docking and 3D-QSAR-based virtual screening of flavonoids as potential aromatase inhibitors against es- trogen-dependent breast cancer. J Biomol Struct Dyn.
2015;33:804–19.
Bak A, Polanski J. Modeling robust QSAR 3: SOM- 4D-QSAR with iterative variable elimination IVE- PLS: application to steroid, azo dye, and benzoic acid series. J Chem Inf Model. 2007;47:1469–80.
Barigye SJ, Freitas MP, Ausina P, Zancan P, Sola- Penna M, Castillo-Garit JA. Discrete Fourier trans- form-based multivariate image analysis: application to modeling of aromatase inhibitory activity. ACS Comb Sci. 2018;20:75–81.
Beger RD, Buzatu DA, Wilkes JG, Lay JO. 13C NMR Quantitative Spectrometric Data-Activity Relationship (QSDAR) models of steroids binding the aromatase en- zyme. J Chem Inf Comput Sci. 2001;41:1360–6.
Beger RD, Wilkes JG. Comparative structural connec- tivity spectra analysis (CoSCoSA) models of steroids binding to the aromatase enzyme. J Mol Recognit.
2002;15:154–62.
Beger RD, Harris S, Xie Q. Models of steroid binding based on the minimum deviation of structurally as- signed 13C NMR spectra analysis (MiDSASA). J Chem Inf Comput Sci. 2004;44:1489–96.
Bonnefoi HR, Smith IE, Dowsett M, Trunet PF, Hou- ston SJ, da Luz RJ, et al. Therapeutic effects of the aro- matase inhibitor fadrozole hydrochloride in advanced breast cancer. Br J Cancer. 1996;73:539–42.
Breiman L. Random forests. Mach Learn. 2001;45:5–
32.
Brueggemeier RW, Hackett JC, Diaz-Cruz ES. Aroma- tase inhibitors in the treatment of breast cancer. Endocr Rev. 2005;26:331–45.
Castellano S, Stefancich G, Ragno R, Schewe K, San- toriello M, Caroli A, et al. CYP19 (aromatase): explor- ing the scaffold flexibility for novel selective inhibi- tors. Bioorg Med Chem. 2008;16:8349–58.
Cavalli A, Greco G, Novellino E, Recanatini M. Link- ing CoMFA and protein homology models of enzyme-
inhibitor interactions: an application to non-steroidal aromatase inhibitors. Bioorg Med Chem. 2000;8:
2771–80.
Cavalli A, Bisi A, Bertucci C, Rosini C, Paluszcak A, Gobbi S, et al. Enantioselective nonsteroidal aromatase inhibitors identified through a multidisciplinary medic- inal chemistry approach. J Med Chem. 2005;48:7282–
9.
Coombes RC, Kilburn LS, Snowdon CF, Paridaens R, Coleman RE, Jones SE, et al. Survival and safety of exemestane versus tamoxifen after 2-3 years’ tamoxi- fen treatment (Intergroup Exemestane Study): a ran- domised controlled trial. Lancet. 2007;369:559–70.
Cortes C, Vapnik V. Support-vector networks. Mach Learn. 1995;20:273–97.
Cramer RD, Patterson DE, Bunce JD. Comparative molecular field analysis (CoMFA). 1. Effect of shape on binding of steroids to carrier proteins. J Am Chem Soc. 1988;110:5959–67.
Cros AFA. Action de l’alcohol amyliquesur l’organ- isme. Strasbourg: University of Strasbourg, 1863.
Crum Brown A, Fraser TR. On the connection between chemical constitution and physiological action; with special reference to the physiological action of the salts of the ammonium bases derived from Strychnia, Bru- cia, Thebaia, Codeia, Morphia, and Nicotia. J Anat Physiol. 1868;2:224–42.
Dai Y, Wang Q, Zhang X, Jia S, Zheng H, Feng D, et al. Molecular docking and QSAR study on steroidal compounds as aromatase inhibitors. Eur J Med Chem.
2010;45:5612–20.
Dai Y, Xiao Y, Wang Q, Wei S, Zhang X, Ma Z, et al.
Syntheses and QSAR studies of benzylimidazole de- rivatives and benzylcarbazole as potential aromatase inhibitors. Asian J Chem. 2014;26: 2381-8.
Demers LM, Boucher AE, Santen RJ. Aminoglute- thimide therapy in breast cancer: relationship of blood levels to drug-related side effects. Clin Physiol Bio- chem. 1987;5:287–91.
Dowsett M, Lloyd P. Comparison of the pharmacoki- netics and pharmacodynamics of unformulated and formulated 4-hydroxyandrostenedione taken orally by healthy men. Cancer Chemother Pharmacol. 1990;27:
67–71.
DrugBank. Formestane [Internet]. 2013 [cited 2018 Jun 2] Available from: https://www.drug- bank.ca/drugs/DB08905.
Dutta U, Pant K. Aromatase inhibitors: past, present and future in breast cancer therapy. Med Oncol. 2008;
25:113–24.
Eisen A, Trudeau M, Shelley W, Messersmith H, Pritchard KI. Aromatase inhibitors in adjuvant therapy for hormone receptor positive breast cancer: a system- atic review. Cancer Treat Rev. 2008;34:157–74.
Fujita T, Winkler DA. Understanding the roles of the
“two QSARS”. J Chem Inf Model. 2016;56:269–74.
Ghodsi R, Hemmateenejad B. QSAR study of dia- rylalkylimidazole and diarylalkyltriazole aromatase in- hibitors. Med Chem Res. 2016;25:834–42.
Ghosh D, Griswold J, Erman M, Pangborn W. Struc- tural basis for androgen specificity and oestrogen syn- thesis in human aromatase. Nature. 2009;457:219–23.
Gironés X, Carbó-Dorca R. Molecular quantum simi- larity-based QSARs for binding affinities of several steroid sets. J Chem Inf Comput Sci. 2002;42:1185–93.
Graves PE, Salhanick HA. Stereoselective inhibition of aromatase by enantiomers of aminoglutethimide. En- docrinology. 1979;105:52–7.
Gueto C, Torres J, Vivas-Reyes R. CoMFA, LeapFrog and blind docking studies on sulfonanilide derivatives acting as selective aromatase expression regulators.
Eur J Med Chem. 2009;44:3445–51.
Hansch C, Fujita T. p -σ-π analysis. A method for the correlation of biological activity and chemical struc- ture. J Am Chem Soc. 1964;86:1616–26.
Hansch C, Muir RM, Fujita T, Maloney PP, Geiger F, Streich M. The correlation of biological activity of plant growth regulators and chloromycetin derivatives with Hammett constants and partition coefficients. J Am Chem Soc. 1963;85:2817–24.
Helland IS. On the structure of partial least squares re- gression. Comun Stat Simul C. 1988;17:581–607.
Helland IS. Some theoretical aspects of partial least squares regression. Chemometr Intell Lab Sys. 2001;
58:97–107.
Hughes SW, Burley DM. Aminoglutethimide: a “side- effect” turned to therapeutic advantage. Postgrad Med J. 1970;46:409–16.
Karelson M, Lobanov VS, Katritzky AR. Quantum- chemical descriptors in QSAR/QSPR studies. Chem Rev. 1996;96:1027–44.