Upper-level troughs and tropical plumes at low latitudes: Identification,
climatology and their impact on global moisture transport
Inaugural-Dissertation zur
Erlangung des Doktorgrades
der Mathematisch-Naturwissenschaftlichen Fakultät der Universität zu Köln
vorgelegt von Elsa Luise Fröhlich
aus Dresden
Berichterstatter (Gutachter): Prof. Dr. A. Fink
Prof. Dr. M. Kerschgens Dr. habil. P. Knippertz Tag der mündlichen Prüfung: 24. Januar 2012
Abstract
Intrusions of upper-level extratropical troughs into low latitudes are prominent examples of extratropical-tropical interactions. Along the eastern edge of these troughs tropical moisture is transported poleward into the subtropics, where it may occasionally lead to extreme precipitation events. Furthermore, these situations are often accompanied by en- hanced convection and the formation of elongated cloud bands, which develop along the eastern flank of the trough and extend from the Tropics pole- and eastward into the sub- tropics or even midlatitudes. Such bands of mid- and upper-level clouds are commonly referred to asTropicalPlumes (TP). In the present work, these extratropical-tropical in- teractions are investigated on the basis of two novel climatologies of low-latitude troughs and of tropical plumes.
In the first part of this thesis the focus is on the identification, climatology and evolution of upper-level troughs at low latitudes and their impact on moisture transport is eval- uated. For the identification of such events a new algorithm has been developed that analyses, in contrast to prior studies,verticalaverages of potentialvorticity (VAPV) in the 400 to 100 hPa layer. This leads to a detection of intense troughs with a coherent signal throughout the upper troposphere. Regions with VAPV values of≥|2 PVU| be- tween 17◦North and South are defined as intrusion event. This algorithm is applied to ERA-40 reanalysis data for the 22-year period from 1980 to 2001.
The resulting climatology indicates frequency maxima during boreal winter in both hemispheres over the Pacific and Atlantic Oceans, in regions where upper westerly winds are predominant over the equator (“westerly ducts”). In boreal summer the intrusion ac- tivity is generally reduced with the exception of the central North Pacific.
Interannual variations of intrusion frequency in boreal winter show a clear association with the El Niño-Southern Oscillation (ENSO) in the Northern Hemisphere in such a way that over the North Pacific (North Atlantic) significantly more (less) intrusion events are detected during the cold phase of ENSO.
ii ABSTRACT
The typical evolution of a PV intrusion, analysed with the help of composites of the upper PV field, is in all regions related to an eastward propagating extratropical Rossby wave train, which is observed already five days before intrusion detection and disperses equatorward into the Tropics in the following days.
Composites of meridional moisture flux anomalies in relation to PV intrusions show an export of tropical moisture into the subtropics on the eastern flank of the wave distur- bance, which is most pronounced in the mid-troposphere (750 to 500 hPa).
In the second part of the thesis the focus is on the identification and climatology of Tropical Plumes. The identification of TPs is accomplished by applying a first objective algorithm to the brightness temperature (Tb) dataset of the Cloud Archive User Service for the time period Jul. 1983 to June 2006.
Following the classic definition by McGuirk et al. (1987) TPs are defined as extended bands (length > 2000 km) with Tbanomalies below -20 K that cross 15° North or South.
Additionally a criterion for the elongatedness of a TP is implemented based on the length-to-widthratio (LWR) of the smallest rectangle that contains the TP.
The resulting northern winter climatology reveals nine active TP regions with the main maximum located over the central South Pacific close to the South Pacific convergence zone. Further TP frequency maxima are found over the eastern parts of the North Pacific and North Atlantic and over the western South Atlantic. In boreal summer the TP fre- quency is generally reduced except for the Bay of Bengal and the Northwest Pacific. A long-term negative trend in TP occurrence was found to be an artefact caused by changes in the satellite viewing geometries.
Inter-annual variations in TP frequency are related to ENSO primarily over the Pacific, where TP frequencies in the western South Pacific and over Australia are reduced during El Niño and enhanced over the central and eastern subtropical Pacific.
Based on composite analysis two different conditions for TP genesis are detected. While TP development in the majority of the regions is linked to the propagation of extra- tropical upper-level trough into low latitudes, in the Northwest Pacific tropical convec- tive processes are responsible for TP formation. A brief comparison of both climatolo- gies supports this idea.
Finally, the new identification algorithms for low-latitude disturbances and Tropical Plumes and the associated climatologies can serve as a basis for future studies on extra- tropical-tropical interactions.
Zusammenfassung
Das Eindringen von extratropischen Höhentrögen in niedere Breiten ist ein typisches Beispiel für extratropische-tropische Wechselwirkungen. An der Vorderseite des Tro- ges wird feuchtwarme Luft aus den Tropen nordwärts in die Subtropen transportiert, wodurch in Einzelfällen extreme Niederschlagsereignissen in den Rand- und Subtro- pen hervorgerufen werden können. Zudem bilden sich häufig entlang der Ostseite dieser Höhentröge zusammenhängende Wolkenbänder, die in der Literatur als Tropische Wol- kenfahnen (engl.: Tropical Plumes, TP) bezeichnet werden. Tropische Wolkenfahnen bestehen aus hohen und mittelhohen Wolken und erstrecken sich über Tausende von Ki- lometern von den Tropen ost- und polwärts bis in die Subtropen oder sogar mittleren Breiten.
In der folgenden Arbeit werden diese extratropischen-tropischen Wechselwirkungen mit Hilfe von zwei neu erstellten Klimatologien erforscht. Die erste Klimatologie beschreibt das Auftreten von Höhentrögen in niederen Breiten und die zweite das von Tropischen Wolkenfahnen. Im ersten Teil dieser Arbeit wird auf die Identifizierung, Klimatologie und Entwicklung der Höhentröge in niederen Breiten eingegangen und deren Einfluss auf Wasserdampftransporte wird erörtert. Zur Identifizierung dieser Ereignisse wurde ein neuer Algorithmus entwickelt, der im Gegensatz zu früheren Studien vertikale Mittel der potentiellen Vorticity zwischen 400 bis 100 hPa (VAPV) analysiert. Dadurch werden intensivere Tröge erfasst, die ein kohärentes Signal in der oberen Troposphäre bewirken.
Regionen mit VAPV Werten≥|2 PVU| zwischen 17° N und S werden als Intrusionssys- teme definiert. Dieser Ansatz wird auf die ERA-40 Reanalysedaten für den 22-jährige Zeitraum von 1980 bis 2001 angewendet.
Die daraus resultierende Klimatologie zeigt im nordhemisphärischen Winter in beiden Hemisphären Häufigkeitsmaxima über dem pazifischen und atlantischen Ozeanen, in Regionen mit mittleren Westwinden über dem Äquator (“westerly ducts”). Im nordhemi- sphärischen Sommer ist die Intrusionsaktivität im Allgemeinen geringer mit Ausnahme
iv ZUSAMMENFASSUNG
über dem zentralen Nordpazifik.
Die jährlichen Schwankungen der regionalen Intrusionshäufigkeiten zeigen in der Nord- hemisphäre eine deutliche Verbindung zuElNiño-SouthernOscillation (ENSO): Dabei werden signifikant weniger (mehr) Intrusionsereignisse über dem Nordpazifik (Nordat- lantik) während eines El Niño-Winters identifiziert.
Im Weiteren wird die Entwicklung von Intrusionssystemen mit Hilfe von Kompositestu- dien dargestellt. Diese Studien zeigen, dass die Entstehung eines Intrusionssystems in allen Regionen an einen ostwärts propagierender Rossby-Wellenzug gekoppelt ist, der bereits fünf Tage vor dem Ereignis stromaufwärts im Bereich des Stormtracks beobach- tet wird. An den folgenden Tagen intensiviert sich dieser Wellenzug, während er sich äquatorwärts fortsetzt, wo es dann zur Bildung der Intrusion kommt.
Des Weiteren werden mit Hilfe von Kompositestudien Anomalien im Feuchtefluss im Zusammenhang mit dem Auftreten von Trögen in niederen Breiten untersucht. Dabei zeigt sich im Mittel ein nordwärtsgericheter Feuchtefluss an der Vorderseite des Troges, wodurch Feuchte aus den Tropen in die Subtropen transportiert wird.
Im zweite Teil dieser Arbeit wird die Identifizierung und Klimatologie von Tropischen Wolkenfahnen (TP) diskutiert. Für die Identifizierung der TPs wurde ein erstes objekti- ves Verfahren entwickelt, das mit Hilfe von Helligkeitstemperaturen (Tb) Wolkenstruk- turen im Zeitraum von Juli 1983 bis Juni 2006 identifiziert. Dabei werden in Anlehnung an die klassische Definition von McGuirk et al. (1987) TPs definiert als lang-gezogene Bänder (Länge> 2000 km) mit TbAnomalien unter -20 K, die den nördlichen oder süd- lichen 15ten Breitengrad überqueren. Ein weiteres Identifikationskriterium berücksich- tigt die “Langgezogenheit” der Wolkenfahnen mit Hilfe des Längenseitenverhältnisses (engl.lenght-to-widthratio, LWR) des kleinsten Rechtecks, dass die Wolkenfahne um- fasst. Die daraus resultierende Klimatologie zeigt im nordhemisphärischen Winter neun Regionen, in denen TPs bevorzugt auftreten, mit einem Aktivitätsmaximum über dem Südwestpazifik in der Nähe der südpazifischen Konvergenzzone identifiziert werden.
Weitere Häufigkeitsmaxima befinden sich über dem östlichen Nordpazifik und Nordat- lantik und über dem westlichen Südatlantik. Im Sommer werden im Allgemeinen weni- ger TPs identifiziert, außer über dem Golf von Bengalen und über dem Nordwestpazi- fik. Die TP-Klimatologie zeigt eine signifikante Abnahme der Wolkenbänder innerhalb des Untersuchungszeitraumes, die durch Änderungen der Beobachtungssatelliten (bzgl.
Randverdunklung) hervorgerufen wird. Die jährlichen Schwankungen der regionalen TP-Häufigkeiten zeigen vor allem im gesamten Pazifikraum eine deutliche Korrelation zu ENSO: Während über dem westlichen Südpazifik und über Australien im Allgemei- nen mehr TPs in den Warmphasen von ENSO (Oct.-March) identifiziert werden, treten über dem tropischen Zentralpazifik und östlichen Nord- und Südpazifik weniger TPs auf.
Mit Hilfe von Kompositstudien wurden zwei verschiede Bedingungen für die Entwick- lung von TPs festgestellt: Während die Bildung von Tropischen Wolkenfahnen über dem Nordatlantik und Nordpazifik im Zusammenhang mit Höhentrögen in niederen Breiten steht, sind über dem Nordwestpazifik tropische konvektive Prozesse eher verantwortlich für die Bildung von TPs. Ein Vergleich der beiden vorgestellten Klimatologien bestätigt
ZUSAMMENFASSUNG v zudem diese Beobachtungen.
Die in dieser Arbeit entwickelten Verfahren zur Identifizierung von Trögen in niederen Breiten und tropischen Wolkenfahnen und die damit erzeugten Klimatologien stellen eine Grundlage dar für weitere Forschungen im Zusammenhang mit extratropischen- tropischen Wechselwirkungen.
Contents
Abstract i
Zusammenfassung iii
Abbreviations xi
1 Introduction 1
1.1 Overview and motivation . . . 1
1.2 Scientific background . . . 3
1.2.1 Identification and climatology of low-latitude troughs . . . 3
1.2.2 Identification and climatology of tropical plumes . . . 6
1.2.3 Relationship between upper troughs and convection/TPs . . . . 8
1.2.4 Impacts on moisture fluxes and precipitation . . . 11
1.3 Aims and outline . . . 15
2 Data 17 2.1 ERA-40 reanalysis . . . 17
2.1.1 Ertel’s Potential Vorticity . . . 17
2.2 CLAUS Brightness Temperature . . . 19
2.3 Climate state indices . . . 20
3 Methods 23 3.1 Identification of low-latitude troughs . . . 23
viii CONTENTS
3.2 Identification of tropical plumes . . . 26
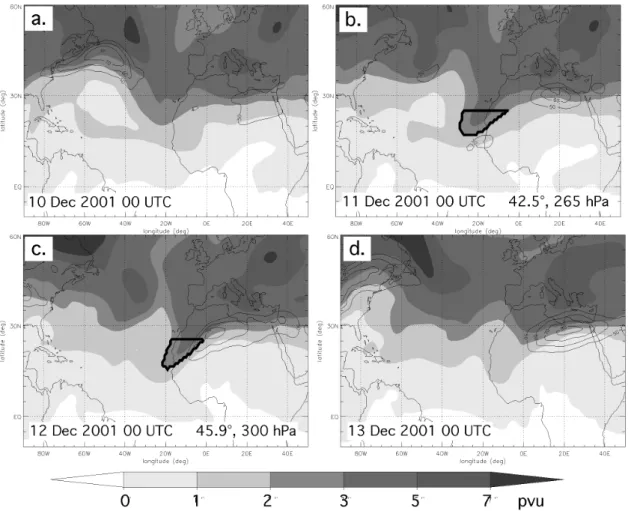
3.3 An illustrative example . . . 29
3.4 Centered composite analysis . . . 33
3.5 Mann-Kendall Test . . . 35
I Low-Latitude Troughs 37
4 Climatology 39 4.1 Geographical and seasonal distribution . . . 394.2 A sensitivity study . . . 43
5 Trough characteristics 45 5.1 Life time . . . 45
5.2 Vertical depth . . . 46
5.3 Horizontal tilt . . . 48
6 Trends and inter-annual variability 51 6.1 Association with ENSO . . . 54
7 Composited evolution of PV intrusions 59 8 Impact on moisture transport 67
II Tropical Plumes 73
9 Climatology 75 9.1 Geographical and seasonal distribution . . . 759.2 Sensitivity to length-to-width ratio criterion . . . 79
10 TP characteristics 83 10.1 Life time . . . 83
10.2 Length-to-width ratio . . . 85
10.3 Horizontal tilt . . . 87
11 Trends and inter-annual variability 89 11.1 Association with ENSO . . . 91
12 Composited evolution of Tropical Plumes 97
CONTENTS ix
13 Conclusions 101
13.1 Summary . . . 101 13.1.1 Identification and climatology of troughs at low latitudes . . . . 101 13.1.2 Identification and climatology of tropical plumes . . . 103 13.2 Discussion and Rèsumè . . . 104 13.3 Future research aspects . . . 106
References 109
A Additional figures and tables 117
Abbreviations
AIRS . . . Atmospheric Infrared Sounder AMM . . . Atlantic Meridional Mode CLAUS . . . Cloud Archive User Service CPC . . . Climate Prediction Center
ECMWF . . . European Centre for Medium Range Weather Forecast ENSO . . . El Niño/Southern Oscillation
EOF . . . Empirical Orthogonal Function
ERA-40 . . . ECMWF reanalysis, 40-year period 1957–2001 GPH . . . Geopotential Height
hPa . . . hectopascal IR . . . Infrared
ISCCP . . . International Satellite Cloud Climatology Project ITCZ . . . Intertropical Convergence Zone
LASDC . . . Langley Atmospheric Sciences Data Center LWR . . . Length-to-Width Ratio
mb . . . millibar
MCA . . . Maximum Covariance Analysis MJO . . . Madden-Julian Oscillation MLS . . . Microwave Limb Sounder MSLP . . . Mean Sea Level Pressure NAO . . . North Atlantic Oscillation
NCAR . . . National Center for Atmospheric Research NCEP . . . National Center of Environmental Prediction NH . . . Northern Hemisphere
OLR . . . Outgoing Longwave Radiation
PNA . . . Pacific/North American teleconnection pattern
xii ABBREVIATIONS
PV . . . Potential Vorticity PVU . . . PV Units
RH . . . Relative Humidity RWB . . . Rossby Wave Breaking
SACZ . . . South Atlantic Convergence Zone SH . . . Southern Hemisphere
SOI . . . Southern Oscillation Index SPCZ . . . South Pacific Convergence Zone STJ . . . Subtropical Jet
TME . . . Tropical Moisture Export TP . . . Tropical Plume
TRMM . . . Tropical Rainfall Measuring Mission TUTT . . . Tropical Upper Tropospheric Trough UTH . . . Upper Tropospheric Humidity
VAPV . . . Vertically Averaged Potential Vorticity WV . . . Water Vapor
1 Introduction
1.1 Overview and motivation
Different kinds of relevant interactions between the Tropics and extratropics have been observed and analysed for a long time. Most of these studies are mainly concerned with the influence of tropical heating anomalies on the extratropical circulation on seasonal to inter-annual time scales, for example, in connection to theElNiño/SouthernOscillation (ENSO; e.g., Horel and Wallace 1981) phenomenon. More recent studies brought evi- dence for a linkage between the intra-seasonal tropical heating anomalies related to the Madden-Julian Oscillation (MJO; e.g., Madden and Julian 1994) and anomalies in ex- tratropical circulation (e.g., Weickmann et al. 1985, Jones et al. 2004). But there are also examples, where the extratropics directly affect the Tropics mainly by modulating the convective activity on different space and time scales. Specific examples include lower-tropospheric cold-surge events (e.g., Chang and Lau 1982, Garreaud 2001) and the equatorward propagation of upper-tropospheric troughs (e.g., Kiladis and Weick- mann 1992a). The latter phenomenon will be the main subject of the present thesis.
Different studies have shown that troughs at low latitudes are often parts of east- and southward propagating coherent Rossby wave trains from the extratropics (e.g., Kiladis and Weickmann 1992a). The propagation of such waves is usually described by lin- ear Rossby wave theory (Hoskins and Ambrizzi 1993), which requires mean westerly background flow for a penetration of stationary wave disturbances into the Tropics or even into the other hemisphere. Therefore this kind of interaction is most important on synoptic to sub-monthly time scales and is confined to tropical regions, where westerly background flow is prevalent. Such conditions are observed during the boreal cool sea- son over the Pacific and Atlantic Oceans. Hence, these regions have been referred to as
“westerly ducts” by Webster and Holton (1982).
One visible sign of these interactions is the formation of cloud bands that often develop
2 1 INTRODUCTION
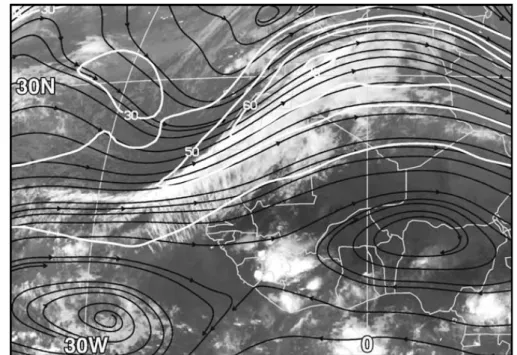
Figure 1.1:Meteosat IR satellite image at 00 UTC 1 April 2002 with superimposed isotachs at the 345 K isentropic level in white (m s−1) and streamlines in black from Knippertz and Martin (2005) their Fig. 3.
at the eastern flank of the troughs and extend from the Tropics pole- and eastward into the subtropics or even midlatitudes. Such bands of mid- and upper-level clouds are commonly referred to as Tropical Plumes (TP) (e.g., Iskenderian 1995). These situa- tions enable tropical moisture transport towards the subtropics, where they may lead to extreme precipitation events (Yoneyama and Parsons 1999, Fink and Knippertz 2003, Knippertz and Martin 2005, 2007a).
In Knippertz and Martin (2005) such an extreme rainfall event is described that af- fected Southern Morocco and Western Algeria in March/April 2002. The synoptic sit- uation of this event is visualized in Fig. 1.1. The main features are i) a pronounced upper-level trough located over the Atlantic reaching south-westward into the Tropics (Fig. 1.1/streamlines) and ii) east of the trough an elongated Tropical Plume (Fig. 1.1/IR image) accompanied by a strongsubtropicaljet (STJ) streak (Fig. 1.1/isotachs). Besides the detrimental effects of the heavy rainfall (i.e. damage by flooding), the event had also beneficial hydrological implications by refilling of local water reservoirs. This demon- strates the great relevance of such a single event for different socio-economic aspects (i.e. water supply, vegetation and agriculture) in an arid region like Northwest Africa (Fink and Knippertz 2003).
In addition to the effect on hydrological processes, further implications on the atmo- sphere related with the occurrence of troughs at low latitudes are observed:
• Low-latitude upper disturbances play an important role for the poleward transport of momentum and kinetic energy (e.g., Peixoto and Oort 1992), which underlies their relevance for the global and regional momentum balances (e.g. Kiladis and Feldstein 1994).
1.2 SCIENTIFIC BACKGROUND 3
• The global radiation budget may be affected by the formation of Tropical Plumes.
• The chemical composition of the atmosphere is influenced by this kind of inter- action due to the lateral mixing of stratospheric air, with low water vapour and high ozone, into the tropical upper troposphere (e.g., Wiegand 2008, Yoneyama and Parsons 1999).
In summary, upper-level disturbances are an important element of the general atmo- spheric circulation. Hence, investigations that focus on the occurrence, characteristics and impacts of this phenomenon, as done in this thesis, contribute to a more complete understanding of global atmospheric processes and may bring benefit to the population in the affected regions.
1.2 Scientific background
Various processes related to the equatorward propagation of upper-level troughs are de- scribed in detail in a recent review by Knippertz (2007). According to Knippertz (2007), observational studies in the literature that are concerned with the detection and analysis of extratropical-tropical interactions related to upper troughs at low latitudes, are com- monly based on one of three different approaches: (1) Identification of low-latitude dis- turbances on either streamfunction orpotentialvorticity (PV) fields; (2) satellite-based identification of Tropical Plumes and (3) correlations between convection anomalies and fields of streamfunction, wind or geopotential. Due to the great relevance for the present investigations these different approaches and their results are discussed in the following subsections. At the end of this chapter, studies that examined the impact on moisture fluxes and precipitation are discussed.
1.2.1 Identification and climatology of low-latitude troughs
Prior studies of tropical or subtropical upper-level disturbances are commonly based on analysis of either streamfunction on pressure levels or PV fields near the subtropi- cal tropopause. Within the PV framework (Hoskins et al. 1985; for further informa- tion about PV see Chap. 2.1.1), low-latitude disturbances are characterized by elongated tongues of positive anomalies in the upper tropospheric PV field indicating intrusions of stratospheric air downward into the tropical troposphere. An example is given in Fig. 1.2 from a study of Tomas and Webster (1994). The PV distribution on 345 K isentropic level in Fig. 1.2a exhibits amongst other features a strongly tilted tongue of positive PV values (> 2 PVU) extending from about 30◦N to the equator near 145◦W. In contrast, in the 200-mbgeopotentialheightdistribution (GPH) of the particular date (Fig. 1.2b) the distinct streamer can hardly be recognized, which is due to the general weak gradients in geopotential height at low latitudes. Thus, the example demonstrates that GPH fields are generally less suitable for investigations of tropical or subtropical disturbances.
4 1 INTRODUCTION (a) PV on 345-K
(b) 200-mb GPH
Figure 1.2:(a) Potential vorticity on the 345-K isentropic surface on 03 February 1984 based on ECMWF analysis. The contour interval is 1 x 10⁻⁶Km2kg−1s−1(= 1 PVU) with the±0.5 PVU contours added; the interval between 1 and 2 PVU is cross-hatched. (b) 200-mb geopotential height on the same day. The contour interval is 120 m and the interval between 1240 m and 12120 m is cross-hatched. Both figures are from Tomas and Webster 1994.
Using NCEP/NCAR reanalyses (Kalnay et al. 1996), Waugh and Polvani (2000) con- structed a 20-year climatology of intrusion events, which were defined as occurrences of high absolute PV values (|PV| > 2 PVU) at 10◦N or S on the 350-K isentropic surface. In this process all such occurrences within 10◦longitude or within 6 days (the typical life- time for events) were then grouped together as a single intrusion event. The example of a low-latitude PV streamer in Fig. 1.2a at 130◦W and 15◦N on the 345 K isentropic sur- face corresponds to their definition of an intrusion event. Waugh and Polvani found most intrusion events to occur over the central Pacific (180◦W-100◦W) and eastern Atlantic (50◦W-0◦) Oceans during northern winter in coincidence with the existence of westerly ducts (see Fig. 1.3). Furthermore, inter-annual variability in the frequency of Pacific events was observed in association with the El Niño/Southern Oscillation (ENSO, see Chap. 2.3). That means, the intrusion frequency in the central Pacific is reduced during warm ENSO phases (El Niño), consistent with ENSO-related alterations in the westerly
1.2 SCIENTIFIC BACKGROUND 5
Figure 1.3:Mean number of intrusion events per longitude between 1980 and 1999 from Waugh and Polvani 2000. The solid (unfilled) bars show northern (southern) hemisphere events. Curve corresponds to climatological equatorial zonal winds at 350 K averaged from 1980 to 1999 between December and February.
background flow.
Another PV-based climatology was generated for the Northern Hemisphere by Wernli and Sprenger (2007). Based on the 15-year reanalyses data set of the ECMWF (ERA-15) and using a contour searching method, they identified PV streamers and cut off structures in the 2-PVU (1PVU =10−6Km2kg−1s−1) contour, which represents the dynamical tropopause, on different isentropic surfaces. Above 320-K, Wernli and Sprenger (2007) found two frequency maxima of stratospheric PV streamers located over the subtropical North Atlantic and eastern North Pacific during northern winter. During summer, when the westerly ducts are absent, these maxima move to higher isentropic surfaces and shift north-westward, while the streamer frequency is quite constant year-round. Martius et al.
(2007) applied the same contour searching algorithm to the ERA-40 reanalysis data set.
They constructed a 44-year NH streamer climatology and thus frequency distributions comparable to the results of Wernli and Sprenger (2007) were achieved.
Since disturbances at low latitudes are often generated by breaking extratropical waves, other approaches consider rapid, large-scale and irreversible overturning of PV con- tours on isentropic surfaces in the subtropical upper troposphere (Postel and Hitchman 1999, Abatzoglou and Magnusdottir 2006b, Strong and Magnusdottir 2008) as evident in Fig. 1.2a over the NH Pacific between 180◦W and 130◦W. The 10-year climatology of Rossbywave-breaking (RWB) events by Postel and Hitchman (1999) based on global analyses from the ECMWF, reveals highest activity at 350-K during summer over the western parts of the ocean (Pacific and Atlantic) basins, in relative proximity to the sub- tropical high-pressure systems. These results are in agreement with the 46-year RWB (that they call ‘planetary wave breaking’) climatology of Abatzoglou and Magnusdottir (2006b) on the basis of daily averaged NCEP/NCAR reanalysis. Considering different isentropic levels, as done by Abatzoglou and Magnusdottir, reveals, that during boreal winter (DJF) these activity maxima shift to the Southeast and to lower isentropic levels
6 1 INTRODUCTION
in agreement with the PV streamer climatology of Wernli and Sprenger (2007). Further- more, Abatzoglou and Magnusdottir (2006b) found a strong correlation in boreal winter between the number of RWB events over the eastern Pacific and ENSO with higher RWB frequencies during the cold phases of ENSO (La Niña). These ENSO-related alterations in RWB occurrence are explained by the weaker eastern Pacific zonal flow observed during La Niña and consistent with the inter-annual variability of PV intrusion events of Waugh and Polvani (2000).
Nevertheless, comparing the discussed RWB climatologies with the PV intrusion cli- matology of Waugh and Polvani (2000), leads to the assumption that only RWB events during boreal winter tend to produce strong PV anomalies that reach into the upper- tropical troposphere.
Finally, some of these studies (e.g., Abatzoglou and Magnusdottir 2006a, Martius et al.
2007, Strong and Magnusdottir 2008) also analyzed variability in RWB or PV streamer occurrence in relation to further well-known modes of climate variability such as the NorthAtlanticOscillation (NAO) or thePacific/NorthAmerican pattern (PNA, for more information see Chaps. 2.3 and 2.3). For example in the study of Abatzoglou and Mag- nusdottir (2006b) a link between the RWB frequency over the central North Atlantic and the NAO, which describes a large scale seesaw in atmospheric mass between the sub- tropical high and the polar low over the North Atlantic, was found with enhanced RWB activity during a NAO-positive winter due to the poleward shift in the eddy-driven jet and the enhanced equatorward wave activity flux. Benedict et al. (2004) suggests even that anticyclonic wave breaking over North America and the North Atlantic is essential for the growth and maintenance of the positive NAO phase. Strong and Magnusdottir 2008 constructed a climatology of cyclonic and anticyclonic wave breaking and found that the influence of RWB on the polarity of the NAO is in dependence of the latitude of RWB occurence.
1.2.2 Identification and climatology of tropical plumes
Only the introduction of meteorological satellites in the 1960s and 1970s enabled com- prehensive observations and detailed descriptions of elongated cloud bands, that reach from the Tropics into the subtropics or even midlatitudes (e.g., Erickson and Winston 1972, Gray and Clapp 1978, Thepenir and Cruette 1981). In the past this phenomenon was named quite differently such as ‘cloud surges’, ‘tropical intrusions’, ‘cirrus surges’,
‘moisture bursts’ or ‘tropical plumes (TP)’. The latter denotation will be used in the present thesis. Furthermore it has to be mentioned, that all climatological studies of Tropical Plumes in the past (and described in this subsection) are based on visual in- spection ofinfrared (IR) satellite imagery.
Thepenir and Cruette (1981) constructed the first TP climatology with focus on cloud bands stretching from the east of the subtropical part of the Pacific Ocean to Western Europe. They subjectively detected 145 of such cloud bands during the 3-year period from 1976 to 1978. The bands vary in length from 4000 to 16.000 km, in widths from
1.2 SCIENTIFIC BACKGROUND 7 400 to 1200 km and have life spans from 3 to 9 days. Most TPs are detected between November and April (on average nearly 6 events per month) with a clear frequency maximum in December. TP genesis was observed commonly over the subtropical ocean between 5° and 25°N and 100° and 160°W and was linked to the occurrence of an upper- level trough with a NE-SW axis extending southward over the Pacific Ocean and to the development of a strong subtropical jet streak along the south-eastern flank of this trough (Thepenir and Cruette 1981). In 70% of all cases the cloud band embryo is related to convection of theIntertropicalConvergenceZone (ITCZ). Further details on latitudinal or longitudinal distribution of TP occurrence are not given in this work.
The first objective definition for Tropical Plumes was given by McGuirk et al. (1987).
Hereby a Tropical Plume (that they name ‘moisture bursts’) is defined as a continuous band (i) of upper- or midlevel clouds that is (ii) at least 2000 km in length and (iii) crosses the latitude of 15°N. Based on this definition, they identified cloud bands over the central and eastern North Pacific in the three 6-month cool seasons (November to April) of 1975/76, 1977/78 and 1981/82. On average about 10 events per month were detected equally distributed over the North Pacific between 160°E and 110°W and with lifetimes from 0.5 and 10 day (average lifetime: 2.5 days). A maximum in plume activ- ity is observed in November and April and a relative minimum from February to March.
Furthermore they observed a distinct reduction in plume activity during the El Niño cool season 1982/1983 with the location of occurrence shifted eastward.
The only global TP (termed ‘tropical-extratropical cloudbands’/TECBs in this study) climatology was generated by Kuhnel (1989) for the 5-year time period 1979 to 1983 based on an objective TP definition according to which a cloud band is required to have (i) its origin between the Equator and 20◦N, (ii) a length of at least 25◦longitude, (iii) a maximal width of at least 5◦ latitude, (iv) a diagonal alignment, crossing at least 10◦ latitude and (v) a homogeneous texture. In contrast to the above-described studies, Kuh- nel considers days with TP occurrence instead of single TP systems with beginning and ending times. As a result of the study, 14 different tropical zones (seven in each hemi- sphere) were subjectively defined as areas of TP origin (Fig. 1.4). The mean monthly TP frequencies of these regions range from 13 days of TP occurrence over the central South Pacific to 0.65 days over the northern Indian Ocean detected during the 5-year investigation period. The pronounced frequency maximum in the central South Pacific is caused by the quasi-permanent and quasi-stationary cloud bands of theSouthPacific ConvergenceZone (SPCZ) (e.g., Kodama 1992, 1993, Vincent 1994), that sometimes, especially during austral summer, continuously satisfy Kuhnel’s TP definition for weeks.
Similar observations of quasi-stationary, warm-season cloud bands are made in the South Atlantic (with origin area over South America) related to theSouthAtlanticConvergence Zone (SACZ) and in the northwestern Pacific (Kodama 1992, Kodama 1993). McGuirk et al. (1987, p. 789) suggests to consider these quasi-stationary cloud bands as a differ- ent sort of meteorological phenomenon compared to the short-lived, transient TPs of the cold seasons. The latter type of TP will mainly be focused on in this thesis. Regard- ing the cool season climatology of Kuhnel, high TP activity is found in the NH over the eastern Pacific and Atlantic Oceans with occurrence maxima in October/November.
8 1 INTRODUCTION
Figure 1.4:Mean monthly tropical plume frequency [number of days with TP occurrence] of the 14 de- fined regions with TP origin between 1979 and 1983 from Kuhnel (1989). Lighter/darker grey boxes label cool/warm season TP frequencies. NH/SH cool/warm season is Oct. to March.
NH/SH warm/cool season is April to Sept.
According to Kuhnel, TP development in these regions is associated with intrusions of extratropical air masses into low latitudes. A reduction in TP occurrence is observed during the 1982/83 El Niño event in the eastern North Pacific similar to the results of McGuirk et al. (1987).
Iskenderian (1995) generated a 10-year cool season (Oct.-May) climatology of tropical cloud plumes in the NH between 1974 and 1984. The TP identification of this study was based on a definition similar to that applied in McGuirk et al. (1987). Only the required distance to the equator was changed to 20◦N. The climatology reveals two pre- ferred subtropical regions in the NH for TP occurrence: The (i) eastern North Pacific (120◦-180◦W) with 40 TPs per season on average and the (ii) eastern North Atlantic (20◦-60◦W) with 21 TPs on average per season. The mean TP duration is 2.7 days. Fur- thermore, Iskenderian (1995) observed a relative minimum in plume activity in February and March and a lack of eastern Pacific TPs during the 1982/83 El Niño season. Both results are in agreement with the observations of McGuirk et al. (1987) and Kuhnel (1989). Another notable feature, found by Iskenderian (1995), is an overall tendency for above (below) normal seasons in the eastern Pacific to be balanced by below (above) normal seasons in the Atlantic region.
1.2.3 Relationship between upper troughs and convection/TPs
Several studies have linked the propagation of upper-level troughs into low latitudes with the occurrence of deep convection in tropical and subtropical regions and vice versa (e.g., Liebmann and Hartmann 1984, Kiladis and Weickmann 1992a, 1992b, Kiladis 1998, Slingo 1998, Matthews and Kiladis 1999b, Waugh and Funatsu 2003). Most of these studies used time-averaged, composited or filtered anomalies inoutgoinglongwave radiation (OLR) as an indicator for enhanced tropical cloudiness.
Liebmann and Hartmann (1984) for example, compared NH wintertime five- and ten-day
1.2 SCIENTIFIC BACKGROUND 9
Fig. 4. Relationship between outgoing longwave radiation (OLR) anomalies over the tropical eastern Pacific and waveFigure 1.5:6–14-day anomalies in OLR, 200 hPa streamfunction and locally significant wind vectors for a -1 standard deviation in OLR at the base region of 5◦N–15◦N, 140◦W–130◦W (black framed box). The contour interval is 10 x 105m2s−1, with the zero contour omitted. The largest wind vectors are about 5 m/s. Shading outlines regions of OLR anomaly less than -6 W/m2. The investigation period is December–February 1983/1984–1987/88. (From Kiladis and Weickmann 1992a.)
average tropical OLR anomalies with anomalies in midlatitude 500 hPa geopotential height to search for relationships between tropical and midlatitude circulation pattern.
The strongest relationship was found over the Pacific (east of the date line) and the cen- tral Atlantic between a trough in the 500 hPa GPH and enhanced tropical cloudiness (10◦N–15◦N) to the Southeast. The trough tends to precede the signal in tropical cloudi- ness and displays a southwest-northeast tilt, which points to an equatorward propagation of wave energy.
Kiladis and Weickmann (1992a) examined wintertime 6-14-days filtered 200 hPa stream- function anomalies associated with an area-averaged OLR of – 1 standard deviation at different base regions in the Tropics. The strongest signal was received for a base re- gion located in the eastern Pacific between 140◦W-130◦W and 5◦N-15◦N. These results are presented in Fig. 1.5. The streamfunction anomalies reveal a northwest-southeast- oriented wave train with a pronounced positive tilt (i.e. southwest-northeast titled dis- turbances) stretching from East Asia across the North Pacific. Circulation anomalies associated with OLR anomalies at base regions in the tropical North Atlantic show sim- ilar patterns with somewhat weaker signals (Kiladis and Weickmann 1992b their Fig. 3).
Lead-lag correlations reveal a southeastward propagation of the wave trains (Kiladis and Weickmann 1992b, their Fig. 2). Iskenderian (1995) constructed a composite of the 200 hPa streamfunction anomalies for 41 tropical plumes over the tropical North Pacific with origin between 120◦W and 150◦W (cp. Section 3.2). The anomaly pattern displays a wave train extending across the Pacific and through the plume origin region with a northwest to southeast orientation and a positive tilt similar to the results of Kiladis and Weickmann (1992a). Another approach is applied by Waugh and Funatsu (2003) based on PV intrusion events over the North Pacific (180◦W-100◦W), as detected in the study by Waugh and Polvani (2000) (see Sec. 3.1). Composites of 350-K PV and OLR were
10 1 INTRODUCTION
Figure 1.6:Phase-shifted composite mean 350-K PV (thick contours) and OLR south of 30◦N (light contours and shading) of North Pacific events. Contour interval for PV is 1 PVU, and 20 W/m2 for OLR (shaded region shows OLR less than 240W/m2). All events have been shifted to the reference longitude at 140◦W. (From Waugh and Funatsu 2003.)
constructed by averaging over all intrusion events after shifting the PV tongue to the reference longitude of 140°W (see Fig. 1.6). The PV composite reveals a narrow tongue of high PV values at 140°W with an almost north-south orientation. Along the eastern edge of the PV tongue an area of low OLR values occurs that has a length of almost 2000 km and crosses 20°N, and thus resembles a tropical plume.
In summary, all studies presented in this subsection emphasize the close (statistical) linkage between Rossby wave activity, tropical convection and TP formation. However, there exist different hypothesis about the physical processes leading to this connection.
According to some early studies (e.g., McGuirk et al. 1988, Kiladis 1998), convec- tion associated with Tropical Plumes is triggered by quasi-geostrophically forced ascent ahead of the PV trough and reduced vertical stability within and below the anomaly.
In another conception, Blackwell (2000) demonstrated based on experiments with a dry barotropic shallow water model of the upper troposphere, that TP-like circulation could be initiated by convergent forcing in the eastern part of the climatological ridge over the central Pacific. It is suggested, that the convergent forcing is caused by large-scale cold advection and subsidence in association with extratropical wave train activity. In the model experiments the advection of cyclonic vorticity through the convergent winds leads to an amplification and zonal contraction of the trough downstream of the ridge, whereby subtropical air masses are accelerated toward the deep Tropics. In the deep Tropics the flow decelerates, then sharply turns cyclonically and accelerates back into the extratropics, forming an anticyclonically curved downstream STJ streak. Blackwell (2000) concludes, that moist convective processes are negligible for the generation of TP-like circulation patterns.
Another dynamical concept for tropical plume genesis is proposed by Mecikalski and Tripoli (1998) that views tropical plumes as the upper branch of a thermally direct cir-
1.2 SCIENTIFIC BACKGROUND 11 culation driven by latent heat released along the ITCZ. Due to the fact, that in their observations the TP genesis region is relatively remote from the upper trough, they sug- gest in contrast to tradionally held views a rather indirect influence of the Rossby wave on plume genesis process. Further on they argue that the associated quasi-geostrophic forcing does not go down enough into the troposphere due to the small Coriolis parame- ter at low latitudes. In the concept of Mecikalski and Tripoli (1998) convection responds to the changes in inertial stability caused by southwesterly advection of low potential vorticity (PV) to the east of the midlatitude Rossby wave.
Finally, most studies agree on the fact, that poleward advection of convectively gener- ated cirrus from the ITCZ by the strong winds ahead of the PV trough plays an important role in the TP generation. Nevertheless observed wind speeds at the outflow level do not always correspond to the progression rates of the TP cloud formation. This leads to the assumption that TP cloud formation is based on both development and advection (McGuirk et al. 1987, 1988).
1.2.4 Impacts on moisture fluxes and precipitation
Different studies have shown that the occurrence of troughs at low latitudes induces pole- ward moisture fluxes that transport tropical moisture into the subtropics (e.g., Bates et al.
2001, Waugh 2005, Ryoo et al. 2008), where they occasionally lead to extreme precipi- tation events in subtropical regions (e.g., Ziv 2001, Fink and Knippertz 2003, Knippertz and Martin 2005, Knippertz and Fink 2009, Meier and Knippertz 2009, ?,). Poleward moisture fluxes in tropical regions are in contrast to the climatological mean equator- ward moisture transport of the Hadley cell (Peixoto and Oort 1992). In the typically dry subtropical atmosphere these moisture fluxes are important due to the relatively large changes in the clear-sky outgoing longwave radiation.
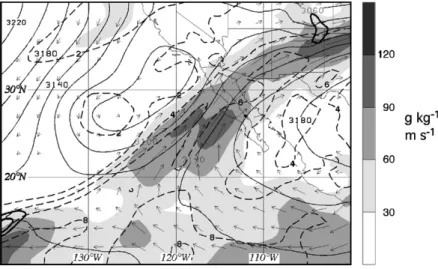
In a case study of Knippertz and Martin (2007a) the moisture transport of an upper-level cut-off low resulting from a wave-breaking event over the subtropical North Pacific in November 2003 is analysed. Fig. 1.7 shows the geopotential height (solid lines), mi- dlevel poleward moisture export (shading) and mixing ratio (dashed lines) from this event at 700 hPa pressure level. East of the cut-off low (centre of cut-off low located near 30◦N, 123◦W) an elongated, narrow band of relatively large water vapour fluxes stretches from the northern edge of the tropical moisture reservoir north-eastward into the southern USA. The mixing ratio reveals a sharp contrast between the moist air of the tropical reservoir and the transport region in the subtropics, and the dry subtropical air masses northwest of the cut-off low.
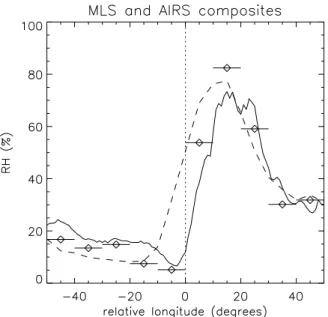
Waugh (2005) examined, for example, the impact of intrusions of high PV air into the tropical upper troposphere on subtropical humidity using satellite measurements of water vapour from two different instruments, the Atmospheric InfraredSounder (AIRS) and MicrowaveLimbSounder (MLS). They constructed composite-meanrelativehumidity (RH) fields for PV intrusion events over the northern Pacific, which were identified in a similar manner to Waugh and Polvani (2000) (see Chapt. 3.1) with slightly modified
12 1 INTRODUCTION
Fig. 10. Example of a moisture conveyor belt over the eastern Pacific at 12 UTC 11 November 2003. Solid isopleths
Figure 1.7:Example of a moisture conveyor belt over the eastern Pacific at 12 UTC 11 November 2003.
Solid isopleths depict geopotential height every 20 gpm and dashed isopleths mixing ratio ev- ery. Vectors and shading show water vapour flux. The vertical level is 700 hPa. The employed data come from a simulation of the event using the University of Wisconsin Nonhydrostatic Modelling System. (From Knippertz 2007.)
thresholds (PV > 2.5 at 17.5◦). Before averaging the RH fields the intrusion events were shifted so that all intrusions occurred at the same longitude (150◦W). The composite fields for the AIRS and MLS measurements are shown in Fig. 1.8. Both data sets show large gradients in humidity in the vicinity of the intrusions, with very dry air within the intrusions and very moist air ahead (east) of the intrusion. They argue, that the combina- tion of convection and poleward flow ahead of the PV intrusion rapidly transports lower tropospheric air into the subtropical upper troposphere. Trajectory-based water vapour simulations support their argumentation.
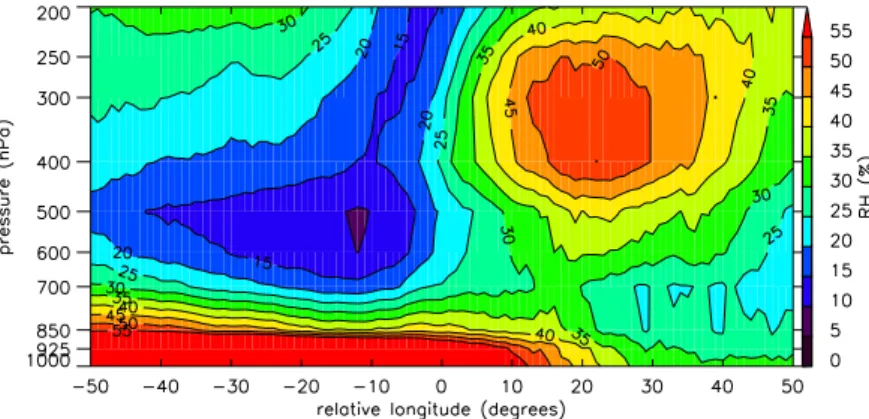
Ryoo et al. (2008) extended the investigations of Waugh (2005) by considering a longer time series of AIRS satellite measurements. In this study variability of subtropical humidity during winter is mainly focused on three different regions (Pacific, Atlantic and Indian Ocean). Fig. 1.9 shows the relative longitude versus height cross section of composite-mean relative humidity for intrusion systems in the North Atlantic (80◦W–
0◦). This composite is constructed by shifting the intrusion systems to a reference longi- tude of 0◦before averaging. The pattern reveals high RH east of the PV intrusions and low RH west and within the intrusions. Even though the high PV is confined to the upper troposphere (not shown), high RH values to the east of the trough are observed down to below 400 hPa.
In a study of Bates et al. (2001) the inter-annual variability of satellite-derived tropical upper-tropospherichumidity (UTH) between 1979 and 1998 is analysed and compared with transient eddy activity (estimated on the basis of 200 hPa winds according to Kiladis (1998)). In agreement to the results above, they hypothesize that the vertical and hori- zontal motions associated with equatorward propagating Rossby waves advect moisture both vertically and horizontally, moistening the normally dry subtropics. In the central and eastern North Pacific this moistening is greatly enhanced during the ENSO cold event of 1989/90 and reduced during the ENSO warm event of 1982/83. Their investiga-
1.2 SCIENTIFIC BACKGROUND 13
fields for PV intrusion events over the northern Pacific.
[2000]:
N (as N in Waugh and Polvani) longitude or
during the MLS period (January – February 1992 to 1994)
calculated for the central day of these events. To account for composites, the fields were shifted in longitude so that all
] Figure 4 confirms that there is low RH to the west (behind) and high RH (ahead) to the east of PV intrusions.
the MLS and AIRS measurements, with both data sets
Figure 1.8:Longitudinal variation of the composite-mean RH for north Pacific intrusion events in Jan- uary–February, for AIRS (solid curve) and MLS (dashed curve) measurements in 2003–2004 and 1992– 1994, respectively. Diamonds and horizontal lines show MLS composite using individual profile data rather than gridded data. Longitude is relative to longitude of the PV intrusion (vertical dotted line). (From Waugh 2005.)
tions emphasize also the relationship between variations in the mean equatorial westerly winds, in eddy activity and in the tropical UTH.
The moisture transport in association with equatorward propagating Rossby waves may lead to exceptional precipitation events away from the tropical moisture reservoir region near the ITCZ. For example, the poleward water vapour export in association with the cut-off low event in Fig. 1.7, provided the moisture for a significant precipitation event in the dry southwestern United States (Knippertz and Martin 2007a). Knippertz and Martin (2005) investigated in another study three cool season events of unusual heavy precipitation in tropical and subtropical West Africa, using observational data and high- resolution output from modelling simulations. Common characteristics of all three cases are an upper-level trough to the west of West Africa, a strong subtropical jet streak and a Tropical Plume. Furthermore, all cases show poleward moisture export from the tropical source regions similar to the case study depicted in Fig. 1.7.
Hart et al. (2010) discussed in detail three events of heavy rainfall over southern Africa.
Similar to tropical-extratropical interactions in other regions, the synoptic evolution of these events was characterized by a tropical cloud band and poleward moisture fluxes along the leading edge of an upper-tropospheric westerly wave trough.
A 23-year climatology oftropicalmoistureexport (TME) was constructed by Knippertz and Wernli (2010) on the basis of trajectory analysis that is applied to the ERA-40 data set. A trajectory that starts in the tropical lower troposphere and reaches a water vapour flux of at least 100gkg−1ms−1 somewhere north of 35°N within seven days or less is defined as TME. The resulting TME climatology shows two distinct activity maxima during boreal winter (Dec.-Feb.) located over the central and eastern Pacific (“pineap-
14 1 INTRODUCTION
Figure 1.9:Vertical cross sections of composite RH for intrusions in the North Atlantic (80◦W – 0◦).
Relative longitude is the longitude relative to central longitude of the PV intrusions. (From Ryoo et al. 2008.)
ple express”) and over the western North Atlantic. The inter-annual TME variability is significantly influenced by ENSO in this way that during the warm phase of ENSO (El Niño) less (more) TME events are observed over the eastern North Pacific (west- ern North Atlantic). Knippertz and Wernli (2010) explain these differences by ENSO- induced changes in the frequency of transient upper disturbances in these regions. Fi- nally they found, that TME contributes up to 60% to climatological precipitation in the southern midlatitudes.
However, trajectory analyses by Knippertz and Martin (2007b) reveal that the midlevel moisture transport from the deep Tropics is often to slow, to generate extensive preci- pitation. The authors assume that only a persistent disturbance or two disturbances in short succession are able to produce significant rainfall. This observation may explain the rare occurrence of such extreme events.
In another concept, narrow bands of enhanced water vapour flux are termed atmospheric rivers (e.g., Zhu and Newell 1994, 1998, Ralph et al. 2004, Bao et al. 2006, Neiman et al.
2008) due to the great amount of water that is transported by these bands. Atmospheric rivers are responsible for most (> 90%) of the poleward water vapour transport outside of the Tropics at only about 10% of the total longitudinal length at a given latitude (Zhu and Newell 1998, Ralph et al. 2004). Atmospheric rivers are typically situated near the leading edge of polar cold fronts and are often associated with heavy rainfall events and flooding in the affected regions. Although these bands of enhanced moisture fluxes may transport an considerable amount of water vapour from the tropical moisture reservoir into the extratropics, these atmospheric rivers are rather an extratropical phenomenon.
Meier and Knippertz (2009) analysed an exceptionally heavy precipitation event in Jan- uary 2002 of Cap Verde region in tropical West Africa. The rainfall was triggered by a series of two upper-level disturbances penetrating from the extratropics to the West African coast. In this study several sensitivity experiments based on modelling simula- tions were conducted to identify the dynamical precursors, which lead to the upper-level wave amplification and the observed precipitation rates. As a result of this study a reser- voir of high PV over the North Atlantic and a PV ridge over Europe are found to be
1.3 AIMS AND OUTLINE 15 essential precursors for the development of such a heavy rainfall event over West Africa.
1.3 Aims and outline
The main subject of this thesis is to improve the understanding of extratropical-tropical interactions related to upper-level disturbances that propagate from the extratropics into the Tropics. Embedded within this general goal the present thesis consists of two main parts, focusing on the detection, climatology and impacts (i) of upper-level troughs at low latitudes and (ii) of Tropical Plumes.
For that purpose the first step was the development of a new identification algorithm for upper-level troughs at low-latitudes (in the following often referred to as intrusions) in the ERA-40 reanalysis data set. Compared to prior studies (e.g., Waugh and Polvani 2000, Wernli and Sprenger 2007), the new algorithm analysesverticallyaveragedPoten- tialVorticity (VAPV) fields of the upper troposphere rather than PV data on individual isentropic surfaces. A main advantage of this new data basis is that only systems with a coherent signal throughout the upper troposphere are identified, which points to rather intensive systems. In addition this procedure enables a classification of the intrusion systems by their vertical thickness (defined by the lowest vertical level of the 1.5 PVU surface within the intrusion system), which is assumed to be an indicator for the inten- sity of the system. Another novelty is the implementation of a simple tracking routine for the identification of intrusion episodes. A detailed description of the data sets and methodology is provided in Chapter 2 and 3 together with an illustrative example.
Applying the new algorithm to the ERA-40 reanalysis data set, a 22-year climatology of low-latitude troughs was constructed. The geographical and seasonal distributions of the identified intrusion systems are presented and compared to results from former studies in Chapter 4. This chapter also includes a sensitivity test to examine the robustness of the results. Intrusion characteristics such as life time, vertical extent and horizontal tilt are statistically evaluated in Chapter 5. The intrusion time series are analysed in terms of trends, inter-annual variabilities and their association to ENSO in Chapter 6. Based on composite studies the typical evolution of intrusion systems in the tropical upper tro- posphere is evaluated in Chapter 7 and their impact on water vapour fluxes is presented in Chapter 8.
In the second part of this thesis a novel climatology of Tropical Plumes is presented.
This climatology is constructed with the first objective algorithm for the detection of Tropical Plumes. The development of such an algorithm allows a quick identification of TPs for a longer time period in comparison to previous TP climatologies that are all based on a subjective detection by visual inspection of satellite IR imagery. The data set and the algorithm used for TP identification are described in detail in Chapter 2 and 3.
Applying the TP identification algorithm to the CLAUS brightness temperature data set, a 23-year climatology of TPs is constructed. The resulting geographical and seasonal TP distributions are presented and compared to result from former studies in Chapter 9. In
16 1 INTRODUCTION
this chapter the sensitivity of the algorithm to the implementation of the LWR criterion is assessed and the robustness of the results is discussed. TP characteristics such as life time, length-to-width ratio and horizontal tilt are statistically evaluated in Chapter 10. In Chapter 11, the time series of seasonal TP frequencies are examined in terms of trends and inter-annual variabilities and their association to ENSO. Based on composite studies the circulation anomalies in the upper troposphere in relation to TP occurrence is evalu- ated in Chapter 12. In this chapter a brief comparison of both climatologies is presented to analyse the relationship between low-latitude trough and TP occurrence.
Finally, in Chapter 13 all results are summarized, discussed and open questions and future prospects are presented.
2 Data
2.1 ERA-40 reanalysis
In the present study investigations of upper-level troughs at low latitudes are mainly based on ERA-40 reanalysis data (Uppala et al. 2004). This data set is generated at the EuropeanCentre for Medium-Range Weather Forecasts (ECMWF) and describes the state of the atmosphere at a spectral resolution of T159 on 60 vertical levels up to 1 hPa every six hours from September 1957 to August 2002. Observational data from different sources and model data from a short-range numerical weather forecast were combined by the three dimensional variational data assimilation system (3D var) to generate the ERA-40 reanalysis data set. In this process the assimilation system and the numerical weather forcast model is unchanged throughout the entire time period to reduce inho- mogeneities in the data set which are caused by variances in the analyses techniques.
For long-term studies consistent time series are essential. Nevertheless inhomogeneities due to changes in instrumentation, measurement techniques or observational practices remain in the data set.
For the present investigations the required fields were interpolated onto a 1◦x1◦ latlon grid. Only the period from January 1980 to December 2001 is considered, since the change to a more space-based observing system during this time has produced a more consistent data set, especially over tropical regions where conventional observations are rare (Bengtsson et al. 2004).
2.1.1 Ertel’s Potential Vorticity
Sincepotentialvorticity (PV) is a frequently used term in this thesis, some background information will be given in this subsection.
18 2 DATA
In an isentropic coordinate system PV is defined by Ertel (1942) as PV = (ζθ+f)
−gδθ δp
(2.1) whereζθ is the vertical component of the relative vorticity on an isentropic surface, f the Coriolis parameter (planetary vorticity) and θ the potential temperature. Potential vorticity is commonly given in PV Units (1PVU =10−6Ks−1kg−1m2).
The climatological distribution of PV is characterized by positive values in the Northern Hemisphere, zero at (or near) the equator and negative values in the Southern Hemi- sphere. PV generally increases polewards and with height. In the upper troposphere, maximum values are typically below 2 PVU. For this reason the 2-PVU isosurface is often used as the dynamical tropopause. Above the tropopause PV increases rapidly due to the significant increase in static stability.
With the assumption of adiabatic and frictionless flow the PV of an air parcel is a con- served parameter. Therefore PV can be used as a tracer for movement of air parcel (Hoskins et al. 1985), which makes it a comprehensive tool to analyse e.g. synoptic- scale weather systems. The importance of PV for the present work is the fact that merid- ional transport of air masses in the upper troposphere leads to a positive (negative) PV anomaly as high (low) polar (equatorial) PV values advect. Furthermore, according to the invertibility principle (Eliassen and Kleinschmidt 1957, Hoskins et al. 1985) a pos- itive PV anomaly on an isentropic surface near the tropopause will induce a cyclonic circulation. This circulation is strongest near the level of the anomaly and weakens be- low this level. Furthermore, the strength of the induced circulation anomalies depends on the vertical depth of the upper disturbances, that propagates equator- or poleward.
The PV calculations in this work were based on the ERA-40 three dimensional fields of temperature (T), u (U) and v (V) wind components and the two dimensional field of surface pressure (SP) (needed for the transformation onto pressure levels). At first the calculations have been accomplished on the original hybrid model levels. Finally, the PV fields in the upper troposphere were interpolated on pressure levels from 100 to 400 hPa (separated by 50 hPa) and smoothed by a 9-point interpolation with the neighbouring grid points.
Rossby wave and PV streamer
Another two frequently used terms in this thesis are “Rossby wave” and “PV streamer”, which are briefly defined here. Rossby waves are wave disturbances of the westerly flow, that propagate along the tropopause and were first described by Rossby (1940). In a PV perspective, Rossby waves are synoptic-scale perturbations on an isentropic surface near the tropopause (Hoskins et al. 1985). A Rossby wave train is a series of Rossby waves travelling nearly with the same velocity in the same direction.
The term “PV streamer” is used in the text (as an equivalent for the term PV intrusion) for an elongated and narrow intrusion of stratospheric air (with high PV values≥2) de-
2.2 CLAUS BRIGHTNESS TEMPERATURE 19 scending equatorward into the troposphere (Appenzeller et al. 1996). An illustrative example is given in Fig. 1.2 from a study of Tomas and Webster (1994).
2.2 CLAUS Brightness Temperature
Analysis of Tropical Plumes are based on the brightness temperature (Tb) dataset of the Cloud Archive User System (CLAUS)1. This dataset is derived from 10 µm radi- ances (Hodges et al. 2000) measured by divers operational meteorological satellites (geostationary and polar orbiters) that participate in the International Satellite Cloud ClimatologyProgramme (ISCCP)2and were obtained from the NASALangleyAtmos- pheric Sciences Data Center (LASDC)3. The CLAUS Tb data set currently spans a time period from July 1983 to June 2006 and is available on a global uniform latitude- longitude grid at a spatial resolution of 0.5 by 0.5 degrees and a temporal resolution of three hours.
Brightness temperature is defined as the temperature of a blackbody that emits the same intensity as measured at a given wavelength (Planck’s law). The real temperature is usu- ally somewhat higher than the measuredTb. Observed from a satellite, cold cloud top surfaces are characterised by lower Tb values compared to cloud-free land or sea sur- faces. Higher cloud tops are indicated by lower temperatures. The analysis of brightness temperature is a commonly used method to separate cloudy from clear sky areas (e.g., Inoue 1987, Saunders and Kriebel 1988, Ackerman et al. 1990). A disadvantage of this method is, that information about the cloud distribution below the cloud top surface can not be obtained.
Figure 2.1:Global meanTb[K] distribution averaged between July 1983 and June 2006 from CLAUS.
The climatological meanTbvalues (averaged from July 1983 to June 2006) are globally depicted in Fig. 2.1. TheTb distribution is mainly characterized by (i) maximum values
1http://badc.nerc.ac.uk/data/claus/
2http://isccp.giss.nasa.gov
3http://eosweb.larc.nasa.gov/
20 2 DATA
in the subtropics (over the northern African continent/Arabian Peninsula and over the oceans related to the mean subtropical high pressure systems), (ii) a decrease from the Subtropics towards the poles and (iii) by lower values in the Tropics near the seasonal mean ITCZ. Hence, the seasonal cycle of the Tb distribution depends strongly on the inner-annual changes of the position of the mean subtropical high pressure systems and the ITCZ.
2.3 Climate state indices
Inter-annual climate variability in the time series of the detected low-latitude troughs and tropical plumes are analysed in chapter 6 and 11 with emphasis on fluctuations associated with different climate state indices. The regarded indices and their data sources are briefly described in this subsection.
El-Niño-Southern Oscillation
TheElNiño/SouthernOscillation (ENSO) is a variation of the atmosphere-ocean system in the tropical Pacific region on an interannual time scale (period: 2–7 years) with major impacts on the global weather. El Niño (La Niña), the so called warm (cold) phase of the oscillation, is associated with warmer (cooler) than normalseasurfacetemperatures (SSTs) in the equatorial Pacific Ocean (e.g., Trenberth 1997). The phenomenon is de- scribed by various atmospheric and oceanic indices. A common index is the Niño3.4 index, which is the average sea surface temperature anomaly in the region 5°S to 5°N and 120°W to 170°W. Five-month running means of SST anomalies in the Niño3.4 re- gion above/below +/- 0.4 ◦C for at least six consecutive months are commonly chosen to indicate El Niño/La Niña years (Trenberth 1997). The classification of ENSO phases used in this study is based on this definition and the resultant 6 El Niño and 5 La Niña winter seasons within the investigation period from 1980 and 2001 are listed in Tab. 2.1.
Additionally theSouthernOscillationIndex (SOI) is analysed, which describes the state of ENSO on a more large-scale and ocean-atmosphere coupled perspective. The SOI is calculated from monthly fluctuations in the air pressure difference between Tahiti and Darwin, Australia. Thereby negative (positive) values are associated with above (below) normal values of sea surface temperature in the equatorial central and eastern Pacific Ocean. Monthly SOI data is downloaded from theClimatePredictionCenter4(CPC).
North Atlantic Oscillation
TheNorthAtlantic Oscillation (NAO) is a large-scale seesaw in atmospheric mass be- tween the subtropical high pressure system located near the Azores in the Atlantic Ocean and the sub-polar low pressure system near Iceland with significant influence on the
4http://www.cpc.ncep.noaa.gov/data/indices/soi
2.3 CLIMATE STATE INDICES 21 El Niño La Niña
1982/1983 1984/1985 1986/1987 1988/1989 1987/1988 1995/1996 1991/1992 1998/1999 1994/1995 1999/2000 1997/1998
2002/2003
Table 2.1:Listing of El Niño and La Niña winter seasons between 1980 and 2006 as defined by the SSTs in the Niño 3.4 region and exceeding threshold from Trenberth (1997).
weather and climate in the North Atlantic region and surrounding continents includ- ing Europe (e.g., Wallace and Gutzler 1981, Barnston and Livezey 1987). The daily and monthly NAO indices used in this study are obtained from the Climate Prediction Center 5. The daily NAO index is constructed by projecting the daily 500mb height anomalies over the Northern Hemsiphere onto the first leading mode of rotatedEmpirical OrthogonalFunction (EOF) analysis of monthly mean 500mb height during 1950-2000 period6. The NAO is usually detected by differences in the normalized mean sealevel pressure (MSLP) anomalies between both centres of the pressure dipole (e.g., Hurrell 1995). However, in this study the considered NAO index is derived from 500mb geopo- tential height anomalies in consistence with the PNA index (see next Section 2.3) that is usually detected in the 500mb GPH fields.
Pacific/North American Pattern
ThePacific/NorthAmerican teleconnection pattern (PNA) is another prominent statis- tical mode of low-frequency variability in the Northern Hemisphere extratropics with four centres of action. It is characterized by height anomalies of similar sign located south of the Aleutian Islands and over the southeastern United States and opposite height anomalies located in the vicinity of Hawaii, and over the inter-montane region of North America (e.g., Wallace and Gutzler 1981). The daily and monthly PNA index obtained from CPC and used in this study is based on daily PNA indices which are computed by projecting the daily 500mb height anomlies onto the second leading mode of a rotated EOF analysis of the monthly mean 500mb height from 1950 to 20007.
5http://www.cpc.noaa.gov/products/precip/CWlink/pna/nao.shtml
6http://www.cpc.ncep.noaa.gov/products/precip/CWlink/pna/nao_index.html
7http://www.cpc.ncep.noaa.gov/products/precip/CWlink/pna/pna_index.html
![Figure 2.1: Global mean T b [K] distribution averaged between July 1983 and June 2006 from CLAUS.](https://thumb-eu.123doks.com/thumbv2/1library_info/3694006.1505700/33.892.228.617.711.961/figure-global-mean-distribution-averaged-july-june-claus.webp)
![Figure 4.1: Mean intrusion frequency [%] (shaded) and mean zonal wind at 200 hPa [m/s] (dashed con- con-tours for westerlies and dotted concon-tours for easterlies with the zero contour in bold) for (a) NH winter (b) NH summer for the period 1980–2001](https://thumb-eu.123doks.com/thumbv2/1library_info/3694006.1505700/54.892.158.778.135.590/figure-intrusion-frequency-shaded-dashed-westerlies-easterlies-contour.webp)
![Figure 4.2: Boreal winter (black) and summer (grey) mean intrusion frequencies [%] per region for the period 1980–2001](https://thumb-eu.123doks.com/thumbv2/1library_info/3694006.1505700/55.892.193.654.189.484/figure-boreal-winter-summer-intrusion-frequencies-region-period.webp)
![Figure 4.3: Monthly mean intrusion frequencies [%] per region for the period 1980–2001](https://thumb-eu.123doks.com/thumbv2/1library_info/3694006.1505700/56.892.175.747.137.470/figure-monthly-mean-intrusion-frequencies-region-period.webp)
![Figure 4.4: Mean intrusion frequency [% ] (shaded) detected with a modified identification algorithm us- us-ing ± 3 PVU between 22 ◦ N and 22 ◦ and mean zonal wind at 200 hPa [m/s] (dashed contours for westerlies and dotted contours for easterlies with the](https://thumb-eu.123doks.com/thumbv2/1library_info/3694006.1505700/57.892.128.744.601.1042/intrusion-frequency-detected-modified-identification-algorithm-westerlies-easterlies.webp)
