Axel Sonntag
1and Daniel John Zizzo
2September 2014
Abstract
A ‘collusion puzzle’ exists by which, even though increasing the number of firms reduces the ability to tacitly collude, and leads to a collapse in collusion in experimental markets with three or more firms, in natural markets there are such numbers of firms colluding successfully.
We present an experiment showing that, if managers are deferential towards an authority, firms can induce more collusion by delegating production decisions to middle managers and providing suitable informal nudges. This holds not only with two but also with four firms.
We are also able to distinguish compliance effects from coordination effects.
Keywords: Collusion, Cournot, oligopoly, authority, delegation, coordination.
JEL Classification: L13, L22, C91.
1 Centre for Behavioural and Experimental Social Science (CBESS) and School of Economics, University of East Anglia, Norwich, UK, e-mail: a.sonntag@uea.ac.uk
2 Centre for Behavioural and Experimental Social Science (CBESS), ESRC Centre for Competition Policy and School of Economics, University of East Anglia, Norwich, UK, e-mail: daniel.zizzo@ncl.ac.uk.
We gratefully recognize the ESRC Centre for Competition Policy (CCP) for providing financial support for conducting this experiment. Furthermore we thank Subhasish Chowdhury, David Cooper, Erich Cromwell, Stephen Davies, Cary Deck, Enrique Fatas, Steffen Huck, Alexandros Karakostas, Franco Mariuzzo, Matthew Olczak, Melanie Parravano, Jan Potters, Israel Waichman, two anonymous reviewers and subjects to a presentation at Florida State University for their helpful comments and suggestions. The usual disclaimer applies.
1. Introduction
There are many plausible and well documented reasons why an increasing number of firms could make it more difficult to tacitly collude (Huck et al., 2004). However, it is still unclear why the experimental literature finds that collusion breaks down with three or more firms in the market, while in the real world larger numbers of firms seem to be able to tacitly collude (Davies et al., 2011; Sen 2003). Although many dimensions affect the likelihood of a collusive market outcome (for a review see Potters and Suetens, 2013), a ‘collusion puzzle’
remains regarding what dimensions potentially facilitate the ability to collude in settings with larger numbers of firms.
3In this paper we present an experiment showing that, if managers are deferential towards an authority, firms can induce more collusion by delegating production decisions to middle managers and providing suitable informal nudges.
4This holds not only with two but also with four firms.
Market size and the ability to collude. Experiments since Fouraker and Siegel (1963) and Dolbear et al. (1968) have shown a significant decrease in the equilibrium price in moving from 2 to 3 or 4 firms in the market. In a price setting environment, Dufwenberg and Gneezy (2000) showed that with 3 or 4 firms collusion broke down after some initial learning took place. Dolbear et al. (1968) provided two main reasons for the breakdown in collusion: first, the profit opportunities from collusion decrease in the number of firms in the market as any
3A huge experimental literature on collusive behavior found that fixed player matching (Huck et al., 2004b), pre-play communication and announcements (Cason and Davis, 1995; Holt and Davis, 1990; Holt, 1985; Huck et al., 2001), within-play communication (Fonseca and Normann, 2012; Sally, 1995), leadership in the sense of letting one firm decide first (Güth et al., 2007), the opportunity to punish non-collusive behavior (Fehr and Gächter 2000), experience in market interaction (Benson and Faminow 1988; Dufwenberg and Gneezy 2000) and concrete knowledge about the form of cost and demand function (Huck et al., 1999) increased the likelihood of observing collusive behavior in oligopolistic settings. In contrast to collusion-increasing factors, complementary studies also suggested that e.g. full information on individual actions (Huck et al. 1999; Huck, Normann, and Oechssler, 2000) or cost asymmetries (Mason et al., 1992, 1991) decreased collusive behavior and increased competition instead.
4 By the term nudge we refer to a non-binding cue. This fits with the more general use of the term as a change in the decision environment pointing but not forcing a behavior change as employed in Sunstein and Thaler's (2008) influential work.
surplus needs to be split over more firms and second, it is harder to bargain and achieve a tacit agreement. Selten (1973) used a model to show that collusion becomes harder as the number of firms increases, as the number of free riders increases with the number of firms.
There are additional reasons why we may expect collusion to become more difficult. The ability to use price or quantity to signal the intention to collude decreases as the number of firms increases. Furthermore, in the lack of special punishment technologies, targeted punishment of deviators becomes impossible. Even if it were public knowledge who deviated from an implicit or explicit collusive agreement, it would be impossible to punish the deviator only. This is because extending production or lowering the price would hurt all market subjects (and not only the deviator). As firms need not fear the potential punishment of the other firms, this works against collusion in markets with many firms (see e.g. Green et al., 2013; Ivaldi et al., 2003).
In the experimental design closest to our study, Huck et al. (2004b) found that, whereas firms in two player Cournot markets could collude considerably well, this ability decreased almost linearly with the number of firms, making firms set quantities even above the Nash prediction in markets with 4 or more players. In a Bertrand setting, Fonseca and Normann (2012) replicated the general finding that an increasing number of firms decreases the ability to collude but also showed that communication between firms could facilitate collusion (which is then not tacit anymore) with 4 or more firms.
Deference to authority and institutional delegation. This paper considers a different and
possibly complementary mechanism that may also support collusion even in multiple firms
markets. In the key experimental treatments, we use the experimenter as the authority
providing nudges towards the subjects making decisions over quantities. This is meant to
model middle managers being delegated to make market decisions but who can, nevertheless,
get nudged by their line managers in suitable pro-collusive ways. We believe this to be a
considerably ecologically more valid experimental model of the role of the authority in the laboratory than, say, providing the role of authority to an experimental subject (e.g. as a ring leader); the latter would make the experiment one about peer pressure rather than about authority.
5An additional benefit of having the experimenter as the authority is that we can ensure that there is an identical nudge across subjects and sessions (see Kimbrough and Vostroknutov, 2013).
Two ingredients are required for the nudge to help collusion. First, we rely on the behavioral notion that workers may wish to be deferential towards their line managers, in parallel to experimental subjects wishing to be deferential towards the experimenter. In the words of organizational psychologists Cialdini and Goldstein (2004, p.596), “most organizations would cease to operate efficiently if deference to authority were not one of the prevailing norms.”
6Second, we rely on the decision over the market variable (quantity, in our experiment) to be one that is delegated to the middle manager. As noted by Vickers (1985, p.
144), delegating a decision could “in some cases [be] essential for the credibility of some threats, promises and commitments”. While one can make examples where upper management was directly involved in setting the market variables in natural world cartels, these examples reflect the selected sample of cartels that have been discovered. We suspect that it may be rather harder to detect cases where there is no smoking gun at the level of top
5 Ours is a deliberate use of experimenter demand as the direct object of investigation rather than a confound relative to other experimental objectives: see Zizzo (2010) for a methodological discussion of experimenter demand effects and Cadsby et al. (2006), Karakostas and Zizzo (2012) and Silverman et al. (2012) for other applications of using the experimenter as authority in the context of a tax compliance, a money burning and a public good contribution experiment, respectively. We discuss Silverman et al. (2012) more below.
6 In a recent economic experiment, Robin et al. (2012) found that workers are willing to change their opinions in order to comply with those of their managers. There is empirical evidence that subordinates in organizations may not worry about the ethical implications of their actions if cued by the authority (Ashford and Vikas, 2003;
Darley, 2001), e.g. becoming willing to engage in race discrimination (Brief et al., 1995).
management
7and, more fundamentally, where collusion takes place without any explicit communication.
8The combination of deference to authority and delegation could work as a commitment device which could facilitate collusion. It could also work as a coordination device in the presence of common knowledge of the same message being delivered to middle managers of different firms. We control for such coordination effect in two ways. First, we implement both treatments where such assurance of common knowledge is given and treatments where the nudge is private information only. Second, we implement both a private information treatment where the nudge requires knowledge of the collusive outcome and one where middle managers are simply told to produce less than the Nash quantity. This simply requires a minimal understanding that there may be an advantage in trying to collude, as opposed to even implicitly potentially relying on any explicit coordination on a specific production value. We are not the first to establish a positive link between collusion and delegation,
9but our experiment is the first to analyze the role of institutional delegation for a varying number of interacting firms (2 and 4).
Silverman et al.’s (2012) experiment looked at the effect of authority on public good contribution. The paper is about inducing tax compliance; they varied the source of expertise supporting the nudge they provided (a recommendation to make a given public good contribution) and whether there was a penalty in case of audit. They found an effect of their
7 For example consider the switchgear cartel where quite sophisticated tactics were deployed to keep it a secret.
Besides using anonymous email accounts for sending encrypted messages lower than top level managers played an important role in this chain of communication. It is unclear whether this cartel would at all have been detected by authorities if not for a cartel member itself (ABB in that case) blowing the whistle.
8 An additional benefit of delegation is to “shield their involvement [into illegal collusive activities] by delegating operations to their hapless subordinates” (Baker and Faulkner, 1993, p.855, content of square brackets added).
9 Fershtman et al. (1991) argued that, if decisions were delegated, and there existed a high degree of commitment (i.e. the contract between principals with their agents was public knowledge, something which however may be impractical under antitrust laws) no formal agreement between the principals is needed to facilitate collusion.
nudge variable, but no evidence for a role of the source of expertise and only weak evidence in favor of an effect of an explanation for the nudge.
10Their work is complementary to ours in linking a decision setting in the broad class of social dilemmas to deference to authority.
Their game and focus is different from ours and their paper does not vary the number of interacting players, which is essential to our experiment. They also had nudge reminders every round, whereas our manipulation is quite weaker as there was only one reminder in our sequence of 24 rounds.
11In our experiment we vary the number of firms (2 or 4), whether there is a nudge to collude, whether there is an explanation for the nudge, whether the nudge was common or private knowledge, and the content of the nudge. Our key finding is that our nudge is equally effective in reducing the market quantity with 2 and 4 firms, and an explanation for the nudge is not needed to achieve this result. Even removing the element of common knowledge did not significantly reduce the level of collusion. Furthermore, just pointing in the ‘right direction’ is enough for increasing collusion. If we label as a compliance effect the pure effect of deference towards the nudge by the authority and a coordination effect the effect of coordinating to a common sunspot provided by common knowledge of a nudge on a specific production value, we are able to distinguish a compliance effect towards collusion from a coordination effect, and to find evidence for the former. In section 2 we introduce the experimental design and state our hypotheses before we present the results in section 3.
Section 4 discusses our findings and section 5 concludes.
10 Specifically, an effect is found at p<0.05 only in one of the regressions once a number of covariates are added, and only as an interaction term.
11 Because of their different motivation, they also employ a random matching of players across rounds, whereas for us (interacting firms in an oligopolistic market) a fixed matching is more appropriate.
2. Experimental Design and Hypotheses
2.1. Experimental Parameters
We used a Cournot type market with homogenous products, linear production costs and a linear demand function and parameterized it identically to Huck et al. (2007, 2004b) and Requate and Waichman (2010). That is, we used an inverse demand function of = max (100 − , 0) with = ∑
,and constant marginal costs equal to 1 ( ( ) = ). The Nash prediction for the production quantity of firm writes as = 99/( + 1) which for the four player case is = 99/5 = 19.8, and for the two player case is = 99/3 = 33.
The collusive prediction is
!"= 99/2 , which for the four player case is
!"= 99/8 = 12.375 and for the two player case is
!"= 99/4 = 24.75.
2.2. Procedures
We used a fixed matching protocol. At the start of the session, depending on the treatment two or four subjects formed a group, and its composition did not change throughout the entire session. Each session lasted for two stages of 12 rounds each. Subjects were able to use a profit calculator to get an understanding of market demand and of the relevance of the other subjects’ actions on their own income.
12They were told they would receive additional instructions at the beginning of stage 2 (round 13); these instructions just contained reminders. We used a market oriented frame to present the instructions (see Fonseca and Normann, 2012).
13The experiment was programmed in z-Tree (Fischbacher, 2007) and was
12 Requate and Waichman (2010) found no significant difference between the use of profit calculators and payoff tables as a means of presentation.
13 Huck et al. (2004b) showed that whether an experiment is framed in an economically sensible or entirely neutral way can, but does not necessarily have to have an effect on behavior. Whereas in a five players Cournot setting Huck et al. (2004b) did not find any difference between the frames, the neutral frame caused significantly more competitive behavior in a two player situation. Although significant, the difference in means was only one unit, a qualitatively rather small difference, given a choice set of 0-100 and a range of useful strategies from 66 (Nash) and 49.5 (collusion).
run at the CBESS laboratory at the University of East Anglia. A random round payment mechanism was implemented.
14The number of independent observations (groups) was almost equally distributed across treatments (12 groups in treatments A4, EA4, PA4 PAL4, B2, A2, EA2, PA2 and PAL2 and 11 groups in treatment B4). On average one session lasted 70 minutes and 212 subjects on average earned 18.75 pounds each.
2.3. Treatments
We employed a 2 (market size) x 5 (levels of authority) full factorial design. The following five treatments were both implemented in 2-firms and 4-firms market settings.
Baseline (B): In the Baseline treatment subjects simply repeatedly interacted in the Cournot market laid out above for 24 periods.
Authority (A): In the Authority treatment the instructions were exactly the same as in B but one additional sentence was added, nudging subjects to produce a particular quantity. After the text of the Baseline instructions the following was added: “You are entirely free to produce as few or as many units of output as you like (from 0 to 100). That said, we would ask you (and your co-participants) to produce 12.4 units of output. We are telling this not just to you but also to your co-participants” (in the 2-firms setting 12.4 was replaced by 24.8). A reminder of this, and only one reminder, was given at the beginning of the second stage. The requested production quantity (either 24.8 or 12.4 units of output) was exactly equal to the collusive output level for the respective market size.
Explaining Authority (EA): In the Explaining Authority treatment, we used exactly the same instructions as in Authority, but explained why it would be beneficial for the subjects to obey the nudge by adding the following: “The reason you should do this is that, if you and your co-
14 The profits of one randomly chosen round per stage were added up and converted into pounds at an exchange rate of 80 ECU = 1 pound. A participation fee of 3 pounds was added to the final earnings. We used ORSEE (Greiner, 2004) to invite for the sessions and did not restrict the CBESS subject pool.
participants produce 12.4 units of output, the total profits of you and your co-participants will be the highest. You can use the profit calculator to check the profitability of producing 12.4 units of output per firm.”
15There was a corresponding reminder, and only one, at the beginning of the second stage.
Private Authority (PA): In contrast to the Authority treatment, in the Private Authority treatment, the number requested was not common information but subjects were asked to produce a specific number in private, i.e. they did not receive any information about the quantity we requested from any of their co-subjects.
16Subjects were reminded on that quantity once, and only once, at the beginning of the second stage.
Private Authority Less (PAL): The Private Authority Less treatment was similar to the Private Authority treatment; however, we did not ask subjects to produce the collusive level, but simply to produce less than the Nash quantity (stated as a number). This request was communicated in private. Subjects were reminded of their number at the beginning of the second stage.
2.4. Hypotheses
Hypothesis 1: In the B 4-firms treatment, on average firms set their production around the Nash equilibrium level. In the B 2-firms treatment, groups collude more than 4-firms groups.
With the same parameters, Huck et al. (2004b) found that most markets in a 4 firms setting produced around 75 units (close to the Nash equilibrium of 79.2 units). We expect subjects to behave similarly to Huck et al.’s (2004b) in the Baseline.
17Both theoretical (Fouraker and Siegel, 1963; Selten, 1973) and empirical (Dolbear et al., 1968; Gürerk and Selten, 2012;
15 The experimental instructions can be found in Appendix A.
16 In the PA treatment no explanation similar to the EA treatment was provided.
17 For a game-theoretical analysis of a comparable setting see Selten (1973).
Huck et al., 2007, 2004) results suggest that increasing market size decreases the ability to collude. Therefore, we expect that 2-firms groups collude more than 4-firms groups.
Hypothesis 2: Nudging subjects to produce the collusive quantity (treatments A, EA, PA) or to produce less than the Nash quantity (treatment PAL) reduces the total output below the Nash output level, both for 2-firms and 4-firms markets.
As discussed in the introduction, we expect the provision of the nudge to reduce production levels and increase collusion as a result of deference to authority and common knowledge.
Hypothesis 3: In the EA treatment quantities produced are lower than in the A treatment, both in 2-firms and 4-firms markets.
As in Karakostas and Zizzo (2012) and Silverman et al. (2012), we expect that explaining the usefulness of obeying the nudge should, if anything, further increase compliance with the requested production level.
Hypothesis 4: In the PA and PAL treatments, quantities produced are higher than in the A treatment but lower than the Nash prediction, both in 2-firms and 4-firms markets.
We expect any effect caused by the A treatment to have two causes: a coordination effect due
to the fact of commonly knowing the quantity we asked all subjects to produce and a
compliance effect of being deferential towards an authority. The PA and PAL treatments
enable us to control for the coordination effect. The difference between production in the A
treatment and production in the PA treatment measures the extent to which there is a
coordination effect due to common knowledge. The difference between production in the PA treatment and production in the PAL treatment measures the extent to which there is a coordination effect due to a nudge (even if private) on a common production value. The nudge in the PAL treatment simply requires a minimal understanding that there may be an advantage in trying to collude, which we believe is entirely plausible to assume in real world settings without the need of a central planner helping to coordinate – a point which we elaborate further in the discussion section. Under this assumption, therefore, the difference between production in the PAL treatment and production in the B treatment measures the extent to which there is compliance effect due to deference to authority controlling for both sources of coordination effects. Our hypothesis is that, while there is some coordination effect, there is also a compliance effect.
Hypothesis 5: 2-player groups reduce their average production by a larger extent as compared to 4-player groups, if requested to do so (treatments A, EA, PA and PAL).
As the opportunity costs of obeying the production request (i.e. unilaterally reducing the own production quantity below the Nash output level) are higher in 4-player than in a 2-player settings (e.g., see Selten, 1973), we expect any requests to have a stronger effect in 2-player than in 4-player settings.
3. Results
3.1. Testing the Hypotheses
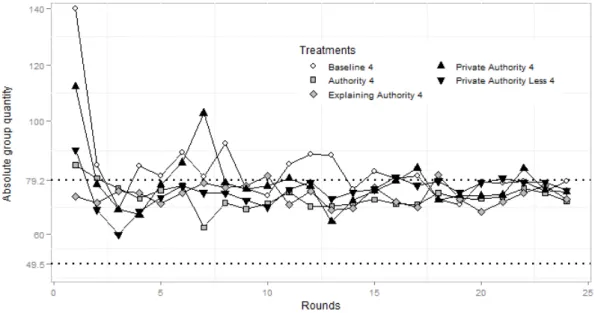
Figure 1 and Table 1 summarize the results of our experiment.
1818 We used the software packages R and STATA to analyze the experimental data.
[Insert Figure 1 and Table 1 about here]
Result 1: Hypothesis 1’s prediction of more collusion in 2-firms markets than in 4-firms markets is not supported. Production levels in the B treatment in both market sizes are not significantly different from the Nash prediction.
Support: In order to make production levels comparable across market sizes, we follow the approach of Huck et al. (2004b) and compute the ratio of the average total quantity in the market to the total quantity predicted by the Nash equilibrium: that is, the Nash ratio is & =
'()*'"
⁄
'+,. Comparing the Nash ratios of 2-firms and 4-firms markets in B reveals that, in smaller markets, firms produce slightly less. However, this difference is not significant (Wilcoxon, p=0.695). Both in 2-firms and 4-firms markets the actually observed production quantities (measured in &) do not differ from the Nash prediction of 1 (sign tests, p=1 and p=0.549 for 2-firms and 4-firms markets, respectively).
19Result 2: Hypothesis 2 is supported. Relative to the B treatment, subjects reduced their production output if nudged to do so (treatments A, EA, PA and PAL).
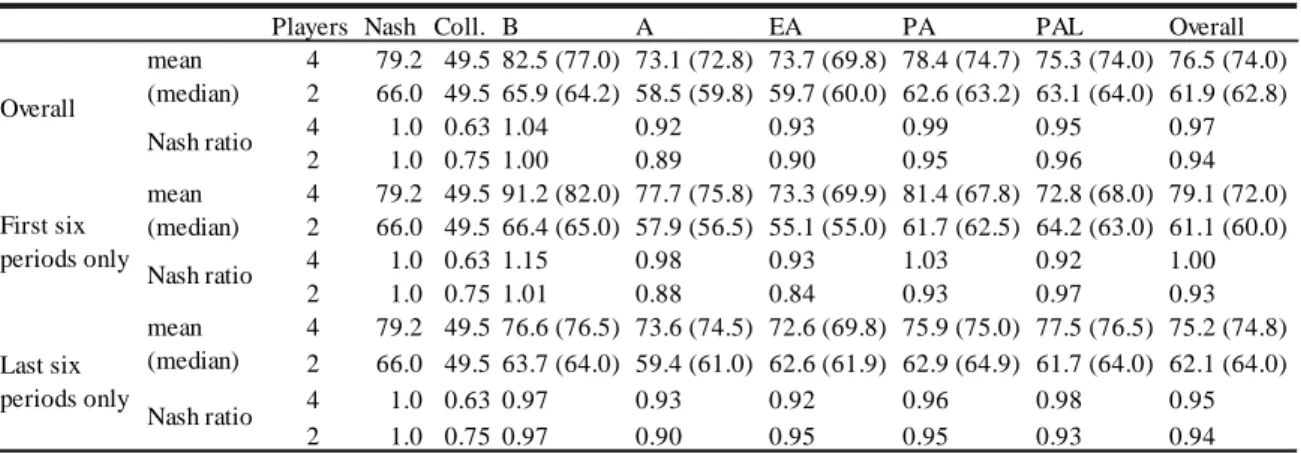
Support: Table 1 shows a fall in overall production as a result of the nudge: in the 2-firms markets, mean production goes down from about 66 in the B treatment to 63 in the PA and PAL treatment and further to 58-60 in the A and EA treatments; in the 4-firms markets, mean production goes down from about 82-83 in the B treatment to 75-78 in the PA and PAL treatment and further to 73-74 in the A and EA treatments.
20These quantities are significantly higher than if the nudge had been precisely followed in terms of requested
19 All bivariate tests in this paper are reported as two sided and computed on session averages per group of subjects to control for within-session non independence of observations.
20 In the 2-firms case A, EA, PA and PAL at least marginally reduced production (one-sided Wilcoxon tests) with p=0.007, p=0.019, p=0.039 and p=0.067, respectively. In the 4-firms case A, EA, PA and PAL also resulted in lower production levels, significant at p=0.009, p=0.067, p=0.132 and p=0.052, respectively.
production (sign tests, all p<0.01), but they are also lower than the Nash equilibrium predictions.
21This result is especially important for the PAL treatment where the (successful) private nudge only asked subjects to produce less than the Nash quantity.
[Insert Table 2 about here]
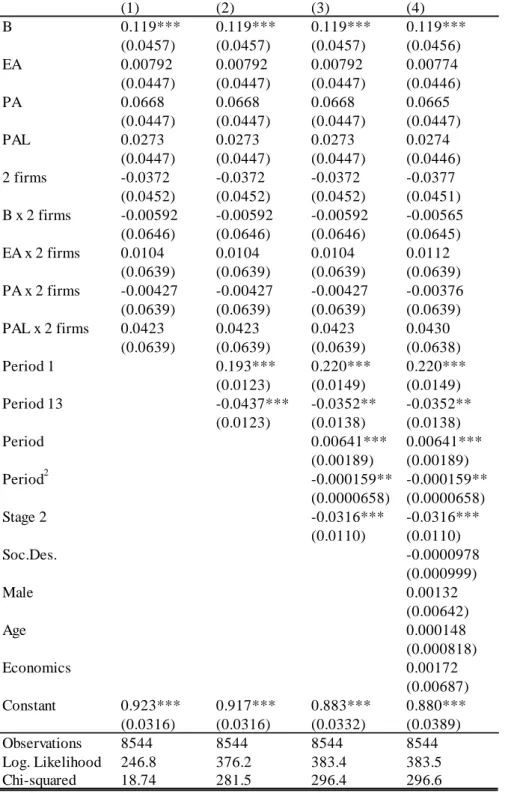
Table 2 looks at this matter further by running regressions on Nash ratios (with random intercepts on subjects nested in markets to control for non-independence of observations).
The independent variables include treatment dummies (A, EA, PA and PAL = 1 in the respective treatments; 2 Firms = 1 in 2-firms markets; interaction dummies); period and stage dummies (Period and Period
2, Period 13 = 1 in Period 13 and Stage 2 = 1 in Periods 13-24);
plus additional controls.
22All regression models are consistent in pointing to a reduction of the Nash ratio of between 11 and 12%, indicating more collusion on average in the A, EA, PA and PAL treatments.
23All interaction terms with the 2 Firms dummies are insignificant, pointing to a robustness of the finding to whether firms are 2 or 4.
Result 3: Hypothesis 3 is not supported. There is no evidence supporting lower production in the EA treatment than in the A treatment.
Support: Table 1 makes this clear by showing that aggregate production level in each market was the same on average between A and EA +/- about 1 unit, and regardless of whether a 2-
21 In 2-firms markets production was significantly lower than the Nash equilibrium prediction (one-sided sign tests: A, EA, PA and PAL with p=0.003, p=0.019, p=0.003 and p=0.073, respectively). In 4-firms markets production also decreased; however, only qualitatively in the case of EA and PA (one-sided sign tests: A, EA, PA and PAL with p<0.001, p=0.194, p=0.613 and p=0.073, respectively).
22 Soc.Des. is a social desirability index collected from a 16-items questionnaire at the end (Stöber, 2001) that provides a psychological measure of sensitivity to social pressure. Male (=1 with male subjects), Economics (=1 for subjects with an Economics background), and Age are also included in some regressions. None of these variables is significant and we shall not refer to them further.
23 As Authority is used as the baseline treatment in the regressions, a significant coefficient of the treatment dummy B, but no significant coefficient of the other treatment dummies means that production quantities in EA, PA and PAL are not significantly different from A. Whereas the coefficients of EA and PAL are significantly different from the coefficient of B (Wald tests: both p<0.05), the coefficient of PA is not (p>0.1).
firms or a 4-firms market is considered.
24The regression results of Table 2 show a similar picture, as the regression coefficient for the EA dummy is not significant at conventional levels (with Authority being the baseline treatment in Table 2).
Result 4: We find only mild support for hypothesis 4. The production levels in the PA and PAL treatments are only qualitatively higher than in the A treatment, with that for PA sitting half way between collusive production and Nash quantity, and that for PAL being of similar value.
Support: The production levels observed in PA were 78.4 and 62.6 for 4-firms and 2-firms markets, respectively. This is slightly but not significantly higher than in the A treatment (Wilcoxon test: p=0.128 and p=0.347 for 4-firms and 2-firms markets respectively). The production in the PA treatment was significantly lower than the Nash prediction for 2-firms markets (sign test: p=0.006), but in 4-firms markets the decrease in production is much smaller and not significant (sign test: p=1). The production level observed in the PAL treatment does not point to an increase relative to the PA treatment.
In the regression analysis of Table 2, both the PA and PAL coefficients are not statistically different from those on A and EA.
25The coefficient of PA lies almost exactly half way between the coefficients of B and the other treatments with a point nudge, i.e. A and EA, while the coefficient on PAL is clearly not higher than that on PA (if anything, the reverse, though statistically insignificantly so). The comparison between PA and PAL provides no support for a coordination effect due to a nudge on a common specific production value, but
24 In both 2-firms and 4-firms markets there is no statistically significant difference between A and EA (Wilcoxon tests, p=0.799 and p=0.977, respectively). This result is confirmed by the regression analysis of Table 2.
25 Wald tests: all p>0.1. Tables B1 and B2 in the appendix contain the regression results of 4-firms and 2-firms markets, respectively.
the regression analysis points both to a coordination effect due to common knowledge and to a compliance effect due to deference towards the authority (see Table 2).
Result 5: Against hypothesis 5, we find no difference between 2-firms and 4-firms groups in terms of reaction intensity for all nudge treatments (A, EA, PA and PAL).
Support: the magnitude of the reduction in output in the nudge treatments did not appear to be a function of market size. While the regression analysis in Table 2 finds a significant main effect of the baseline treatment being different from the authority treatment, the respective interaction terms with market size are far from being significant. The results of running regressions on 2-firms and 4-firms markets separately are almost identical to the joint regression results (see Tables B1 and B2).
3.2. Supplementary Analysis
Time trend. As shown by Table 1, we find that there is a tendency for production to be reduced in the B treatment if one compares the first six with the last six rounds; this tends to reduce the gap with the A, EA, PA and PAL treatments. Nevertheless, the nudges appear to produce more collusion from the beginning, and this is what is being picked up by result 2.
[Insert Table 3 about here]
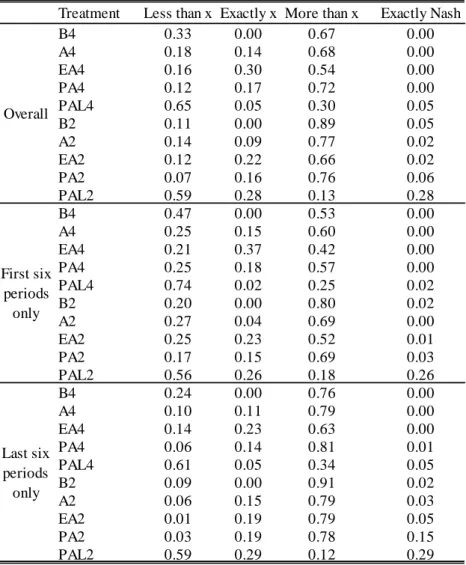
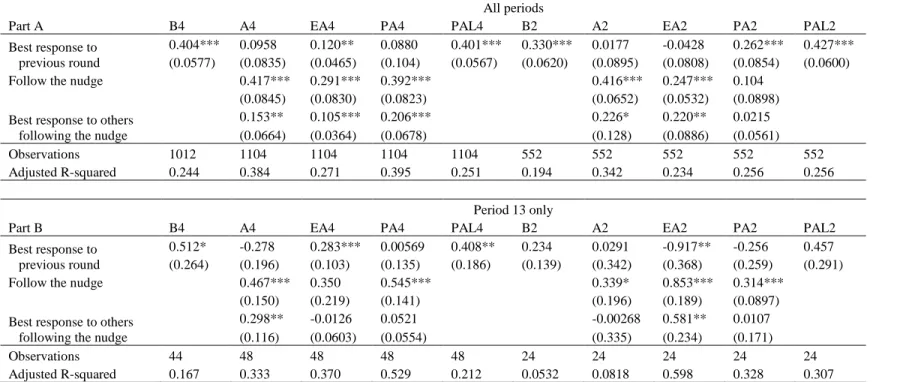
Precise production matches. There is additional evidence that the nudges mattered. Table 3
presents the proportions of quantities chosen by firms that were precisely identical to the
Nash equilibrium level, and to the requested amount in the A, EA and PA treatments, of 12.4
or 24.8 units. In the A, EA and PA treatments, subjects exactly followed the request to
produce the specific quantity of 12.4 or 24.8 units in 972 (out of 5184) cases, against 0 cases in which these quantities were produced in the B treatment.
26Interestingly, while in the EA treatment the percentage of precise compliance to the nudge was of the order of 22-30%, this roughly halved to 9-14% in the A treatment (Wilcoxon test, p=0.079 for 2-firms markets and p=0.022 for 4-firms markets). The percentage of precise compliance to the nudge in the PA treatment was comparable to that in the A treatment (12- 17%; in comparing PA and A treatments, Wilcoxon test p=0.583 and p=0.161 for 2-fims and 4-firms markets, respectively). This provides further support for a compliance effect independent of a coordination effect, as precise compliance takes place roughly to the same degree whether or not there is common knowledge of a common nudge.
274. Discussion
There is a ‘collusion puzzle’ to explain the difference between the robust lab finding that having more than two firms competing in a market drastically reduces the ability to collude (Huck et al., 2004) whereas in the real world collusion can be observed with a larger number of firms as well (Davies et al., 2011; Davies and Olczak, 2008). The experiment presented in this paper is one piece of a jigsaw puzzle to explain these contrasting findings. While other factors are clearly at work, such as communication (Fonseca and Normann, 2012), we have shown that a combination of delegation about production decisions and deference to the authority can also operate: we observed an increase in collusion of roughly the same size (in terms of Nash ratios) regardless of whether we had 2 or 4 firms.
26 A reviewer asked how many individuals chose the one-shot best response to the collusive outcome. This almost never happened, at least precisely (0 out of 3456 cases in 4-firms treatments and only 9 out of 1728 cases in 2-firms treatments). Further analysis on this possible heuristic, with limited supportive evidence, is presented in Appendix B.
27 Analyzing the response dynamics across treatments following the procedure used by Huck et al. (1999) revealed that the heuristic used most often was ‘Best response’. For details see Appendix B.
The effect may have been further combined with a coordination effect, i.e. by having common knowledge (treatments A and EA, for Authority and Explaining Authority respectively) and asking decision makers to produce a specific output level we created a salient focal point for coordination. One potential source of the coordination effect is the common knowledge, and we are able to identify this source by implementing the Private Authority (PA) treatment. We found that a coordination effect due to common knowledge is accountable for about half of the difference between the baseline and treatment A, with no statistically significant difference however between A and PA.
Another potential source of the coordination effect is the fact that we provide a specific production value. One might argue that, even in the PA treatment, a central planner (experimenter) nudges those in charge of the market variable towards this specific value, but there is no equivalent central planner in real world settings as otherwise collusion would be organized as an explicit cartel and not tacit anymore. The Private Authority Less (PAL) treatment enables us to identify whether there is a coordination effect of this kind. In this treatment subjects are simply told to produce less than the Nash quantity. This simply requires a minimal understanding that there may be an advantage in trying to collude, which we believe is entirely plausible to assume in real world settings without the need of a central planner.
28To elaborate on this, anyone who understood the basic dynamics of the game should be able to anticipate that if all market subjects jointly reduced their production quantity below the Nash quantity, up to a point, everyone would make higher profits. The only assumption that has to hold for translating our PAL environment to a real world setting is that senior
28 A counterargument would be that this treatment provides direct information on the Nash quantity. However, it is entirely clear from the baseline treatments that subjects rapidly converge to the Nash quantity regardless of being given this information directly. This is entirely in line with previous experimental work, and after all is straightforward for subjects to find the Nash quantity by using the profit calculator. Subjects, on average, were well capable of finding the Nash quantity without the experimenter explicitly revealing it to them.
managers understand this basic intuition, whether from their own experience, from corporate learning, or from a basic economics or business textbook. We find this assumption to be generally minimal and plausible.
We also found a significant increase in precise compliance rates – i.e. of subjects precisely following the nudge - in the EA as compared to the A treatment. The provision of an explanation roughly doubled the proportion of subjects who followed the request to the point and significantly reduced overproduction in both market sizes. If our findings were purely driven by coordination effects, we should not have observed this difference between the EA and the A treatments, which in fact we did. Although we find strong EA vs. A treatment differences on the individual level, it appears that, given market response dynamics, these differences average out on a market level. This lack of an aggregate difference between the EA and A treatments is, of course, consistent with what Silverman et al. (2012) found in their different setting. Interestingly, and again in support of a compliance effect, the lack of common knowledge did not lead subjects to change the degree to which they followed the nudge precisely, as the percentages were the same in the A and PA treatments.
Many corporate decisions are made in an institutional framework with superiors and subordinates. This naturally points to the question of whether and to what extent nudges from the higher level can facilitate collusion among delegated middle managers charged to set production levels. Although some studies formally showed that delegating a strategic decision could serve as a commitment device, we are only aware of one paper that tested such implications experimentally.
29Huck et al. (2004a) analyzed the actions of owners and managers in a two-stage Cournot setting. First, owners chose one of two possible contracts
29 In their theoretical analyses Fershtman and Judd (1987), Sklivas (1987) and Vickers (1985) predict that strategically delegating decisions about production quantities could result in a higher than beneficial output which in turn decreased the profits of the delegating firms. In that sense delegation would not be advisable to firms.
which they offered to their managers. All contracts offered were common knowledge among all players. Second, managers set the production quantities for their firms. The managers’
production decisions were highly dependent on the owners’ contract choices, i.e. managers used the signals they received from their own as well as their opponent’s owner and reacted to them by setting their production levels accordingly.
While Huck et al. (2004a) explicitly assigned subjects to the roles of both owners and managers (2 each), we exogenously provide the owners’ request and let all subjects play the role of managers only. Our implementation of delegation in the laboratory is stylized and exploits the fact that the experimenter can be seen an authority towards the experimental subjects (Karakostas and Zizzo, 2012; Kimbrough and Vostroknutov, 2013; Silverman et al., 2012; Zizzo, 2010). We do not manipulate the nature of the authority in our experiment but this has been looked upon by Silverman et al. (2012) in their public good contribution setting, and could clearly be looked at in future research of ours.
Our manipulation of delegation was obviously very stylized. One obvious question for future research is how the results would change if it were known that complying with the instructions is “illegal”, or if there were the possibility of punishment. In these scenarios, arguably it would be in the advantage of the higher level executives not to provide an explanation for the nudge. Even in our experiment, explanations have no positive effects on collusion. In a setting where punishment is possible, there would be clear reasons for avoiding them as subordinates may potentially be less likely to follow the request if they knew it was illegal; it also would increase the number of potential witnesses in case of a trial (Baker and Faulkner, 1993) or even encourage whistle-blowers to step forward.
Other natural world dimensions of delegation could work in the direction of making our
results stronger (e.g. incentivized contracts, pressure from the superior officer, no anonymity
etc.). If already simply being asked to do something could significantly affect behavior (although complying individually was clearly payoff-dominated by not complying), making the request stronger or making non-compliance a very unfavorable choice for the decision maker would potentially achieve higher collusion rates than found in this experiment.
Clearly, future research is needed.
305. Conclusion
A ‘collusion puzzle’ exists between, on the one hand, the fact that increasing the number of firms should reduce the ability to tacitly collude, and leads to a collapse in collusion in experimental markets with three or more firms; and, on the other hand, the fact that in natural oligopolistic markets there are cases of larger number of firms tacitly colluding (Davies et al., 2011; Sen, 2003). We present an experiment showing that, if managers are deferential towards an authority, firms can induce more collusion by delegating production decisions to middle managers and providing suitable informal nudges. This holds not only with two but also with four firms. We cannot rule out a coordination effect due to common knowledge by the firms that the same nudge is being given to other firms. We find however no evidence for a coordination effect due to an implied central planner requesting to producing the collusive output. A nudge simply suggesting to produce less than the Nash quantity was as effective as a nudge suggesting to produce the collusive outcome. We believe that it a plausible assumption that (most) real world senior managers understand the basic intuition that trying to produce less can be jointly profitable.
Controlling for coordination effects, we are able to identify a compliance effect from deference to authority. Based on the experimental results we have presented, if firms want to
30 In our experiment we deliberately nudged people towards the collusive output (in treatments A, EA and PA).
Alternatively, one could imagine nudging people towards a less favorable production level. Another extension of our work could be along the lines of increasing the numbers of firms in the markets further; for example, Fonseca and Normann (2012) consider 6-firms and 8-firms markets.
engage in collusion, delegating decisions internally could be a useful device to exploit deference to authority as a way of facilitating it.
6. References
Ashford, B. E., & Vikas, A. (2003). The Normalization of Corruption in Organizations. In B.
M. Staw & R. M. Kramer (Eds.), Research in Organizational Behavior. Oxford:
Elsevier.
Baker, W. E., & Faulkner, R. R. (1993). The social organization of conspiracy: illegal networks in the heavy electrical equipment industry. American Sociological Review, 58(6), 837–860.
Benson, B. L., & Faminow, M. (1988). The impact of experience on prices and profits in experimental duopoly markets. Journal of Economic Behavior and Organization, 345–
365.
Brief, A. P., Buttram, R. T., Elliott, J. D., Reizenstein, R. M., & McCline, R. L. (1995).
Releasing the beast: A study of compliance with orders to userace as a selection criterion. Journal of Social Issues, 51(3), 177–193.
Cadsby, C. B., Maynes, E., & Trivedi, V. U. (2006). Tax compliance and obedience to authority at home and in the lab: A new experimental approach. Experimental Economics, 9(4), 343–359.
Cason, T., & Davis, D. (1995). Price communications in a multimarket context: An experimental investigation. Review of Industrial Organization, 10, 769–787.
Cialdini, R. B., & Goldstein, N. J. (2004). Social influence: compliance and conformity.
Annual Review of Psychology, 55(1974), 591–621.
Darley, J. M. (2001). The Dynamics of Authority in Organization. In J. M. Darley, D. M.
Messick, & T. R. Tyler (Eds.), Social Influences on Ethical Behavior in Organizations (pp. 37–52). London: Erlbaum.
Davies, S., & Olczak, M. (2008). Tacit versus overt collusion firm asymmetries and numbers:
What’s the evidence? Competition Policy International, 4(2), 174–200.
Davies, S., Olczak, M., & Coles, H. (2011). Tacit collusion, firm asymmetries and numbers:
Evidence from EC merger cases. International Journal of Industrial Organization, 29(2), 221–231.
Dolbear, F., Lave, L., Bowman, G., Lieberman, A., Prescott, E. C., Rueter, F., & Sherman, R.
(1968). Collusion in oligopoly: An experiment on the effect of nNumbers and
information. The Quarterly Journal of Economics, 88(2), 240–259.
Dufwenberg, M., & Gneezy, U. (2000). Price competition and market concentration: an experimental study. International Journal of Industrial Organization, 18(1), 7–22.
Fehr, E., & Gächter, S. (2000). Cooperation and punishment in public goods experiments.
The American Economic Review, 90(4), 980–994.
Fershtman, C., & Judd, K. L. (1987). Equilibrium incentives in oligopoly. The American Economic Review, 77(5), 927–940.
Fershtman, C., Judd, K. L., & Kalai, E. (1991). Observable contracts: Strategic delegation and cooperation. International Economic Review, 32(3), 551–559.
Fonseca, M. A., & Normann, H.-T. (2012). Explicit vs. tacit collusion—The impact of communication in oligopoly experiments. European Economic Review, 56(8), 1759–
1772.
Fouraker, L., & Siegel, S. (1963). Bargaining Behavior. New York: McGraw–Hill.
Green, E. J., Marshall, R. C., & Marx, L. M. (2013). Tacit Collusion in Oligopoly. Working Paper.
Gürerk, Ö., & Selten, R. (2012). The effect of payoff tables on experimental oligopoly behavior. Experimental Economics, 15(3), 499–509.
Güth, W., Levati, M. V., Sutter, M., & van der Heijden, E. (2007). Leading by example with and without exclusion power in voluntary contribution experiments. Journal of Public Economics, 91(5-6), 1023–1042.
Holt, C. (1985). An experimental test of the consistent-conjectures hypothesis. The American Economic Review, 75(3), 314–325.
Holt, C. A., & Davis, D. (1990). The effects of non-binding price announcements on posted- offer markets. Economics Letters, 34(4), 307–310.
Huck, S., Konrad, K. A., Mueller, W., & Normann, H.-T. (2007). The merger paradox and why aspiration levels let it fail in the laboratory. The Economic Journal, 117, 1073–
1095.
Huck, S., Muller, W., & Normann, H.-T. (2001). Stackelberg beats Cournot—on collusion and efficiency in experimental markets. The Economic Journal, 111(474), 749–765.
Huck, S., Müller, W., & Normann, H.-T. (2004). Strategic delegation in experimental markets. International Journal of Industrial Organization, 22(4), 561–574.
Huck, S., Normann, H.-T., & Oechssler, J. (1999). Learning in cournot oligopoly - an
experiment. The Economic Journal, 109(454), 80–95.
Huck, S., Normann, H.-T., & Oechssler, J. (2000). Does information about competitors’
actions increase or decrease competition in experimental oligopoly markets?
International Journal of Industrial Organization, 18, 39–57.
Huck, S., Normann, H.-T., & Oechssler, J. (2004). Two are few and four are many: number effects in experimental oligopolies. Journal of Economic Behavior & Organization, 53(4), 435–446.
Ivaldi, M., Jullien, B., Rey, P., Seabright, P., & Tirole, J. (2003). The Economics of Tacit Collusion. Final Report for DG Competition - European Commission (March).
Karakostas, A., & Zizzo, D. J. (2012). Obedience. Working Paper, 1–33.
Kimbrough, E. O., & Vostroknutov, A. (2013). Norms Make Preferences Social. Working Paper, (August).
Mason, C. F., Phillips, O. R., & Nowell, C. (1992). Duopoly behavior in asymmetric markets:
An experimental evaluation. The Review of Economics and Statistics, 74(4), 662–670.
Mason, C. F., Phillips, O. R., & Redington, D. B. (1991). The role of gender in a non- cooperative game. Journal of Economic Behavior and Organization, 15, 215–235.
Potters, J., & Suetens, S. (2013). Oligopoly experiments in the current millennium. Journal of Economic Surveys, 27(3), 439–460.
Requate, T., & Waichman, I. (2010). “A profit table or a profit calculator?” A note on the design of Cournot oligopoly experiments. Experimental Economics, 14(1), 36–46.
Robin, S., Rusinowska, A., & Villeval, M.-C. (2012). Ingratiation and Favoritism:
Experimental Evidence. CES Working Papers, 2012.32.
Sally, D. (1995). Conversation and Cooperation in social dilemmas: A meta-analysis of experiments from 1958 to 1992. Rationality and Society, 7, 58–92.
Selten, R. (1973). A simple model of imperfect competition, where 4 are few and 6 are many.
International Journal of Game Theory, 2(1), 141–201.
Sen, A. (2003). Higher prices at Canadian gas pumps: international crude oil prices or local market concentration? An empirical investigation. Energy Economics, 25(3), 269–288.
Silverman, D., Slemrod, J., & Uler, N. (2012). Distinguishing the Role of Authority “In” and Authority “To.” Working Paper, 1–35.
Sklivas, S. D. (1987). The strategic choice of managerial incentives. The Rand Journal of Economics, 18(3), 452–458.
Stöber, J. (2001). The Social Desirability Scale-17 (SDS-17): Convergent validity,
discriminant validity, and relationship with age. European Journal of Psychological
Assessment, 17, 222–232.
Sunstein, C. R., & Thaler, R. H. (2008). Nudge: Improving decisions about health, wealth and happiness. New Haven, CT: Yale University Press.
Vickers, J. (1985). Delegation and the theory of the firm. The Economic Journal, 95, 138–
147.
Zizzo, D. J. (2010). Experimenter demand effects in economic experiments. Experimental
Economics, 13(1), 75–98.
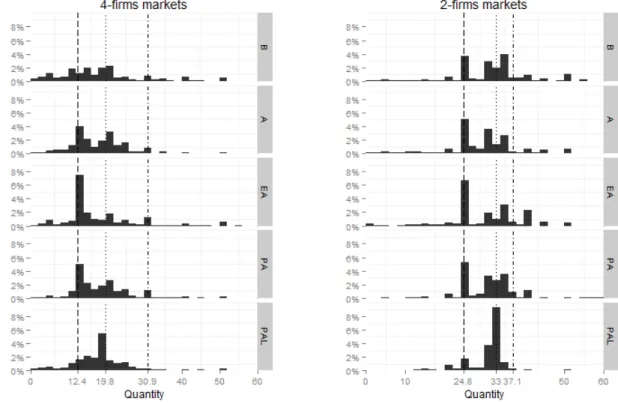
Figure 1: Average absolute quantities per market and treatment
Note: Means plus/minus standard errors (whiskers). The dashed horizontal lines at 79.2 and 66.0 indicate the Nash prediction for 4 firms and 2 firms settings, respectively. The dash-dotted horizontal line at 49.5 indicates the collusive production quantity.
Table 1: Summary statistics for the average total quantities per market
Notes: B, A, EA, PA and PAL denote the treatments Baseline, Authority, Explaining Authority, Private Authority and Private Authority Less, respectively. Nash denotes the Nash-Cournot prediction and Coll.
describes the collusive output level. The Nash ratio is defined as the actual market production divided by Nash prediction for the overall market production.
Players Nash Coll. B A EA PA PAL Overall
4 79.2 49.5 82.5 (77.0) 73.1 (72.8) 73.7 (69.8) 78.4 (74.7) 75.3 (74.0) 76.5 (74.0) 2 66.0 49.5 65.9 (64.2) 58.5 (59.8) 59.7 (60.0) 62.6 (63.2) 63.1 (64.0) 61.9 (62.8)
4 1.0 0.63 1.04 0.92 0.93 0.99 0.95 0.97
2 1.0 0.75 1.00 0.89 0.90 0.95 0.96 0.94
4 79.2 49.5 91.2 (82.0) 77.7 (75.8) 73.3 (69.9) 81.4 (67.8) 72.8 (68.0) 79.1 (72.0) 2 66.0 49.5 66.4 (65.0) 57.9 (56.5) 55.1 (55.0) 61.7 (62.5) 64.2 (63.0) 61.1 (60.0)
4 1.0 0.63 1.15 0.98 0.93 1.03 0.92 1.00
2 1.0 0.75 1.01 0.88 0.84 0.93 0.97 0.93
4 79.2 49.5 76.6 (76.5) 73.6 (74.5) 72.6 (69.8) 75.9 (75.0) 77.5 (76.5) 75.2 (74.8) 2 66.0 49.5 63.7 (64.0) 59.4 (61.0) 62.6 (61.9) 62.9 (64.9) 61.7 (64.0) 62.1 (64.0)
4 1.0 0.63 0.97 0.93 0.92 0.96 0.98 0.95
2 1.0 0.75 0.97 0.90 0.95 0.95 0.93 0.94
Overall
First six periods only
Last six periods only
mean (median) Nash ratio mean (median) Nash ratio mean (median) Nash ratio
Table 2: Regressions on group level Nash ratios (r)
Notes: The baseline for the above regressions is the 4 firms Authority (a) treatment. B, EA, PA and PAL represent dummies for the Baseline, Explaining Authority, Private Authority and Private Authority Less treatment, respectively. 2 Firms and Stage 2 denote dummies for a market size of 2 and the Periods 13-24 respectively. The dummies Period 1 and Period 13 take the value of 1 in period 1 and 13 (when subjects were reminded of the nudge), respectively and 0 otherwise; Soc.Des. denotes a numeric measure for social desirability. Age is the numeric age in years. Male and Economics are dummies that are one if the participant was male and an economics major, respectively. All columns contain coefficients of linear random intercept
(1) (2) (3) (4)
B 0.119*** 0.119*** 0.119*** 0.119***
(0.0457) (0.0457) (0.0457) (0.0456)
EA 0.00792 0.00792 0.00792 0.00774
(0.0447) (0.0447) (0.0447) (0.0446)
PA 0.0668 0.0668 0.0668 0.0665
(0.0447) (0.0447) (0.0447) (0.0447)
PAL 0.0273 0.0273 0.0273 0.0274
(0.0447) (0.0447) (0.0447) (0.0446)
2 firms -0.0372 -0.0372 -0.0372 -0.0377
(0.0452) (0.0452) (0.0452) (0.0451) B x 2 firms -0.00592 -0.00592 -0.00592 -0.00565 (0.0646) (0.0646) (0.0646) (0.0645)
EA x 2 firms 0.0104 0.0104 0.0104 0.0112
(0.0639) (0.0639) (0.0639) (0.0639) PA x 2 firms -0.00427 -0.00427 -0.00427 -0.00376 (0.0639) (0.0639) (0.0639) (0.0639) PAL x 2 firms 0.0423 0.0423 0.0423 0.0430
(0.0639) (0.0639) (0.0639) (0.0638)
Period 1 0.193*** 0.220*** 0.220***
(0.0123) (0.0149) (0.0149)
Period 13 -0.0437*** -0.0352** -0.0352**
(0.0123) (0.0138) (0.0138)
Period 0.00641*** 0.00641***
(0.00189) (0.00189)
Period
2-0.000159** -0.000159**
(0.0000658) (0.0000658)
Stage 2 -0.0316*** -0.0316***
(0.0110) (0.0110)
Soc.Des. -0.0000978
(0.000999)
Male 0.00132
(0.00642)
Age 0.000148
(0.000818)
Economics 0.00172
(0.00687) Constant 0.923*** 0.917*** 0.883*** 0.880***
(0.0316) (0.0316) (0.0332) (0.0389)
Observations 8544 8544 8544 8544
Log. Likelihood 246.8 376.2 383.4 383.5
Chi-squared 18.74 281.5 296.4 296.6
models clustered by subjects nested in sessions; standard errors in parentheses.31 Significance levels of coefficients: ***p < 0.01, **p < 0.05, *p < 0.1
Table 3: Proportion of production quantities less than, equal to and greater than the requested quantity and the proportion of production quantities equal to the theoretical Nash prediction
Notes: B, A, EA, PA and PAL denote the treatments Baseline, Authority, Explaining Authority, Private Authority and Private Authority Less, respectively. The numbers 4 and 2 indicate the number of firms in the market. The value of x refers to the number that participants were asked to produce in the A, EA and PA treatments and the number participants were asked to undercut in the treatments PAL (note that for PAL treatments column Exactly x and Exactly Nash are identical).
31 We did not estimate a Tobit model as the lowest and highest observed values for the group Nash ratios were 0.15 and 3.36, respectively.
Treatment Less than x Exactly x More than x Exactly Nash
B4 0.33 0.00 0.67 0.00
A4 0.18 0.14 0.68 0.00
EA4 0.16 0.30 0.54 0.00
PA4 0.12 0.17 0.72 0.00
PAL4 0.65 0.05 0.30 0.05
B2 0.11 0.00 0.89 0.05
A2 0.14 0.09 0.77 0.02
EA2 0.12 0.22 0.66 0.02
PA2 0.07 0.16 0.76 0.06
PAL2 0.59 0.28 0.13 0.28
B4 0.47 0.00 0.53 0.00
A4 0.25 0.15 0.60 0.00
EA4 0.21 0.37 0.42 0.00
PA4 0.25 0.18 0.57 0.00
PAL4 0.74 0.02 0.25 0.02
B2 0.20 0.00 0.80 0.02
A2 0.27 0.04 0.69 0.00
EA2 0.25 0.23 0.52 0.01
PA2 0.17 0.15 0.69 0.03
PAL2 0.56 0.26 0.18 0.26
B4 0.24 0.00 0.76 0.00
A4 0.10 0.11 0.79 0.00
EA4 0.14 0.23 0.63 0.00
PA4 0.06 0.14 0.81 0.01
PAL4 0.61 0.05 0.34 0.05
B2 0.09 0.00 0.91 0.02
A2 0.06 0.15 0.79 0.03
EA2 0.01 0.19 0.79 0.05
PA2 0.03 0.19 0.78 0.15
PAL2 0.59 0.29 0.12 0.29
Overall
First six periods
only
Last six periods
only
A. Experimental Instructions
Printed below are instructions for the 4 firms Baseline setting. Parts in [ ] were added to the baseline instruction in the A treatment. In the EA treatment, the A treatment instructions were extended by parts in [[ ]]. Parts in { } and < > were added to or cut (when struck through) from the baseline instructions in the PA and the PAL treatment, respectively. Instructions for 2 firms treatments were identical with the necessary changes for the different number of firms.
Instructions Introduction
Welcome to today's experiment on decision making. The session will begin shortly.
Before we start, we have a few reminders. First, to help us keeping the lab neat and tidy, we ask you not to eat or drink in the lab. Also, we ask you to turn off your mobile phone and other devices completely. Please refrain from talking to other participants during the experiment. If you have a question at any point in the experiment, please raise your hand.
In this experiment, you will repeatedly make decisions. By doing this you can earn money. How much you earn depends on your decisions and on the decisions of other participants.
This experiment consists of 2 stages lasting 12 rounds each. You will receive additional instructions on screen before stage 2. <{All participants receive the same instructions.}>
Your decisions will be absolutely anonymous, i.e. your identity will neither be revealed to your co-participants nor to the experimenters at any time during or after the experiment.
Groups of firms
In this experiment, you will be matched with three other participants to form a group.
These groups of four will stay the same throughout the full duration of the experiment.
You represent a manger in a firm that, like the three other firms in your group, produces and sells one and the same product in a market. The costs of production are 1 experimental currency unit (ECU) per unit of output (this holds for all firms). All firms will always have to make one decision, namely, set the quantity they wish to produce.
Every firm can produce from 0 to 100 units of output in every round.
Profits
The following important rule holds: the larger the total quantity of all firms in your group, the smaller the price that will emerge in the market. Moreover, the price will be zero from a certain amount of total output upwards. Note that the market will always be cleared, i.e. whatever price results from the total produced quantity every firm will sell
all of its quantity. Your profit per unit of output will then be the difference between the market price and the unit cost of 1 ECU. Your profit per round is thus equal to the profit per unit multiplied by the number of units you sell. Note that you can make a loss, if the market price is below the unit costs.
In each round the outputs of all four firms of your group will be registered, the corresponding price will be determined and the respective profits will be computed.
From the second period on, you will learn about the average output produced by the other firms, your own output, the resulting market price and your own profit in the previous period, in every period.
Furthermore, you will have access to a profit calculator. You can use it to simulate your profit for arbitrary quantity combinations. You can enter two values, an average quantity for the other companies in your group and a quantity for yourself. The profit calculator then tells you what your profit would be, given the typed in quantities. You can use the profit calculator to simulate as many combinations as you want before each actual decision.
Final Payment
This experiment has 2 stages that last 12 rounds each. At the end of the experiment one winning round per stage is chosen at random. Whatever your earnings in these two rounds were, they are summed up and converted into pounds at the rate of 80 ECU = 1 pound. If the sum of your stage 1 and stage 2 earnings is negative, this loss will be deducted from your participation fee of 3 pounds.
<{[Request]}>
<{[You are entirely free to produce as few or as many units of output as you like (from 0 to 100).]}>
[That said, we would ask you (and your co-participants) to produce 12.4 units of output.
We are telling this not just to you but also to your co-participants.]
[[The reason you should do this is that, if you and your co-participants produce 12.4 units of output, the total profits of you and your co-participants will be the highest.]]
[[You can use the profit calculator to check the profitability of producing 12.4 units of output per firm.]]
{That said, we would ask you to produce a specific number of units. This number will be displayed on your computer screen soon. When you see the number on the screen, please write it down here: _____.}
<That said, we would ask you (your firm) to produce less than a specific number of units of output. This number will be displayed on your computer screen soon. When you see the number on the screen, please write it down here: _____.>
Please remain seated until the experimenter tells you to collect your payment. Before starting to take decisions, we ask you to fill in a questionnaire. The only purpose of the questionnaire is to check whether you have understood these instructions.
B. Further Analysis
On market size
Figure B1: Absolute number of units produced by period and treatment (4-firms markets only)
Notes: The dotted lines at 79.2 and 49.5 represent the Nash prediction and the collusive production quantity, respectively.
Figure B2: Absolute number of units produced by period and treatment (2-firms markets only)
Notes: The dotted lines at 66.0 and 49.5 represent the Nash prediction and the collusive production quantity, respectively.
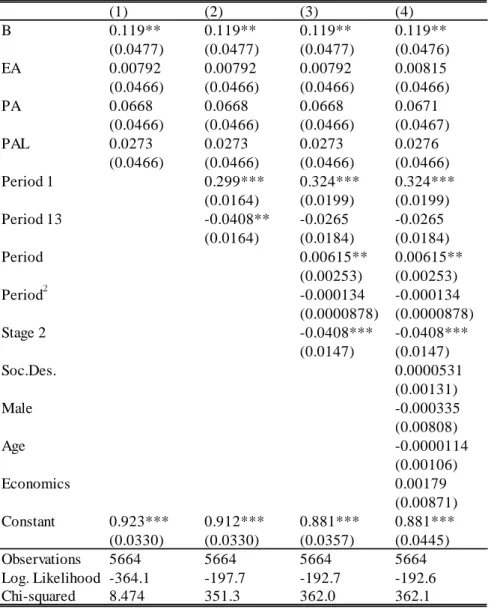
Table B1: Regressions on group level Nash ratios (r), 4-firms treatments only
Notes: The baseline for the above regressions is the 4 firms Authority (A) treatment. B, EA, PA and PAL represent dummies for the Baseline, Explaining Authority, Private Authority and Private Authority Less treatment, respectively. Stage 2, Period 1 and Period 13 denote dummies for the Periods 13-24, Period 1only and Period 13 only, respectively; Soc.Des. denotes a numeric measure for social desirability. Age is the numeric age in years. Male and Economics are dummies that are one if the subject was male and an economics major, respectively. All columns contain coefficients of linear random intercept models clustered by subjects nested in sessions; standard errors in parentheses; Significance levels of coefficients: ***p < 0.01, **p < 0.05, *p < 0.1