Project:
Development of an Evaluation Framework for the Introduction of Electromobility
WP9 Quantification of Environmental Benefits
Deliverable 9.1: Report on External Costs of electricity generation and vehicle use
Deliverable 9.2: Soft link between environmental assessment and the hybrid general equilibrium model
Due date of deliverable: 28 February 2015
Author(s) Milan Ščasný, CASE with a contribution by
Vojtěch Máca, CASE (Chapter 2.2.3) Jan Weinzettel, CASE (Chapter 2.2.2) Michael Miess, IHS (outputs from CGE model) Stefan Schmelzer, IHS (outputs from CGE model)
2 Abstract
We quantify environmental benefits attributable to air quality and GHGs pollutants due to electro-mobility. We link ExternE’s Impact Pathway Analysis and the hybrid CGE model in order to relate predicted effects on economy to external costs. To quantify the external costs, environmental and health effects attributable to direct and indirect emissions stemming from domestic economic production, imports, fuel use and electricity production over the period 2008-2030 are estimated. As a result, total external costs and year-by-year differences for business-as-usual and EM+ scenario are computed for Austria. We find that EM+ scenario generates overall smaller externalities, but the year-by-year differences are very small in absolute magnitude, corresponding to about 0.3% reduction in relative terms. Different sectors contribute to the total value of external costs, however. EM+ generates small benefits due to changes in the structure of domestic economic sectors, while changes in vehicle fleet and fuel use solely result in about 2.5 times larger benefits. Annual environmental benefits of EM+ are about 80 to 90 million euros after the year 2025. EM+ scenario also leads to changes in electricity market that would result in damage, rather than benefits, of value about 10 to 33 million euros. This environmental damage is however not sufficiently large to counterbalance the environmental benefits, and hence EM+ is environment-improving policy yielding overall total net benefits.
Keywords: external costs; ancillary benefits; ExternE; Impact Pathway Analysis; emission factors
3
Table of Contents
1 Introduction ... 5
2 The Method ... 7
2.1 The ExternE Impact Pathway Analysis ... 7
2.2 Linking the hybrid CGE model to the ExternE’s IPA approach ... 11
3 Results – Quantification of external costs of EM+ for Austria ... 20
3.1 External costs attributable to fuel use in vehicles... 20
3.2 External costs attributable to electricity production ... 23
3.3 External costs attributable to production of economic sectors and imports ... 26
3.4 Total external costs due to EM+ ... 29
References ... 34
Appendix ... 36
4
List of Tables
Table 1. Average damage factors for air quality and GHG pollutants - Austria (Euro2005 per ton) .... 10
Table 2. External costs of electricity generation due to operation and fuel use in Austria, €c/kWh. .. 18
Table 3. Fuel use in million EUR, 2008-2030, Austria ... 20
Table 4. External costs attributable to fuel use in vehicles, 2008-2030, Austria. ... 21
Table 5. Effect of EM+ on the external costs, 2008-2030, Austria. ... 22
Table 6. External costs attributable to electricity generation, 2008-2030, Austria. ... 24
Table 7. Effect of EM+ on the external costs attributable to electricity generation, 2008-2030, Austria. ... 25
Table 8. Externality attributable to economic production in sectors, direct and indirect emissions, 2008-2030, Austria, in million EUR ... 27
Table 9. External costs associated with direct and indirect emissions released by economic sectors, 2008-2030, Austria ... 28
Table 10. Total external costs in million EUR - direct and indirect emissions, 2008-2030, Austria ... 30
Table 11. Effect of EM+ on total external costs, 2008-2030, Austria ... 31
Table 12. Total external costs attributable to direct emissions, in million EUR, 2008-2030, Austria ... 32
Table 13. Effect of EM+ on total external costs attributable to direct emissions, 2008-2030, Austria 33 Table A1. Attribution of Exiobase (CREAA) product groups and industry categories into CGE sectors 36 Table A2. Emission factors for passenger cars, in g of emissions per GJ of fuel consumption ... 37
Table A3. Emission factors for freight transport, in kg of emissions per ton of fuel consumption ... 39
Table A4. External costs for electricity generating technologies – CASES database, in €c per kWh. ... 41
List of Figures Figure 1 – Absolute and relative differences in predicted and real vehicle stock (2010) ... 14
Figure 2 – Absolute and relative differences in fuel consumption (2010) ... 15
Figure 3 – Comparison of predicted passenger car stock in Austria ... 15
Figure 4 – Comparison of predicted energy consumption ... 16
Figure 5 – Comparison of averaged emission factors ... 16
Figure 6. Electricity generation and technology shares under EM+ scenario, Austria. ... 23
5
1 Introduction
The aim of the Work Package 9 is twofold. First, we develop an approach for quantification of external costs of policy scenario on electro-mobility. Doing that, we gather appropriate emission data and the damage factors for the benefit quantification and link the benefit assessment to the hybrid general equilibrium model. Second, we apply this approach to quantify the external costs due to EM+
policy scenario and compared these benefits with business as usual level.
The effects on economy and electricity generation are quantified by means of the hybrid computable general equilibrium model as developed in other Work Packages within DEFINE project.
Environmental benefits attributable to air quality and GHGs pollutants due to electro-mobility are then quantified using ExternE’s Impact Pathway Analysis as developed within the most recent ExternE projects (Externalities of Energy). In order to quantify the monetized environmental and health benefits associated with the effects of electro-mobility, the two modelling approaches - the hybrid CGE model and the ExternE’s IPA are linked through emission factors.
Specifically, we consider the environmental and health effects attributable to direct emissions stemming from domestic economic production and derive the emission-output factors, indirect emissions attributable to all imported goods produced worldwide and derive the emission-import factors, direct emissions released by vehicles and derive the emission-fuel use factors, and direct external costs associated with electricity generation when the damage factors per kWh electricity generated in various technologies are utilized.
In order to consider the effect of possible changes in technology, we quantify emissions attributable to car usage and electricity generation outside of the economic production module. While the emission factors of economic production and imports are based on CREEA multi-regional environmentally-extended input-output database that describes state of the economy in year 2007, the emission factors for the two key technologies are derived elsewhere. Specifically, the emission factors per fuel use in passenger vehicles and freight transport are based on TREMOVE model from which we generate time variant emission factors. Utilizing CASES database on external costs per wide set of technologies, we derive the damage factors per each electricity generating technology that are included in the electricity model embodied in the hybrid CGE model.
Summing all the external costs across domestic production in economic sectors, fuel use, and electricity production, we get total value of external costs that amount about 27 billion euros in the reference year and 33 billion euros in 2030. This value also includes impacts attributable to net imports embodied through indirect emissions Total value of externality corresponds to about 4% of total economic value of Austrian economy in 2008. EM+ scenario generates lower externalities but the year-by-year differences are overall very small in absolute magnitude, about 100 million euros
6
smaller than in BAU in 2030, which is 0.3% less in relative terms. We get qualitatively similar results for the externalities attributable to direct emissions, but they correspond about 1.3% of total economic value of Austrian economy.
Different sectors contribute to the total outcome on externalities attributable to direct emissions differently. We find that EM+ will generate small benefits due to changes in the structure of domestic economic sectors, while changes in vehicle fleet and hence fuel use solely will result in about 2.5 times larger benefits than the change in overall economy structure. Annual environmental benefits of EM+ are about 80 to 90 million euros after 2025. However, EM+ scenario would also lead to changes in electricity market that would result on the contrary in damage of value about 10 to 33 million euros in the same period as the benefits would be generated. This environmental damage is however not sufficiently large to counterbalance the environmental benefits, yielding overall net benefits.
We note that our conclusion for Austria cannot be generally supported, since the overall result on the effect of electromobility on external costs will strongly depend on the technology mix to generate electricity. Positive finding for Austria is partly determined by environmentally-friendly technology mix to generate electricity, whereas more polluting electricity generating technology mix might switch environmental benefits of electromobility towards environmental damage.
The structure of this report is as follows. Chapter 2 describes our method and this chapter presents Deliverable 9.2 of DEFINE project. Chapter 3 applies this method to quantify the external costs of electromobility, specifically of EM+ scenario in Austria. This chapter presents actually Deliverable 9.1 of DEFINE.
7
2 The Method
2.1 The ExternE Impact Pathway Analysis
Environmental benefits due to electro-mobility are quantified using Impact Pathway Analysis (IPA) developed within the most recent ExternE projects (Externalities of Energy)1. The IPA is an analytical procedure examining the sequence of processes through which polluting emissions result into external damages. The method allows estimating the marginal physical impact and the marginal cost of pollution from any emission source, as a function the technology and of the location of the plant.
The IPA comprises four basic steps:
i. selection of the reference power plant, determination of the technology used and of harmful emissions released,
ii. calculation of changes in pollutant concentration for all affected regions using atmospheric dispersion models,
iii. estimation of physical impacts from exposure using concentration-response functions, and
iv. economic valuation of impacts using direct costs (effect on crop yield, damage on building materials or biodiversity) or compensating/equivalent surplus measured through the willingness-to-pay approach.
The ExternE’s IPA method is very similar to an integrated assessment model used in the American studies to connect emissions to changes in concentrations, human exposures, physical effects and monetary damages by the Air Pollution Emission Experiments and Policy model (APEEP, see for instance, Muller and Mendelsohn 2007, 2009; Muller et al. 2011; Grossman et al. 2011).
The ExternE and IPA is widely accepted method for deriving benefits of new governmental proposals, programs or policies in Europe or in order to derive new sustainability indicators. For instance, Holland et al. (2011) performed cost-benefit analysis of Scenarios for Cost-Effective Emission Controls after 2020, Holland et al. (2014) conducted CBA on the EU’s Thematic Strategy on Air Pollution (TSAP) and Pye et al (2008) analysed cost and benefits of Proposed Revisions to the National Emission Ceilings Directive. Each of them based their assessment of environmental impacts
1 The European Commission in collaboration with the US Department of Energy launched a joint research projects to assess the energy-related externalities in 1991 (European Commission 1995; ORNL and RFF 1995).
Following a detailed bottom-up methodology relying on impact pathway approach, the EU/US studies provided estimates of marginal external costs of electricity production from a wide range of energy technologies at various locations. The EC provided additional funding over the years to improve the ExternE accounting framework and to expand it to new EU member states and to other non-EU countries. The ExternE IPA framework that we use has been recently updated within the NEEDS project (http://www.needs-project.org/).
For more information on ExternE see http://www.externe.info.
8
and benefit on the ExternE’s IPA approach. Similarly, Maliszewska et al. (2010) or Ecorys & CASE (2012) used the ExternE to quantify environmental impacts of a Free Trade Agreement between the European Union and The Russian Federation or between the European Union and Georgia and Moldova, respectively.
The ExternE’s IPA has been particularly widely used to assess the external costs of energy technologies (Sundqvist and Söderholm 2002; Sundqvist et al., 2004; Spadaro and Rabl 2007;
Pietrapertosa et al. 2009), but more recently this method has been also applied to quantify benefits in other sectors (see, for instance, results of MethodEx or EXIOPOL EU funded projects). Maca et al.
(2012) compare the external costs and current regulation in order to derive the rate of external cost internalisation in countries of Central and Eastern Europe. Weinzettell et al. (2012) quantify the production-based and consumption-based external costs of electricity production in Europe in order to provide better sustainable indicator of environmental impacts.
The results from the ExternE’s IPA have been frequently used in a policy impact assessment by means of various macro models as well. Rafaj and Kypreos (2007) or Rečka and Ščasný (2013) analysed impacts of various policies on energy system by linear optimisation or partial equilibrium models. Using macro-econometric E3ME model, Barker and Rosendhal (2000) estimate the co- benefits from SO2, NOx and PM10 reduction as an effect of carbon tax for Western Europe, and Ščasný et al. (2009) estimate the impact of energy taxation and emission charges that reflect the external costs for the Czech Republic. Again utilizing the ExternE’s results, as an example, Van Regemorter (2008) assess the macroeconomic impacts of NEC Scenarios with CGE GEM-E3 model, and Kiulia et al. (forthcoming) analyse economic impact and environmental benefits by CGE model applied on the Czech economy. Ščasný et al. (2015) then link integrated assessment model WITCH and the ExternE’s IPA to quantify ancillary benefits of carbon mitigation policies in Europe, when the ancillary benefits are quantified by ExternE’s IPA.
The IPA procedure has been incorporated into EcoSense tool – the integrated atmospheric dispersion and exposure assessment model –, which was developed mainly within the NEEDS EU funded project (Preiss and Klotz 2008). EcoSense tool uses air transport models to control changes in the atmospheric concentration of pollutants at each local, regional and global level. Specifically, it uses three models of air quality: (i) the Industrial Source Complex Model for transport of primary air pollutants on a local scale delaminated by 100 x 100 km around the power plant, (ii) the EMEP/MSC- West Eulerian dispersion model for modelling transport and chemical transformation of primary pollutants on a regional scale covering all Europe, and (iii) the N-Hemispheric Model which served for estimation of the intercontinental influence primary and secondary pollutants.
The model then determines a range of impacts on human health, buildings, biodiversity, and crop yields using concentration-response functions. The quantification of economic impact of micro- pollutants is based on generic estimates of marginal costs – i.e. the same damage value regardless
9
which country releases the micro-pollutant – as estimated in the ExternE project series (especially NEEDS). The loss of ecosystems is assessed using a measure of Potential Disappeared Fraction of species (Frischnecht and Steiner 2006) linked to acidification and eutrophication. Concentration- response functions are utilized to estimate the economic loss from mortality and morbidity, from agricultural productivity losses and for damages to building materials. Valuation methods of welfare economics are used to translate the physical impacts into monetary impacts.
Impacts on human health, mainly on mortality, are the most important among all impacts. In order to establish a causal relationship between pollution and human morbidity and mortality, ExternE uses concentration-response functions calibrated using a large number of epidemiological and toxicological studies. At the beginning of the ExternE project the CRFs of all European countries were calibrated using studies for the United States. The European functions have been re-calibrated using epidemiological and toxicological studies for Europe. The economic loss due to increased mortality is estimated using the Value of Life Year (VOLY) (Desaigues’ et al. 2011), reflecting recent changes in the ExternE methodology. Previously, ExternE used a uniform Value of Statistical Life (VSL) to value excess mortality. Several studies have argued that the VSL is appropriate to value the loss of – usually large – losses of life expectancy from fatal accidents but it should not be used to estimate the – usually smaller – impact of pollution on life expectancy, especially of elderlies (Rabl et al. 2014).
Regardless which one of the two metrics is used, they should be both based on the willingness to pay for a small reduction in risk of dying (Hammitt 2007). In the ExternE’s IPA, the VOLY for so called acute and chronic mortality is set at €60,000, or €40,000, respectively, and these values have been also recommended to be used in cost–benefit analyses of EU-level policies using the external costs.
Morbidity increases medical costs and causes a loss of productivity, but it also causes large disutility from pain, suffering and other inconveniences. We follow here the valuation of additional morbidity proposed in the NEEDS update of ExternE. Their values range from 1 € for each use of bronchodilator to 200,000 € per new case of chronic bronchitis.
Crop losses are valued at the international market prices. The impacts on building materials are assessed using replacement and maintenance costs, and the assessment of biodiversity impacts is based on restoration costs.
In our quantification, we use country-specific impact expressed in 2005 Euro per ton of emission of pollutant, as estimated in the project NEEDS. Table 1 describes the unit external costs per ton of emissions released from emission sources in Austria, based on damage factors derived within NEEDS project (Preiss and Klotz 2008). We include the most common air pollutants (SO2, NOx, PM2.5, PM10, NMVOC, NH3) in our assessment of damage.
10
Table 1. Average damage factors for air quality and GHG pollutants - Austria (Euro2005 per ton)
SO2 NOX NH3 NMVOC PMcoarse PM2.5 CO2
Health effects 7,719 9,533 11,711 1,015 1,202 29,556
Loss of biodiversity 507 1,638 6,869 -85 0 0
Crop yield -89 570 -103 126 0 0
Materials 357 144 0 0 0 0
Health effects due to North
Hemispheric modelling 278 131 2.7 358 2.1 158
Climate change - - - - - - 20
Note: PMcoarse indicates particulate matters with an aerodynamic diameter between 2.5 and 10 µm.
Unit damage cost due to other non-CO2 green-house gasses is 420 € per t CH4 and 6,200 € per t of N20 assuming 21 and 310 GWP factors.
An important part of the external costs are associated with climate change impacts. External costs due to climate change may be expressed considering two different conceptual approaches. First, the costs of carbon might be based on abatement costs of reaching certain policy target, i.e. the cost of action. An indication about the abatement costs can provide actual or forecast market permit price, or it can result from ex ante modelling (see, for instance, Carraro and Faveli 2009 for a review).
However, this approach provides correct damage estimates only if policy target is also socially optimal, i.e. when the marginal abatement costs are equal to marginal external benefits.
Following to welfare economics, quantified impacts of climate change should be rather based on marginal damage costs of carbon, commonly referred to as the Social Costs of Carbon (SCC). These costs present a difference in net benefit streams over long time period estimated for a scenario with and without a release of a certain volume of carbon emission and expressed in present values using discounting. Both of these discounted streams of net benefits result from an integrated assessment model, such as FUND or DICE, which usually differ in a range of impacts covered, time span covered or climate sensitivity assumed (Tol 2009). Apart from the given model structure, there are at least two key parameters of integrated assessment models that can drive the differences in climate change damage estimation: it is the utility discount rate (i.e. pure rate of time preference) and equity weights which both have to be arbitrarily chosen by an analyst, (see e.g. OECD 2008, or Heal 2009 for more details).
Since Social Cost of Carbon estimations require using a mix of positive and normative approaches in modelling, there cannot be one generally agreed value of Social Cost of Carbon. For instance, a review of SSC estimates by Tol (2005) reports the mean of SSC at €26 per tonne of CO2 and median equal to €4; if peer reviewed studies are considered only the mean goes at €14. Stern (2007) in his review suggests the Social Cost of Carbon would start around €20-24 if the target were between 450-
11
550 ppm CO2-eq., and the cost of inaction might have a value of €68 per ton of CO2 (that is, if we follow business as usual trajectory).
To quantify damages associated with climate change impacts in our study, we consider the central value of 20 € per ton of CO2, as it had been used in the impact assessments being based on ExternE so far.2
In climate change impact assessment, we particularly follow the recommendation of the large-scale integrated project NEEDS (Preiss and Kloz 2009) that reports the value of 19 € per ton of CO2 as the central value of SCC. This recommendation is based on probabilistic estimate of SCC by the FUND model assuming 1 % pure rate of time preference, world average equity weighting and using 1 % trimmed mean of SCC estimates (Anthoff 2008). The resulting value of SCC equals to 20.3 € per ton of CO2. The value of around 20 € is also close enough to the marginal abatement cost estimates; for instance, Carraro and Faveli (2009) analyse CO2 price uncertainty in detail and suggest the mean value of €21 per tonne of CO2 avoided in 2009 or €31 per tonne of CO2 avoided in 2012. Capros and Mantzos (2000) report a range of SCC values between 5 and 38 € per tonne of CO2 avoided for reaching the Kyoto targets for the EU. International Center for Climate Change that regularly reviewed the economic models for long-term carbon price evaluation provides the average of carbon price at about €43 (s.d. €29) in 2020 for 450 ppm, or €23 (s.d. €20) for 550 ppm stabilisation target, respectively.
2.2 Linking the hybrid CGE model to the ExternE’s IPA approach
By means of the hybrid computable general equilibrium model developed within DEFINE project, the effects on economy and electricity generation are quantified. The ExternE’s IPA then allows deriving monetised benefits of the environmental impacts associated with air quality and GHG pollutants.
In order to quantify the environmental and health benefits associated with the effects of electro- mobility on economy and energy system, the two modelling approaches - the hybrid CGE model and the ExternE’s IPA – needs to be linked. The two models are linked through emission factors linked to variables endogenously determined by the hybrid CGE model.
Specifically, we consider the environmental and health effects attributable to
(i) direct emissions stemming from domestic economic production and derive the emission- output factors,
2 Within the ExternE project series (e.g. Externe-pol, 2004), the damage of climate change was based on the abatement costs to reach the Kyoto target by the EU-15 countries. Specifically, the central value of 19 € per tonne of CO2 is based on the estimate by Fahl et al. (1999) which is the costs to meet a 25% emission reduction from 1990 to 2010 for Germany.
12
(ii) indirect emissions attributable to all imported goods produced worldwide and derive the emission-import factors,
(iii) direct emissions released by vehicles and derive the emission-fuel use factors, and
(iv) direct external costs associated with electricity generation when the damage factors per kWh electricity generated in various technologies are utilized.
Quantification of emissions for BAU and policy scenario for (i) and (ii) implicitly assumes that the emission factors remain constant across time. Resulting emission levels will capture the effect of changing scale of the economy, the effect of changing economic structure and the effect of factor (including energy) substitution. Keeping the emission factor per sector same, however, presumes a]
no improvement in efficacy of the end-of-pipe abatement technologies, including introducing carbon capture and storage abatement options, and b] same structure of emission-generating technology in given sector over time.
In order to consider the effect of possible changes in technology, we quantify emissions attributable to car usage and electricity generation outside of the economic production module. While the emission factors of economic production and imports are based on CREEA multi-regional environmentally-extended input-output database that describes state of the economy in year 2007, the emission factors for the two key technologies are derived elsewhere.
Specifically, the emission factors per fuel use in passenger vehicles and freight transport are based on TREMOVE model from which we generate time variant emission factors (see below).
Utilizing CASES database on external costs per wide set of technologies, we derive the damage factors per each electricity generating technology that are included in the electricity model embodied in the hybrid CGE model.
To avoid double-counting, the effects captured under (iii) and (iv) category are subtracted from the effects that are captured in the (i) category. Next sub-chapters describe our approach in detail.
2.2.1 Direct emissions stemming from domestic economic production,
Damage factors per pollutant are linked to economic output endogenously determined by the hybrid CGE model through the emission-output coefficients. The emission factor for each economic sector in the CGE model is derived from Exiobase 2.2. database – as developed most recently within CREEA project - where 200 product categories and 163 industry sectors were merged into 22 sectors used in CGE model (see Table A1 in Appendix). Economic values in both CREEA database and SAM are recorded in basic prices, what makes our link consistent.
13
Exiobase database records emission for both economic production of each industry and final demand of households. After merging CREEA categories into 22 sectors, we derive an average emission factor per sector i (EFi) considering the emissions attributable to both domestic economic production by sector i (Qi) as well as the emissions attributable to household final demand on product i (FDi) as follows:
(
⁄∑ ) ( )
where EF is emission factor P denotes pollutant and subscripts i, q and h describes sector as used in SAM and CGE model, economic production, and final use of households, respectively.3 The term Q described sector economic output. We subtract taxes on trade (INTTAX) equal to 6,087 million € form output (these taxes are subtracted from output in proportion to sector output on total output).
Exiobase database records data for wide range of environmental pressures and impact categories. In our assessment, we account for emission for air quality pollutants (SOx, NOx, NH3, CO, NMVOC, PM10, PM2.5, and TSP) and GHGs (CO2, CH4, N2O). These emissions are recorded for combustion and non-combustion processes separately.
2.2.2 Indirect emissions attributable to all imported goods produced worldwide
Emissions embodied in imports are calculated using MRIO data for total imported products and include total embodied emissions. Total imports are derived from information for individual countries since the MRIO imports are in exporter values (more important for the correct allocation of their footprints). Some imports are directly exported, therefore those are reported separately.
Footprints are calculated using product-by-product MRIO model under industry technology assumption (similarly as Weinzettel et al. 2012; 2014). The 200 product categories listed in Exiobase are then merged into 22 sectors used in the CGE model. Same emissions as accounted in the assessment of direct emissions are also accounted to derive the factors for indirect emissions, i.e.
embodied in imports.
To derive the emission factors for imported goods we consider economic value of net imports only, i.e. economic value of exported imports are excluded.
3 We implicitly assume same share of final demand of household on total economic production. Incorporating simplified assumption on foreign trade in the hybrid CGE model (i.e. Armington trade elasticities equal to zero) allows us to relying on the average emission factor.
14
2.2.3 Emissions factors from passenger car and freight fleet
This section details how fleet-wide emission factors for passenger car fleet for Austria, Germany and Poland were derived. In order to keep a common methodology the transport emission model TREMOVE4 were used as a point of departure mainly because it contains all the relevant data for this task for all the three countries.5 The base-case scenario was taken as a baseline for deriving emission factors in business-as-usual situation. The emission coefficients are expressed in grams per MJ based on weighting of fuel type and region (but no distinction is made with respect to vehicle ownership).
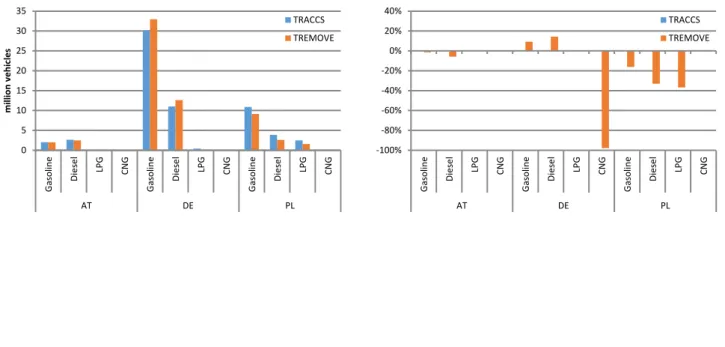
In order to check the accuracy of TREMOVE estimates we checked the predictions for 2010 with data in TRACCS database.6 Comparison of TRACCS statistical data and TREMOVE prediction (base-case run) of vehicle stock and fuel consumption shows relatively significant differences in all three countries.
The most profound differences in per-cent terms are an underestimation of CNG cars and fuel use in Germany, and LPG cars and fuel use in Poland. In terms of absolute numbers and volumes, the most profound differences are overestimated car stock and diesel and gasoline consumption in Germany, substantial underestimation of gasoline and to lesser extent also diesel consumption in Austria and underestimation of both car stock and fuel consumption in Poland.
Figure 1 – Absolute and relative differences in predicted and real vehicle stock (2010)
4 The latest public version is 3.3.2 dated July 2011. See http://www.tmleuven.be/methode/tremove/home.htm for model’s code and details. Updated TREMOVE model v 2.7 was inter alia used in a World Bank study Transition to a low-emissions economy in Poland.
5 German transport emission model TREMOD would be an alternative for Germany, but it is neither publicly available nor provides data for other two countries.
6 An outcome of DG CLIMA project on collection of transport data to support the quantitative analysis of measures relating to transport and climate change; see http://traccs.emisia.com/
0 5 10 15 20 25 30 35
Gasoline Diesel LPG CNG Gasoline Diesel LPG CNG Gasoline Diesel LPG CNG
AT DE PL
million vehicles
TRACCS TREMOVE
-100%
-80%
-60%
-40%
-20%
0%
20%
40%
Gasoline Diesel LPG CNG Gasoline Diesel LPG CNG Gasoline Diesel LPG CNG
AT DE PL
TRACCS TREMOVE
15
Figure 2 – Absolute and relative differences in fuel consumption (2010)
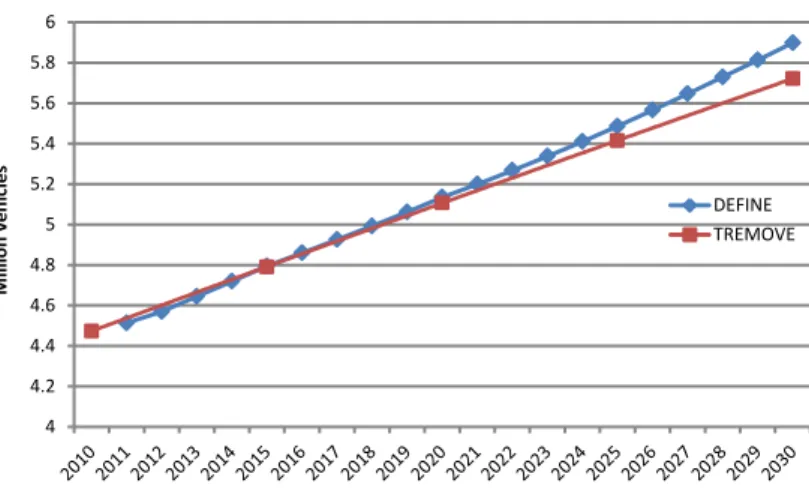
Next we compared the predicted passenger vehicle stock from TREMOVE model with predictions in BAU scenario in DEFINE project. For Austria these predictions are very close – the difference in 2030 is mere 3% as can be seen in the following figure.
Figure 3 – Comparison of predicted passenger car stock in Austria
Since no prediction was made for Poland in DEFINE yet, we turn our attention to official Polish prognosis developed as part of national Transport development strategy (Strategia rozwoju transport). The original prognosis by prof. J. Burnewicz (Burnewicz, 2012) was further elaborated by Waśkiewicz and Chłopek in their projections of demand for passenger cars and related energy consumption by 2030 (Waśkiewicz & Chłopek, 2013).
The comparison of energy consumption from both predictions is show in the following figure.
Apparently, the two predictions differ in several aspects but more in respective fuel consumption trajectories than the final share in 2030; the main difference is in the overall consumption (lower in TREMOVE prediction) and in CNG consumption – close to zero over the entire 2010-2030 compared to steep rise after 2020 in Waśkiewicz & Chłopek prediction.
0 5 10 15 20 25
Gasoline Diesel LPG CNG Gasoline Diesel LPG CNG Gasoline Diesel LPG CNG
AT DE PL
Million tonnes TRACCS
TREMOVE
-100%
-80%
-60%
-40%
-20%
0%
20%
40%
Gasoline Diesel LPG CNG Gasoline Diesel LPG CNG Gasoline Diesel LPG CNG
AT DE PL
TRACCS TREMOVE
4 4.2 4.4 4.6 4.8 5 5.2 5.4 5.6 5.8 6
Million vehicles
DEFINE TREMOVE
16 Figure 4 – Comparison of predicted energy consumption
TREMOVE Waśkiewicz & Chłopek
In order to assess the magnitude of effects of different vehicle stock and energy consumption developments on averaged passenger vehicle emission factors we recalculated emission factors derived from TREMOVE base-case run to prediction of Waśkiewicz & Chłopek by reweighting the shares of respective fuels. This effectively accounts for change in vehicle stock but does not account for (possible) relative changes in vehicle emission profiles by these fuels.7 The differences are however only marginal, not exceeding 7% in any of the pollutants. The following figure shows this comparison graphically.
Figure 5 – Comparison of averaged emission factors
original TREMOVE TREMOVE reweighted by Waśkiewicz & Chłopek
Note: The y axes have logarithmic scales.
The resulting emission factors are displayed in tables A2 and A3 in Appendix. These factors are expressed per physical unit of fuel consumption. In order to link them to fuel use that is determined by the hybrid CGE model, we recalculate them in monetary units by using average pre-tax price of diesel and petrol taken from IEA/OECD statistics on Prices and Taxes for the year 2008. We assume
7 In principle, TREMOVE model allows for adjustments that would effectively backcast a development similar to that predicted by Waśkiewicz & Chłopek. This would however necessitate effort beyond the scope of this project.
0.0 0.5 1.0 1.5 2.0 2.5 3.0 3.5 4.0 4.5
2010 2020 2030
Million tonnes
gasoline diesel LPG CNG
0.0 0.5 1.0 1.5 2.0 2.5 3.0 3.5 4.0 4.5 5.0
2010 2015 2020 2025 2030
Million tonnes
gasoline diesel LPG CNG
0.1 1 10 100 1000 10000 100000
g/MJ
C6H6 CO CO2 CO2_w2t NMVOC NOx PM PM_non SO2 VOC TOFP
0.1 1 10 100 1000 10000 100000
g/MJ
C6H6 CO CO2 CO2_w2t NMVOC NOx PM PM_non SO2 VOC TOFP
17
33.60 MJ/l (density of diesel 0.84 kg/l and of petrol 0.75 kg/l), and 25% share of diesel on propellant use in passenger cars, 100% share used in freight.
The emission factors for GHGs (CO2, CO2 w2t, CH4, N2O) and air quality pollutants (SO2, NOx, NH3, NMVOC, PM2.5 and PMcoarse) as expressed in tones of emission per EUR of pre-tax expenditures on fuel are multiplied by fuel use in passenger cars and other vehicles (freight). Fuel use is endogenously determined for each scenario and over the period until 2030 by the hybrid CGE model and it is expressed in basic, pre-tax, prices.
External costs associated with fuel use in vehicles can be quantified by utilising two different approaches.
At first, the emission factors as derived from the Exiobase CREEA database for direct emissions can be linked to FUEL output as determined from the hybrid CGE model. For example, FUEL use in Austria in the base 2008 year is 4,610 million € (after adjustment by taxes on trade, INTTAX). Multiplying this output by the factor on direct emissions from combustion, we get the external costs of 125 million € for the base year 2008.
Second approach may utilize the emission factors as we derive them from TREMOVE database.
Resulting external costs for using fuels in passenger cars and freight transport are 1,636 million € (excluding indirect impacts due to CO2 w2t), that is a value one order of magnitude larger than the value we get in the former approach.
To validate the approach we follow in our study, we examine the emission factors for FUEL use from both Exiobase database and TREMOVE data. We report here our comparison of the factors for CO2 emission that is easy to relate to realistic value. Following stoichiometry (and when no carbon capture and storage technology in transport sector is used) we expect the emission factor of about 3.6 kg of CO2 per kg of fuel, considering the average pre-tax price of fuel in Austria in 2008 of 0.572 € per litre or 0.741 € per kg of fuel, we get the factor of 4.9 kg CO2 per € (pre-tax price). Deriving the emission factors by the former approach (based on Exiobase data) we got 0.36 kg per € that is one order of magnitude smaller factor that one would expect. On the other hand, we get the factor of 4.3 kg per € spent on fuel used in passenger cars or 5.0 kg per € spent on fuel used in freight transport if we rely on our factors derived from TREMOVE data. We therefore follow the latter approach (based on TREMOVE database) to quantify the externalities for car use. To avoid double-counting, we subtract the emissions and hence externalities attributable to FUEL use that were quantified by using economic output and the emission factors based on Exiobase data.
18
2.2.4 Direct emissions associated with electricity generation
Similarly, as in the case of deriving the external costs associated with fuel use in vehicles, there are two approaches at hand to derive the external costs associated with electricity generation.
First approach is based on the emission factors as derived from Exiobase database that are linked to electricity production determined from the CGE model. For instance, electricity production in Austria in the base year 2008 is 4,990 million € (after adjustment by taxes on trade, INTTAX). Multiplying this output by the emission factor derived from Exiobase, we get total externalities attributable to direct emissions of 452 million € (BAU 2008).
Second approach utilizes CASES database on the external costs of electricity generating technologies.
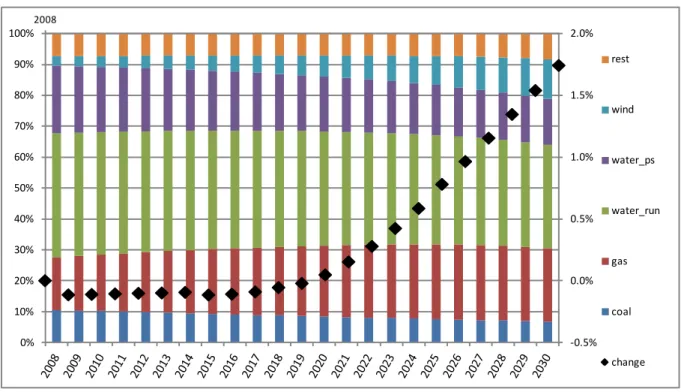
External costs per kWh of electricity generated in Austria for the period of 2005-2010 are described in Table 2, more detailed information is provided in Table A4 in Appendix. Externalities of hydro power run on river are weighted by externalities as derived in CASES for three different capacities, taking their share for the year 2008. Utilizing this damage factors, we get total external costs attributable to electricity generation in Austria in the base year of the baseline scenario at 502 million €. The result from both of these approaches yield close estimates one to the other. In order to account for differences in technology and fuel mix in power sector over time under the policy scenario, we follow the latter approach based on CASES database, whereas the amount of externalities associated to electricity production as derived by the former approach are subtracted from aggregated values to avoid double-counting.
Table 2. External costs of electricity generation due to operation and fuel use in Austria, €c/kWh.
Technology electric model (hybrid CGE)
2005-2010 Envi Health Climate
change Total
hydro run of river water_run 0.0015 0.0164 0.0077 0.0256
natural gas combined cycle gas_sewage 0.0715 0.4204 0.8967 1.3886 hard coal condensing power plant coal_black 0.1593 1.2457 1.7176 3.1226
biomass (woodchips) CHP biomass 0.0665 0.4266 0.1157 0.6089
biogas biogas 0.1530 1.8103 0.5879 2.5511
wind wind 0.0030 0.0377 0.0117 0.0524
hydropower, pump storage water_ps 0.0004 0.0045 0.0018 0.0067
solar PV open space pv 0.0129 0.1749 0.0522 0.2400
natural gas, gas turbine gas_natural 0.1079 0.6303 1.3416 2.0798
Note: Externalities associated with up-stream impacts (construction) are not considered.
Source: CASES project
19
To quantify external costs associated with electricity generation we derive electricity production in kWh from electricity production in basic EUR price from the CGE model. Electricity production per each technology expressed in physical units (kWh) is derived as a ratio of electricity production in expressed in EUR (basic prices) and implicit price of kWh generated by given technology. The implicit price is computed from electricity production expressed in EUR in SAM and TWh generated per technology in Austria in 2008, and as a result, it is expressed in EUR basic prices.
20
3 Results – Quantification of external costs of EM+ for Austria
3.1 External costs attributable to fuel use in vehicles
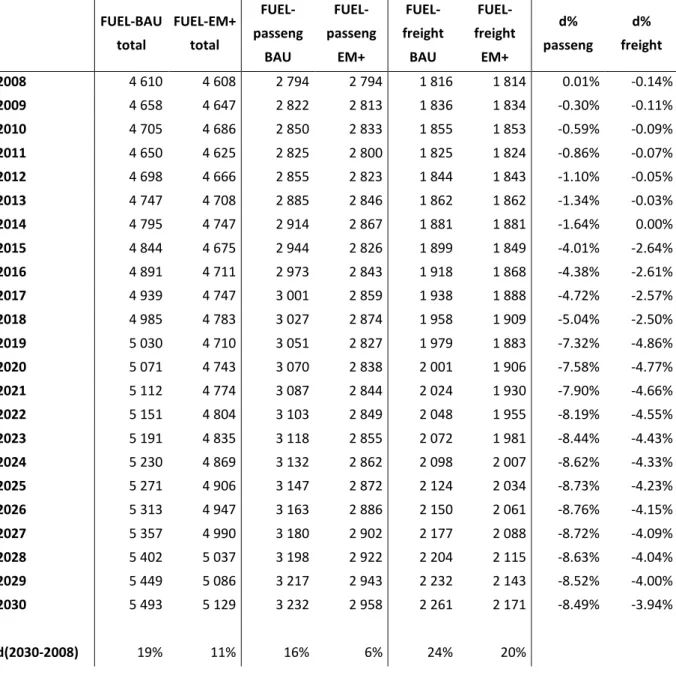
Fuel use for BAU and EM+ for Austria is displayed in Table 3. Over the period 2008-2030, fuel use is increased by 19% in the baseline scenario, mainly in other transportation than in passenger cars.
EM+ results in lower use of fuels in cars, but overall consumption increases over time.
Table 3. Fuel use in million EUR, 2008-2030, Austria
FUEL-BAU total
FUEL-EM+
total
FUEL- passeng
BAU
FUEL- passeng
EM+
FUEL- freight
BAU
FUEL- freight
EM+
d%
passeng
d%
freight
2008 4 610 4 608 2 794 2 794 1 816 1 814 0.01% -0.14%
2009 4 658 4 647 2 822 2 813 1 836 1 834 -0.30% -0.11%
2010 4 705 4 686 2 850 2 833 1 855 1 853 -0.59% -0.09%
2011 4 650 4 625 2 825 2 800 1 825 1 824 -0.86% -0.07%
2012 4 698 4 666 2 855 2 823 1 844 1 843 -1.10% -0.05%
2013 4 747 4 708 2 885 2 846 1 862 1 862 -1.34% -0.03%
2014 4 795 4 747 2 914 2 867 1 881 1 881 -1.64% 0.00%
2015 4 844 4 675 2 944 2 826 1 899 1 849 -4.01% -2.64%
2016 4 891 4 711 2 973 2 843 1 918 1 868 -4.38% -2.61%
2017 4 939 4 747 3 001 2 859 1 938 1 888 -4.72% -2.57%
2018 4 985 4 783 3 027 2 874 1 958 1 909 -5.04% -2.50%
2019 5 030 4 710 3 051 2 827 1 979 1 883 -7.32% -4.86%
2020 5 071 4 743 3 070 2 838 2 001 1 906 -7.58% -4.77%
2021 5 112 4 774 3 087 2 844 2 024 1 930 -7.90% -4.66%
2022 5 151 4 804 3 103 2 849 2 048 1 955 -8.19% -4.55%
2023 5 191 4 835 3 118 2 855 2 072 1 981 -8.44% -4.43%
2024 5 230 4 869 3 132 2 862 2 098 2 007 -8.62% -4.33%
2025 5 271 4 906 3 147 2 872 2 124 2 034 -8.73% -4.23%
2026 5 313 4 947 3 163 2 886 2 150 2 061 -8.76% -4.15%
2027 5 357 4 990 3 180 2 902 2 177 2 088 -8.72% -4.09%
2028 5 402 5 037 3 198 2 922 2 204 2 115 -8.63% -4.04%
2029 5 449 5 086 3 217 2 943 2 232 2 143 -8.52% -4.00%
2030 5 493 5 129 3 232 2 958 2 261 2 171 -8.49% -3.94%
d(2030-2008) 19% 11% 16% 6% 24% 20%
Source: Hybrid CGE model (Miess and Schmelzer 2015)
21
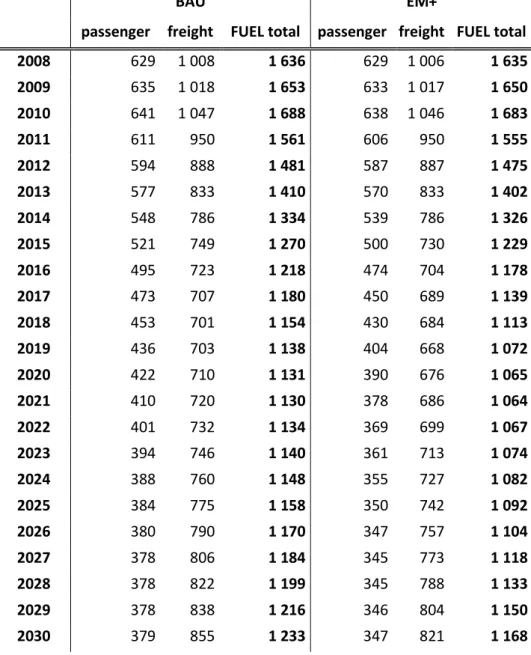
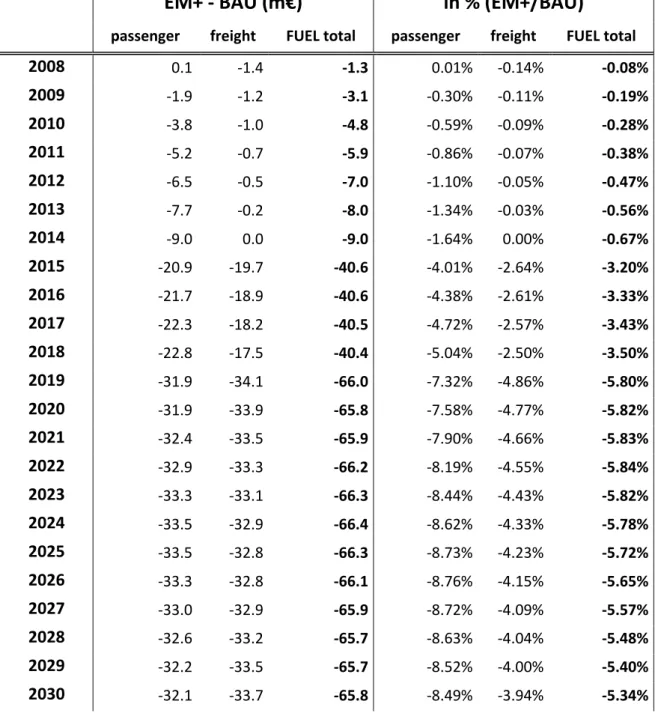
External costs attributable to emissions released from fuel use in cars are estimated at about 1,636 million euros in 2008. Despite the fact that fuel use is increasing over time (by +16% in passenger cars, or +24% in freight transport, respectively), total damage in the baseline scenario is declining over time as a result of increasing share of AFVs and declining emission intensities (see the emission factors in table A2 in Appendix) and it reaches a value of 1,233 million euros in 2030 (by -25%). EM+
slows down the increase in fuel use (by +6% and +20% only) and simultaneously enhances more the uptake of AFVs. As a consequence, total external costs of EM+ declines at 1,168 million euros in 2030, that is 29% less than in the reference 2008 year.
Table 4. External costs attributable to fuel use in vehicles, 2008-2030, Austria.
BAU EM+
passenger freight FUEL total passenger freight FUEL total
2008 629 1 008 1 636 629 1 006 1 635
2009 635 1 018 1 653 633 1 017 1 650
2010 641 1 047 1 688 638 1 046 1 683
2011 611 950 1 561 606 950 1 555
2012 594 888 1 481 587 887 1 475
2013 577 833 1 410 570 833 1 402
2014 548 786 1 334 539 786 1 326
2015 521 749 1 270 500 730 1 229
2016 495 723 1 218 474 704 1 178
2017 473 707 1 180 450 689 1 139
2018 453 701 1 154 430 684 1 113
2019 436 703 1 138 404 668 1 072
2020 422 710 1 131 390 676 1 065
2021 410 720 1 130 378 686 1 064
2022 401 732 1 134 369 699 1 067
2023 394 746 1 140 361 713 1 074
2024 388 760 1 148 355 727 1 082
2025 384 775 1 158 350 742 1 092
2026 380 790 1 170 347 757 1 104
2027 378 806 1 184 345 773 1 118
2028 378 822 1 199 345 788 1 133
2029 378 838 1 216 346 804 1 150
2030 379 855 1 233 347 821 1 168