Bhutan Poverty assessment
2014
National Statistics Bureau
Royal Government of Bhutan The World Bank
Public Disclosure AuthorizedPublic Disclosure AuthorizedPublic Disclosure AuthorizedPublic Disclosure Authorized
90523
Copyright © National Statistics Bureau, 2014 www.nsb.gov.bt
ISBN 979-99936-28-26-2
Design by Loday Natshog Communications (tashdezyn@gmail.com)
Acknowledgements iv Foreword v Foreword vi
Abbreviations and Acronyms vii
Executive Summary viii
CHAPTER 1: Introduction 01
CHAPTER 2: Evolution of Poverty, Shared Prosperity and Inequality in Bhutan 05 2.1. Consumption Poverty, Multidimensional Poverty and Happiness 05 2.1.1. Decline in Multidimensional poverty between 2007 and 2012 07
2.1.2. Shared Prosperity 09
2.1.3. Mobility in and out of Poverty between 2007 and 2012 09
2.1.4. Growth in Bhutan has been Pro-Poor 10
2.2. Stable Inequality 12
2.2.1. Uneven Poverty Reduction across Dzongkhags 13 CHAPTER 3: Changing Profiles of the Poor and Bottom 40 Percent of the Population 17
3.1. Welfare Indicators (Assets and Amenities) 17
3.2. Health and Nutrition 18
3.3. Gender and Poverty 22
3.3.1. Is Poverty in Bhutan Gender-Blind? 22
3.4. Land Ownership and Poverty 23
CHAPTER 4: Enlarging Opportunities for Children 27
4.1. Inequality of Opportunity in Bhutan 27
4.2. Social Outcomes for Children in Relation to Birth Circumstances 29
4.3. Measuring Inequality of Opportunity 35
4.4. Drivers of Change 42
CHAPTER 5: Key Drivers of Poverty Reduction in Bhutan 45
5.1. Trading Out of Poverty 47
5.2. Roads Out of Poverty 50
5.3. The Hydro Effect 53
5.4. Who were Better Able to Escape Poverty between 2007 and 2012? 53 5.5. The Main Drivers of Poverty Reduction from People’s Perspective 54 5.6. Better Returns on Individual’s Assets Underpin Faster Reduction in Poverty 55
5.7. Composition versus Structure 56
CHAPTER 6: Poverty Reduction in Bhutan: Sustainability, Vulnerability and Suggested Remediation 61 Annex A: Sources of Variation in Poverty Outcomes in Bhutan 68 Annex B: Poverty Dynamics with Synthetic Panels – Framework and Results 88 Annex C: Qualitative Assessment of Poverty 101
Contents
Acknowledgements
This report is the first poverty assessment for Bhutan prepared by the World Bank jointly with the Royal Government of Bhutan through the National Statistics Bureau (NSB). It builds on Bhutan Poverty Analysis 2012, published by the NSB with technical assistance from the World Bank.
The study is led by Srinivasan Thirumalai (Senior Economist, SASEP) with team members drawn from the World Bank, NSB, and outside consultants. The Bank team comprised of Peter Lanjouw and Hai-Anh Dang (DECRG), Namgyel Wangchuk (SASEP), Minh Cong Nguyen (ECSP3), and Smriti Seth (DECWB). From the NSB’s Socio-Economic Analysis and Research Division, Lham Dorji (Dy. Chief Research Officer), Dorji Lethro (Senior Statistical Officer), Sonam Gyeltshen (Research Officer), and Cheku Dorji (Dy. Chief Statistical Officer, Coordination and Information Division) worked closely with the World Bank team.
Consultants who contributed to the study are Essama-Nssah, Nar Bahadur Chhetri, Krishna Parajuli and Sanjana Dulal.
We give special thanks to local officials and elected representatives (Gups) who facilitated focus group discussions and shared their views on development issues at the local level.
In this regard, we wish to especially thank
Tenzin Thinley (Dzongdag), Lhawang Dorji and Thinley Wangchuk (Gups) in Dagana, Karma Drukpa (Dzongdag), Tashi Rabten (GAO), Rinchen Lungten (Gup) in Zhemgang, Karma Wangdi (Dzongrab), Lepo and Chedup (Gups), Dawa Zangmo (GAO) in Pema Gatshel, Sonam Wangyel (Dzongdag), Karma and Tshering Samdrup (Gups) and Kinley Phuntsho (GAO) in Lhuentse. Focus group participants shared candid views and debated priority issues with endearing keenness.
The team benefited from the comments of peer reviewers Sabina Alkire, Vikram Nehru, Dean Jolliffe, and Sonam Tobgyel at concept stage and also at the final stage. We are grateful for comments by David Newhouse and Genevieve Boyreau for comments on an initial draft. We are thankful to the participants at the final review meeting held in Washington D.C and a consultative group meeting held in Thimphu to discuss the findings of the report.
Overall guidance for the study was provided by Ernesto May, Director (SASEP), Kuenga Tshering, Director General (NSB), Vinaya Swaroop (SASEP), Robert Saum (Country Director) and Genevieve Boyreau (Resident Representative).
Foreword
The National Statistics Bureau is pleased to present the Bhutan Poverty Assessment 2014 report prepared in collaboration with the World Bank. This report is a complement to the earlier Poverty Analysis Report (PAR) 2012 which was prepared with the World Bank’s Technical Support. The PAR 2012 provides estimates of consumption poverty, identified the trend and narrates the profile of the poor in terms of demographics and basic needs. Most of the poverty reduction in Bhutan has occurred in the rural areas with little change in urban poverty rates. Inequality has not changed significantly.
Poverty reduction in dzongkhags have been found to be uneven.
This report identifies the key drivers of rapid poverty reduction in Bhutan over the recent years, explaining why some dzongkhags are stuck in poverty or reducing poverty is not significant while others prospered, and whether female headed households have a harder time reducing poverty. The exercise draws mainly on data from the two rounds of Bhutan Living Standards Survey (2007 and 2012) supplemented with focus group discussions carried out for the report in select dzongkhags.
The report presents a more detailed analysis of the evolution of poverty, its distributional characteristics including inequality, mobility estimates; changing profiles of the poor and bottom 40 percent of the population; issues in expanding opportunities for children. This report probes the vulnerabilities in spreading prosperity in Bhutan and discusses the steps to be taken for sustained poverty reduction in Bhutan.
One of the factors contributing to poverty reductions is due to the noble Royal Kidu Program where many landless households were able to get land permanently registered in their names.
The findings from the participatory assessments listed small land holdings and landlessness as key constraints to achieving economies of scale in agricultural production.
This assessment report also shows that, among others, Bhutan’s poverty reduction has been rapid, broad-based and inclusive; in the long-term, sustainable poverty reduction depends on addressing persistent shocks, engendering private sector led development and defining clear target groups for poverty reduction. The main drivers of prosperity in rural Bhutan appear to be increasing commercialization of agriculture, an expanding rural road network and beneficial spillovers from hydroelectric projects.
I hope that this report becomes a comprehensive source of information towards further reduction of poverty especially in sections and areas where the poverty still remains high.
Finally, I wish to sincerely thank the World Bank for their continued support and would like to acknowledge the efforts of all officials and experts who were involved in this important exercise.
(Kuenga Tshering) Director General
Foreword
This report presents the first Poverty Assessment carried out in Bhutan by the World Bank in close collaboration with the National Statistics Bureau, Bhutan.
Bhutan well known as a pioneer of the Gross National Happiness concept has a noteworthy record in reducing poverty as well. Poverty reduction in Bhutan, as the report finds, has been rapid, broad-based and inclusive. Prosperity has been shared well in Bhutan with the bottom 40 percent enjoying faster growth than the rest.
There are potentially useful lessons for other countries aspiring for poverty reduction with shared prosperity.
Poverty reduction in Bhutan is well-founded in long-term economic development efforts of commercialization of agriculture, expanding rural road networks and beneficial spillovers from hydroelectric projects. A good governance infrastructure underpins the successes on poverty front. The pace of poverty reduction appears sustainable if the emerging risks and vulnerabilities are managed carefully.
Sustaining the examplary record of Bhutan's poverty reduction in the long-term would require mitigating risks from persistent shocks facing the agricultural sector, increasing reliance on private sector led development and building formal social protection for clearly identified population groups most vulnerable to poverty.
The findings of the report have directly influenced our engagement in Bhutan as reflected
in our "Country Partnership Strategy 2014- 2019". The identified drivers of poverty reduction and recommendations have translated into : (i) a focus on agriculture commercialization and marketization, and more broadly the sustainable contribution of green assets to socio-economic development, (ii) supporting a social protection strategy, with targeted safety nets build household's resilience, (iii) a continued focus on the private sector development to create jobs which improve living standards and are also a critical element of social cohesion, (iv) a renewed attention to transport and trade infrastructure, recognizing its critical role in reducing poverty;
(v) improving fiscal and spending efficiency to enable the Royal Government to continue improving the delivery of public services for the benefit of all.
We - at the World Bank - are committed to support shared prosperity and the fight against poverty throughout the world, and in Bhutan in particular, where we look forward to building on a strong partnership with the Royal Government and all stakeholders.
Genevieve Boyreau Resident Representative World Bank, Bhutan
GOVERNMENT FISCAL YEAR July 1 – June 30 CURRENCY EQUIVALENTS Currency Unit = Bhutanese Ngultrum (Nu)
US$1 = Nu 61.8 (March 25, 2014)
Abbreviations and Acronyms
BIMSTEC Bengal Initiative for Multisectoral Technical and Economic Cooperation BLSS Bhutan Living Standards Survey CBS Centre for Bhutan Studies CPIA Country Policy and Institutional
Assessment
DDS Dietary Diversity Score FANTA Food and Nutrition Technical
Assistance
FAO Food and Agricultural Organization FGT Foster-Greer-Thorbecke
FYP Five Year Plan
GAO Gewog Administrative Officer GDP Gross Domestic Product GIC Growth Incidence Curve GNH Gross National Happiness
HDDS Household Dietary Diversity Score HIV Human Immunodeficiency Virus HOI Human Opportunity Index
MDG Millennium Development Goal MIC Middle Income Country
MoAF Ministry of Agriculture and Forest MPI Multidimensional Poverty Index NPL National Poverty Line
NSB National Statistics Bureau OGTP One Gewog Three Products PAR Poverty Assessment Report RGoB Royal Government of Bhutan RNR Renewable Natural Resources
SAARC South Asian Association for Regional Cooperation
SAFTA South Asia Free Trade Agreement SAR South Asia Region
SL Standard of Living
TIP Three “I”s (incidence, intensity and inequality) of Poverty
Executive Summary
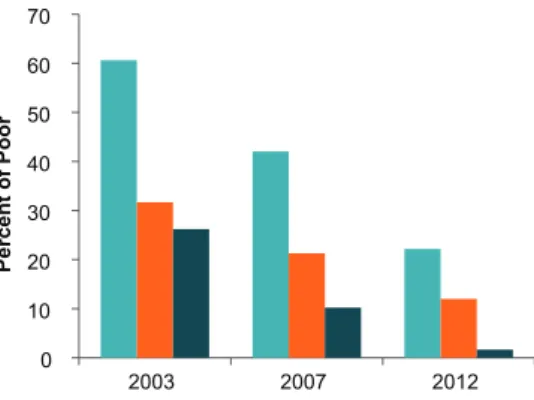
Bhutan’s poverty reduction has been rapid, broad-based, and inclusive. Between 2007 and 2012, the percentage of consumption poor halved to 12 percent. Bhutan has nearly ended extreme poverty1 within the living memory of a generation – extreme poverty touched a low of two percent in 2012 (Figure 0.1). Broader multidimensional poverty indices, that include education and health outcomes besides standards of living, also indicate a steep decline in the percentage of deprived population –by two-thirds, from about 25 percent to 12.7 percent. Growth in Bhutan
has been pro-poor in a substantive way –not only has the headcount poverty rate declined, but the poverty gap also declined across all the poverty bands. Prosperity has been widely shared among all income classes, with the bottom 40 percent
1 Based on a consumption poverty line of US$1.25 per capita per day in purchasing power parity terms.
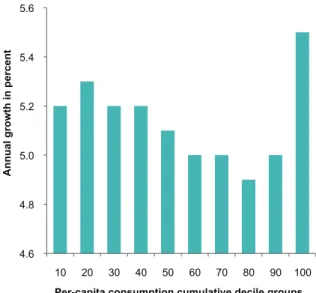
of the population enjoying faster growth than the rest, save for the top 10 percent (Figure 0.2).
Inequality remained stable, allowing the full effect of growth on poverty reduction.
Yet some have stayed poor and some non- poor fell into poverty. The rapid reduction in poverty bypassed nearly half of those found to be poor in 2007. Further, notwithstanding the cherished community support, families do fall through cracks: for every two families that managed to escape poverty, one previously non-poor family fell into poverty. Though
mobility of the poor in Bhutan is one of the better international examples, there is room for reducing vulnerability of the poor and near-poor.
The risk of falling back into poverty is greatest for Bhutanese in rural areas, those holding informal jobs, with low education, and resident especially in Pema Gatshel, Trashigang, or Dagana.
Food security improved in terms of access, but the poor still lag behind. On average,
FIguRE 0.1 Fast-Paced Poverty Reduction in Bhutan by any Measure, 2003-2012
0 10 20 30 40 50 60 70
2003 2007 2012
Percentage of Poor
PPP US$2.50 National Poverty Line PPP US$1.25 Source: Poverty Analysis Reports from National Statistics Bureau, Bhutan; PovcalNet: the online tool for poverty measurement developed by the Development Research Group of the World Bank:
http://iresearch.worldbank.org/PovcalNet/index.htm?0
FIguRE 0.2 Growth in Annual per-capita mean Consumption, by Cumulative Decile Groups
4.6 4.8 5.0 5.2 5.4 5.6
10 20 30 40 50 60 70 80 90 100
Annual growth in percent
Per-capita consumption cumulative decile groups Source: World Bank staff estimates based on Bhutan Living Standards Surveys 2007 and 2012, applying nominal poverty line as deflator.
Bhutanese increased dietary diversity by consuming from 10 food groups (out of 12) in 2012, from just seven groups in 2007. Protein sources, especially, have increased to include meat, fish, and pulses. However, the poor lag behind in access to diversified food groups, particularly protein sources. In addition, inadequate food is reported by 10 percent of poor households – more than double the non-poor’s four percent.
Female-headed households are not on par with male-headed households in enjoying fruits of growth. Thirty percent of Bhutanese households are headed by females.
While the poverty incidence (consumption or multidimensional poverty rate) is found to be equal for both male- and female-headed households, some female groups (notably married and divorced) have a greater incidence of poverty than the corresponding male groups; the bottom 40 percent of female-headed households enjoyed a smaller rise in consumption compared to that of their male-headed counterparts. The persistence of the livelihood handicap for female-headed households, despite matrilineal inheritance and a non-discriminatory labour market, suggests that disproportionate household burdens may be diminishing opportunities for women.
Opportunities for children are equalizing regardless of birth circumstances but inequities in completion of secondary education persist.
Bhutanese children have better and improving opportunities in education and infrastructure services than those of other South Asian countries, and these opportunities are becoming more equal across income classes. The public policy of extending coverage for all and targeting interventions with electricity and gas provision have narrowed inequalities among children.
Nevertheless, it is important to note that inequity in completion of secondary education remains an issue–the inequality-adjusted completion rate was only 32 percent in 2012, with an adjusted
attendance of 84 percent. Higher completion rates alone would help to build comparative advantage for Bhutanese youth in skilled labour.
The main drivers of prosperity in rural Bhutan appear to be increasing commercialization of agriculture, an expanding rural road network, and beneficial spillovers from hydroelectric projects. Helped by the recently renewed free trade agreements with India and preferential market access to Bangladesh, Bhutanese agricultural exports of commercial crops (notably oranges, cardamom, potatoes, and apples) have increased sharply (Figure 0.3). Increasing trade has been pro-poor. The eight-fold expansion in farm roads and progressive construction of highways linking with the Southern East-West highway, that runs along the Indian border, and new north-south links have all helped to create construction jobs and lowered the travel time and costs for goods and people. The four hydroelectric projects that began construction in the last five years (adding 3 GW to the current 1.6 GW generation capacity) are spreading good spillovers by expansion in roads, jobs, and business in the project areas.
Individuals in lower economic deciles have reaped better rewards for their education and land.
Land gift under the Royal kidu program has also
FIguRE 0.3 Rising Agricultural Exports from Bhutan
0.0 1.0 2.0 3.0 4.0 5.0 6.0 7.0 8.0 9.0
0 200 400 600 800 1,000 1,200 1,400 1,600 1,800
2007 2008 2009 2010 2011 2012
Percent
Million Nu
Share of non-energy exports Agricultural exports
source: Data from Annual Report 2012/13 of the Royal Monetary Authority of Bhutan
helped the previously landless to escape poverty.
Education appears to be the most important route by far to escape poverty.
The current pace of poverty reduction appears sustainable in the medium term.
Trade intensification with neighbors is set to continue, road infrastructure is posed for more expansion, and more hydroelectric project construction is planned to continue to 2020; the current free trade agreement with India, due for renewal in 2016, is most likely to be renewed.
The bilateral agreement with Bangladesh, that has benefited Bhutan by preferential duty-free access to 74 mostly agricultural exports, is also due for renewal, in 2018. In addition bilateral agreements with Thailand and Nepal are also on the anvil. Bhutan is a net exporter of fruits and cardamom in the north-east region of the Indian sub-continent and should be able to sustain fruit exports to Bangladesh even with future preference erosion under the South Asian Free Trade Agreement (SAFTA). Growth dynamism in India and Bangladesh should be able to further accommodate expansion of differentiated agricultural exports from Bhutan which are well known for superior quality. Completion of the Southern East-West highway in Bhutan and expansion of the rural roads network would help to draw out the comparative advantages of Bhutanese agriculture. The hydroelectric projects now under construction are expected to continue to 2016/17, and more projects are planned that would continue to boost rural incomes indirectly.
Despite rapid urbanization – one percent of rural population moving every year to urban areas – urban poverty has remained under two percent, indicating that migration is not biased particularly to the poorer sections of the society.
For sustained poverty reduction, risks and vulnerabilities need to be managed carefully.
With limited land, increasing fragmentation of land holdings, and rural-to-urban migration of
working age adults, labour-intensive horticulture will become increasingly difficult. Contract farming by large-scale land owners may be a way to sustain exports but benefits to poorer farmers might diminish. The current problems faced by farmers such as the incurable “greening disease”
of oranges, diseases of the cardamom plants and regular raids into farms by elephants (in low land), monkeys, and wild boars have persisted. The plan for introducing disease-resistant cultivars is not proceeding swiftly. It takes years to bring horticultural crops to harvest and equally long to shift to other profitable forms of production.
As a consequence of increasing commercial crop production, Bhutan dependence on food imports has been rising over the years, making it more vulnerable to food price shocks. A 12 percent increase in food prices – the average annual increase in recent years - for example, can increase the percentage of poor in the short-term by about two percent points. With all petroleum products imported, Bhutan’s poor also face risk from fuel price shocks. A sharp rise in the consumer prices of LPG and kerosene of the order that occurred in July 2013 (quickly reversed, however) had the potential to push 0.5 percent of population into poverty. Bhutan’s social protection is mainly through the Royal Kidu welfare program. Risks of downward mobility are greater than average for rural residents, male-headed households, people in informal jobs (the casually and self-employed), and those with low education and particularly high for those living in select dzongkhags such as Pema Gatshel, Dagana, Samtse, Trashigang, and Tsirang).
Formal social protection programs may be necessary to help individuals cope with adverse economic and financial shocks. At present, individuals cope with shocks mostly by drawing on own savings if they are non-poor, or by borrowing from friends, suppliers, and money-lenders if they are poor. Because of the
inadequacy and inelasticity of these sources for the poor and vulnerable segments of the population, we suggest the introduction of formal social protection mechanisms and possibly well- targeted micro-credit programs.
In the long-term, sustainable poverty reduction depends on addressing persistent shocks, engendering private sector led development and defining clear target groups for poverty reduction. The feasibility of crop insurance for farmers may be examined to protect the harvests from perils of diseases. Other perils, such as those associated with wild-life predation, have also persisted and evaded viable solutions.
What poor people want to better their living standards in the long term can be summed up as access to roads, electricity, public transportation, irrigation, land and higher education. Sustained poverty reduction depends on job opportunities and wage earnings of the poor. The development paradigm for a renewable resource rich country like Bhutan would call for engendering private sector led growth actively enabled by the public sector. Successful agribusiness – an emerging sector in Bhutan - will require development of value chain system (from farm to market) that will identify and remove the bottlenecks that farmers encounter including constraints related to finance and availability of crop insurance. The government could engender private investment in
hydropower sector by Private Public Partnerships and subcontracting in order to create jobs.
The Royal Government of Bhutan seems to favor complementary use of consumption and multidimensional poverty. But the overlap of the two approaches identifying the poor is small.
Therefore defining a clear target group for poverty reduction is important. Also, with success in reducing extreme consumption poverty rapidly, the goal could be now shift to shared prosperity defined for example as the welfare of the bottom 40 percent of the population.
“In my opinion over the years
the community has benefitted
because we now have access
to road, electricity and mobile
services. Electricity has brought
many benefits – we do not have
to spend time fetching firewood
for cooking, household sanitation
has improved as we use electric
utensils to prepare meals. Mobile
connectivity has made our life easier
due to faster communication.” – An
FGD participant from Lhuentse
dzongkhag.
Introduction
Bhutan’s location provides opportunities and challenges. Land-locked in the eastern Himalayas, Bhutan is bordered by two Asian giants, China and India. Its population density, at 19 persons per sq. km, is the lowest in South Asia. Elevation ranges from 200 meters in the southern foothills to some peaks in the north that are around 7,000 meters above sea level. Bhutan’s picturesque topography consists of tall mountains, thick forests and tumultuous rivers. In keeping with its philosophy of sustainable development, Bhutan’s constitution requires that 60 percent of its land area be covered by forests (around 72 percent of the land was under forest cover in 2011).
Renewable fresh water availability, at 106,933 cubic meters per capita, is the third-highest in the world. Challenges include difficult terrain (tall mountains with sheer drops) that makes connecting remote areas difficult and expensive, and a small and dispersed population that limits economies of scale. Moreover, Bhutan is located on the Indian and Eurasian tectonic plates, whose movements and collisions cause frequent earthquakes in the area. It also experiences other disasters such as landslides, forest fires, and glacial lake outburst floods.
Bhutan has enjoyed continued political stability, strong institutions and good
governance. The country transitioned from an absolute monarchy to a constitutional monarchy with a multi-party democracy in 2008. The second democratic process has evolved, with multiple political parties participating in the July 2013 parliamentary elections for the lower house. Its Country Policy and Institutional Assessment (CPIA) rates fairly well and so do international measures of governance and corruption. With regard to corruption perception, Bhutan ranks 31st among 177 countries and scores better than Israel, Spain, and Poland. Domestic perception of corruption is on the decline, as reflected in the increase of the Bhutan Comprehensive integrity score in recent years.
Bhutan is on its way towards Middle Income Country (MIC) status, has a unique poverty reduction record in international context. Its GDP per capita is already US$ 2,584 in 2012 and it is poised for eight percent growth over the coming five years. It has done well on poverty alleviation and providing service to citizens.
Bhutan has made stellar progress in meeting MDGs and extending gains beyond GDP growth.
Of the eight MDGs, seven are actionable to national policies. Among these seven, Bhutan has already achieved or over-achieved four goals in halving extreme poverty, reaching gender
1 Chapter
parity in education, ensuring environmental sustainability, and reducing by three-fourths maternal mortality. Notably, in many of these, Bhutan’s initial conditions were worse than its neighbors’ but had surpassed the neighbors’
by 2011. For instance, maternal mortality in 1990 was at 1,000 per 100,000 – much worse than India’s 600, but by 2011 it had fallen to 180 while India’s was still around 200. In the remaining three goals –universal primary enrollment, halting and reversing the spread of communicable diseases, and reducing by one- third infant and under-5 mortality – Bhutan is on track. Some areas still requiring attention under the MDGs are gender parity in tertiary education, detection of HIV cases, and youth unemployment. Significant progress has been made towards gender equality: in education, female enrollment in primary schools stood at 88 percent in 2008 compared to one girl enrolled for every 50 boys in 1970; maternal mortality has dropped dramatically (as noted above, to 180 from 1,000 in 1990), and women are almost at parity in the labour force.
The Royal Government of Bhutan (RGoB) has made the pursuit of national happiness the overarching goal of its development strategy.
In that context, it is committed to improving the quality of life for the citizens through inclusive and sustainable economic growth, the conservation of the natural environment, the preservation of the country’s cultural heritage and good governance. These focal areas constitute the four pillars spanning the concept of Gross National Happiness (GNH), and are being implemented through a series of five year plans.
The vision underlying this strategic framework has been enshrined in the 2008 Constitution,2 adopted at the beginning of the 10th Five Year Plan (2008-2013).
2 This Constitution marks a transition in the system of government from absolute monarchy to a parliamentary democracy.
Recognizing the fact that political democracy and economic empowerment do reinforce each other, the government has made poverty reduction the central theme and main objective of the 10th Five Year Plan. It intends to pursue this objective through industrial development, national spatial planning, and integrated rural- urban development, a strategic expansion of infrastructure, human capital development, and enhancing the enabling environment. The formulation of the 10th Five Year Plan builds on the strong achievements of the Ninth Plan (2002-2007) which sought to improve the quality of life and income, with a special focus on the poor, by promoting good governance and private sector-driven economic growth in addition to preserving cultural heritage and the natural environment.
The purpose of this report is to provide an account of the poverty outcomes observed under the 10th Five Year Plan. This account is based on data from the 2007 and 2012 rounds of the Bhutan Living Standards Survey (BLSS). Other quantitative data came from Labour Force Surveys and Renewable Natural Resource (RNR) statistics.
This is supplemented by qualitative report from a series of focus group discussions (FGD) held for the study in four dzongkhags of Bhutan. Given the period of this plan, the 2007 data provide a valid baseline for an assessment of the poverty outcomes of this plan. Similarly, the 2012 data are considered end-line observations reflecting the outcome of the implementation of the 10th Five Year Plan since the plan ends in 2013.
This report builds on Bhutan Poverty Analysis, 2012–earlier collaborative work between the NSB and the World Bank. While the previous report presented new estimates of consumption-based poverty and characteristics of the poor in 2012, the current report offers a more detailed analysis of the evolution of poverty, its distributional characteristics including inequality, mobility
estimates (Chapter 2), changing profiles of the poor and bottom 40 percent of the population (Chapter 3), issues in expanding opportunities for children – Human Opportunity Indices (Chapter 4), identifies key drivers of poverty reduction in Bhutan (Chapter 5) and examines what are the vulnerabilities and steps to be taken for sustained poverty reduction in Bhutan (Chapter 6).
Evolution of Poverty, Shared Prosperity and Inequality in Bhutan
2.1. Consumption Poverty, multidimen- sional Poverty and happiness
Ending extreme poverty in a generation is within reach for Bhutan. By any poverty measure – be it the National Poverty Line or the PPP US$1.25 or US$2.50 –Bhutan has achieved rapid reduction in poverty in the last decade (Figure 2.1). By measure of the international norm of US$1.25 per day for extreme poverty, Bhutan had almost eliminated poverty to under two percent by 2012. That
amounts to ending extreme poverty in 22 years, or within the living memory of a generation. In just over five years, 2007-2012, poverty in Bhutan was cut by half, according to the National Poverty Line, a more generous measure than the US$1.25 per day line. Judging by comparable surveys and methodology, the percentage of poor was cut from 23 percent in 2007 to 12 percent in 2012. If more distributionally sensitive measures are used (poverty gap, poverty severity), the reduction is even greater.
Happiness is more than consumption:
Bhutan’s unique Gross National Happiness measure. The term “gross national happiness”
(GNH) was first formulated in 1972 to sig- nal the country’s commitment to building an economy that would serve Bhutan’s unique cul- ture based on Buddhist spiritual values. The Centre for Bhutan Studies developed a sophis- ticated survey instrument to measure GNH.
Four pillars support the concept: Fair socio- economic development (better education and health), conservation and promotion of a vibrant culture, environmental protection, and good gov- ernance. These four pillars are further elaborated in nine equally important domains: psychologi- cal well-being, living standard, health, culture, education, community vitality, good governance,
2 Chapter
FIguRE 2.1 Fast-Paced Poverty Reduction in Bhutan by any Measure, 2003-2012
0 10 20 30 40 50 60 70
2003 2007 2012
Percent of Poor
PPP US$2.50 National Poverty Line PPP US$1.25 source: Poverty Analysis Reports from National Statistics Bureau, Bhutan; PovcalNet: the online tool for poverty measurement developed by the Development Research Group of the World Bank:
http://iresearch.worldbank.org/PovcalNet/index.htm?0
balanced time use, and ecological integration. In accordance with these nine domains, Bhutan has developed 33 clusters and 124 variables that are used to define and analyze the happiness of the Bhutanese people. The GNH concept serves as a unifying vision for Bhutan’s five year planning process and all the derived planning documents that guide the economic and development plans of the country. Proposed policies in Bhutan must pass a GNH review based on a GNH impact as- sessment.
Bhutan has made stellar progress in meeting the MDGs and extending gains beyond GDP growth. Of the eight MDGs, seven are actionable to national policies. Of these seven, Bhutan has already achieved or over-achieved four goals: halving extreme poverty, reaching gender parity in education, ensuring environmental sustainability, and reducing maternal mortality by three-fourths. Notably, in many of these factors Bhutan’s initial conditions were worse
than its neighbors, but it had surpassed those neighbors by 2011. For instance, maternal mortality in 1990 was, at 1,000 per 100,000, much worse than India’s 600, but by 2011 it fallen to 180 while India’s was still around 200.
For the remaining three goals –universal primary enrollment, halting and reversing the spread of communicable diseases, and reducing by one- third infant and under-5 mortality – Bhutan is on track. Some areas requiring attention under the MDGs are gender parity in tertiary education, detection of HIV cases, and youth unemployment.
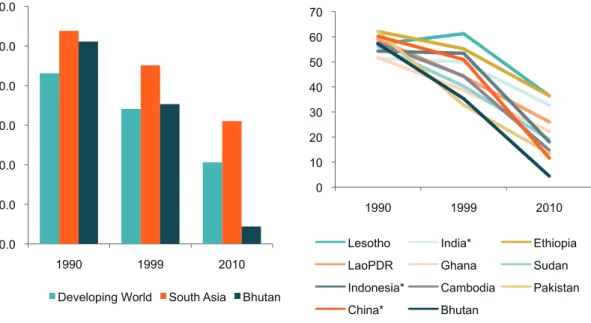
Bhutan’s poverty reduction record is unique. Using the internationally comparable US$1.25 per day poverty line, Bhutan stands out for the pace of its poverty reduction compared to other South Asian countries and the select cohort of countries with similar initial poverty levels in 1990. Starting from about the same level as that of the South Asia region in
FIguRE 2.2 Bhutan Outpaces South Asia Region in Poverty Reduction
FIguRE 2.3 Bhutan Poverty Reduction Leads Countries with Similar 1990 Poverty Levels
0.0 10.0 20.0 30.0 40.0 50.0 60.0
1990 1999 2010
Developing World South Asia Bhutan 0 10 20 30 40 50 60 70
1990 1999 2010
Lesotho India* Ethiopia
LaoPDR Ghana Sudan
Indonesia* Cambodia Pakistan China* Bhutan
source: PovcalNet: the online tool for poverty measurement developed by the Development Research Group of the World Bank: http://
iresearch.worldbank.org/PovcalNet/index.htm?0
Note: In Figure 2.3, asterisks indicate estimates aggregated from rural and urban data.
1990,and with more than half of its population in poverty, Bhutan had managed to reduce the percentage of poor to a mere four percent by 2010,while the whole of South Asia’s poverty level had fallen to 30 percent (Figure 2.2).
Among those countries in the developing world that had poverty in the 50-60 percent range in 1990, Bhutan’s poverty reduction has been the steepest (Figure 2.3).
2.1.1. Decline in multidimensional poverty between 2007 and 2012
The 10th Five-Year Plan adopted by the Bhutanese government prioritizes poverty reduction in a multidimensional way. Given the limitations of consumption poverty measures in capturing overall deprivation, the government also estimates a more holistic measure called the multidimensional poverty index (MPI). The MPI, which is based on the concept of capability deprivation, uses the Alkire Foster methodology with three equally weighted dimensions – health, education, and standard of living – each of which is further split into two, two, and nine sub-indicators, respectively. A household that is deprived 4/13of the weighted indicators is MPI-poor.
In 2012, 12.7 percent of the country’s population was MPI-poor –not different from the 12 percent headcount ratio for consumption poverty but only 3.2 percent of the population was both consumption and MPI-poor at the same time. This huge mismatch between the two measures illustrates the importance of two measures. However, there was greater overlap in the standard of living (SL) one-seventh of the weight of this dimension is assigned to each of six indicators: electricity, sanitation, water, housing material, cooking fuel and road access, and the remaining one-seventh of the weight is equally distributed among assets, land ownership and
livestock ownership). None of the households were observed to be deprived in all SL indicators, but nearly 70 percent were deprived in at least one, and more than 32 percent were deprived in at least half of all the indicators. Fifty percent of all the consumption-poor were observed to be deprived in at least half of the SL indicators.
The highest headcount ratio (36 percent) was observed in the use of solid cooking fuel, followed by no access to improved sanitation facilities (29 percent). Over 10 percent of the population was MPI-poor and used dung, wood, or charcoal for cooking.
Education deprivation was the highest in all three dimensions, with 2.5 percent of the population deprived in both forms of the education indicators (schooling of household members and child attendance), and 27 percent deprived in at least one. Further, 7 percent of the consumption-poor were deprived in both education indicators, while 37 percent was deprived in at least one. Among the income- poor households, nearly 30 percent had no adult with at least five years of education, and 15 percent had school-aged children not attending school.
By comparison, less than one percent of the total population was deprived in both health indicators (food security and child mortality) and 15 percent was deprived in at least one.
These deprivations were deepest among the income-poor, where 23 percent of the population
“We see almost 50 percent development in the recent years.
There is change in life. Before we had
to walk for 10 days with our horses
to bring essentials, sleep in the cave,
walk barefoot.”
was deprived in at least one indicator. Further, a higher incidence of child mortality was observed among income-poor households (at 15% of the population) compared to food shortage (9%).
While none of the consumption-poor households were deprived in all health and education indicators, nearly 8 percent of them (i.e., 0.9% of the total population) were deprived in at least one health and one education indicator.
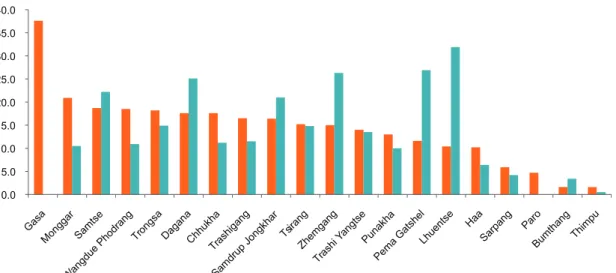
The differences between MPI and consumption-poverty estimates were ampli- fied at the dzongkhag level, particularly in Gasa (Figure 2.4). For instance, Gasa had the highest MPI headcount ratio (37.6%) but the lowest con- sumption poverty ratio (0%), while Lhuentse had the highest consumption headcount ratio (32%) with a low MPI headcount (10%). Within the SL dimension, over 60 percent of Gasa’s population was deprived in at least half of the indicators, compared to Pema Gatshel, where less than 46 percent of the population was deprived in at least half of the SL indicators, but it had the second-highest headcount of consumption poor, at 27 percent. Education and health deprivation
was also poorly related to consumption-poverty.
Dzongkhags such as Wangdue Phodrang and Haa, which had the highest education poverty headcounts (based on deprivation in both indi-
FIguRE 2.4 Multidimensional Poverty and Consumption Poverty Compared, 2012
0.0 5.0 10.0 15.0 20.0 25.0 30.0 35.0 40.0
GasaMonggarSamtse
Wangdue Phodrang
Trongsa Dagana Chhukha Trashigan g
Samdrup
Jongkhar Tsirang Zhemgang
Trashi
YangtsePunakha Pema Gatshel
Lhuentse Haa
Sarpang Paro
Bumthang Thimpu Multidimensional poverty Consumption poverty
source: Bhutan Multidimensional Poverty Index 2012, NSB
FIguRE 2.5 Trends in Multidimensional and Consumption Poverty Headcount Ratios
0 5 10 15 20 25 30 35
2007 2012
Percent
% MPI poor % Consumption poor source: Bhutan Multidimensional Poverty Index 2012, NSB
Note: The MPI constructed for the comparison is not the same as that used for the national MPI because of indicator availability in BLSS 2007.
cators), were also among the ten richest in terms of consumption poverty. Similarly, Zhemgang and Pema Gatshel had the lowest health dep- rivation headcounts, but featured among the highest income-poverty headcounts. Further, in Haa and Trashi Yangtse, there were signifi- cant differences in their relative performance on education and health deprivations, highlighting greater inconsistencies across different meas- ures of deprivation.
Time-trend mapping of multidimensional poverty conforms with the decline in consumption poverty. Using comparable sets of indicators, the trend decline in MPI and the headcount of MPI-poor show similar reduction to that of the consumption poverty headcount using the same cutoff value as national MPI – deprivation in one-third of the indicators, although the decline in the MPI-poor headcount ratio is steeper (Figure 2.5).
2.1.2. shared Prosperity
Bhutan’s poorer half enjoyed greater prosperity than the rest, save for the richest decile. In the most recent five-year period, 2007-12, Bhutan as a whole enjoyed an annual per-capita consumption growth of about 5.5 percent in real terms. The bottom 40 percent – the definition used by the World Bank for measuring shared prosperity – of Bhutanese raised their consumption by five percent per year. Aside from the richest decile, therefore, growth has favored the lower classes in Bhutan (Figure 2.6).
2.1.3. mobility in and out of Poverty be- tween 2007 and 2012
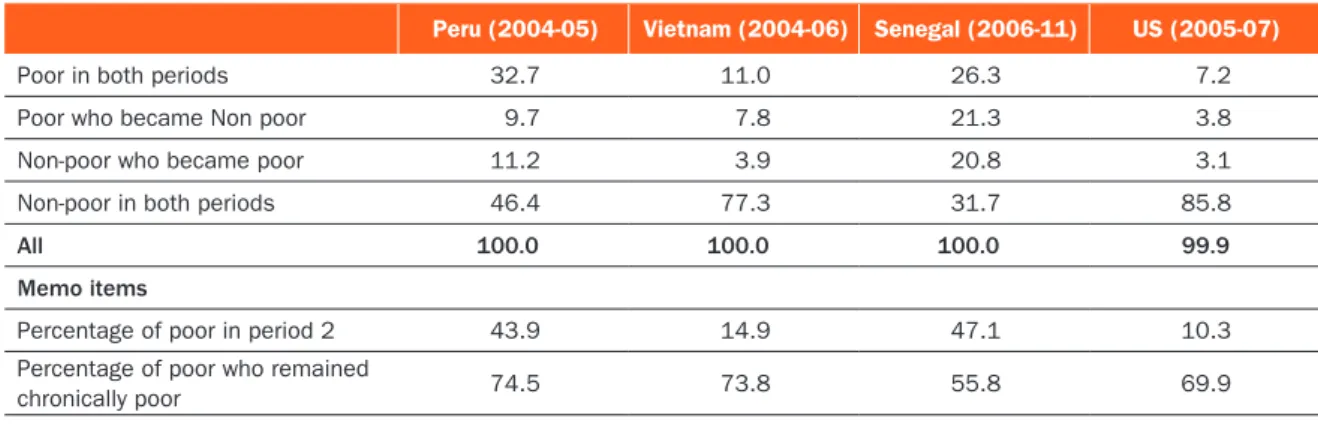
For every two families that escaped poverty, one fell into poverty. Two-thirds of the poor in 2012 were also poor in 2007.The usual poverty estimates based on cross-section data provide a snap-shot and do not inform how many of
the poor were chronically poor and how many moved in and out of poverty. Bhutan does not have panel data – same households surveyed over time. But a synthetic panel can be put together by looking at households with age of head of households restricted to between 25 and 55 for 2007 and increased by 5 years for 2012 for analysis of mobility of households over time3. Using synthetic panel approach, it is found that of the 12.4 percent poor in 2012 and 8.4 percent - two-thirds of all poor were poor also in 2007 (Table 2.1). While 10.5 percent of the population exited poverty between the two periods, 4 percent of the population dropped into poverty from non- poor status.
Mobility in Bhutan compares well with other countries, with twice as many of the
3 Hai-Anh Dang and Peter Lanjouw. 2013. “Measuring Poverty Dynamics with Synthetic Panels Based on Cross-Sections”, World Bank Policy Research Paper number 6504, June 2013. Estimation of point estimates using synthetic panel is a new approach, earlier research by the authors used bound-estimates.
FIguRE 2.6 Growth in Annual per-capita mean Consumption, by Cumulative Decile Groups
4.6 4.8 5.0 5.2 5.4 5.6
10 20 30 40 50 60 70 80 90 100
Annual growth in percent
Per-capita consumption cumulative decile groups source: World Bank staff estimates based on BLSS 2007 and 2012, applying nominal poverty line as deflator.
population escaping poverty as entering it.
Bhutan’s upward mobility during 2007-2012 is comparable to Vietnam’s during 2004-06 (Table 2.2). Mobility for the bottom 40 percent in Bhutan is diminished compared to the poor group. Three-fourths of the bottom 40 percent remained in poverty whereas almost the same proportion (10 percent) of population left the bottom 40 percent and rejoined it between 2007 and 2012.
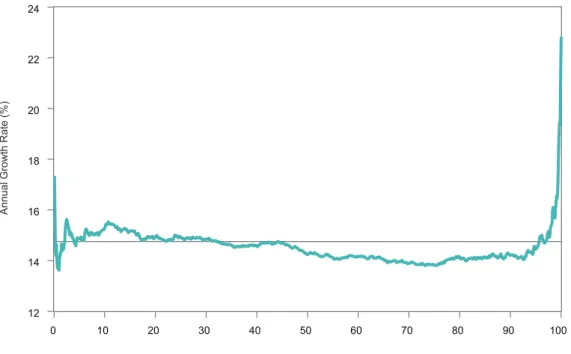
2.1.4. Growth in Bhutan has been Pro-Poor Poverty reduction in Bhutan has been pro-poor. The change in the distribution of per capita expenditure between 2007 and 2012 can also be characterized by the growth incidence curve (Figure 2.9). Recall that this curve shows the growth rate of an indicator of the living standard (e.g., income or expenditure) at each quantile of the size distribution of that indicator (Ravallion and Chen, 2003). The fact that the GIC depicted in Figure 2.9 is greater than zero for all expenditure percentiles means that the distribution of per-capita expenditure in 2012 dominates the distribution in 2007 to the first order. In other words, it means the posterior
distribution of per-capita expenditure lies nowhere above the initial one. This first-order stochastic dominance relation between the two distributions implies that all additively separable poverty measures satisfying monotonicity4 will agree that poverty has decreased between 2007 and 2012. Thus, distributional change observed in Bhutan between those two years is pro-poor in the sense of Ravallion and Chen (2003) and Kray (2006). For these authors, a distributional change is pro-poor if it involves poverty reduction for some choice of poverty index.5
Growth has been pro-poor in a substantive way. The poverty implications of the above dis- tributional change are presented in Figure 2.7 that summarizes the variation in poverty out- comes in Bhutan between 2007 and 2012 on the basis of TIP curves associated with poverty measures that bare members of the FGT (Foster- Greer-Thorbecke) family. The TIP curve6provides a graphical summary of incidence, intensity and inequality dimensions of aggregate poverty based on the distribution of poverty gaps nor- malized by the poverty line7 (Jenkins and Lambert, 1997). The curve is obtained by par- tially cumulating individual contributions to overall poverty from the poorest individual to the richest.8 The fact that the TIP curve for 2007 lies above the 2012 curve suggests economic growth in Bhutan has been pro-poor to the
4 Monotonicity requires that, other things being equal, an increase in the living standard of any person will reduce poverty (Foster, Greer, and Thorbecke, 2010).
5 The fact that the rate of growth at every percentile up to the 92nd is less than the average annual growth rate of per-capita expenditure means that economic growth in Bhutan has not been pro-poor if it is defined to exceed the average growth for the entire population.
6 TIP stands for “three ‘i’s of poverty”, that is incidence, intensity, and inequality.
7 The curve may also be based on absolute poverty gaps.
8 This curve is constructed in four steps: (i) rank individuals from poorest to richest; (ii) compute the relative poverty gap of each individual; (iii) form the cumulative sum of the relative poverty gaps divided by population size; and (iv) plot the resulting cumulative sum of poverty gaps as a function of the cumulative population share.
TABlE 2.1 Mobility In and Out of Poverty between 2007 and 2012
Poverty Status 2007
Poverty Status in 2012 (Percentage distribution of population)
Poor non-Poor all
Poor 8.3 10.5 18.8
non-Poor 4.1 77.2 81.3
all 12.4 87.7 100.0
source: Staff estimates based on analysis of synthetic panel data constructed using cross-section data of Bhutan Living Standards Surveys 2007 and 2012. “Does a rising tide lift all boats? An investigation of the nexus between poverty reduction and poverty mobility in Bhutan in the late 2000s”, Hai-Anh, Pete Lanjouw, and T.G. Srinivasan, forthcoming.
Note: The estimates here are from the synthetic panel, not reflecting the entire cross-section, and therefore they differ from poverty estimates of cross-section data used elsewhere.
second-order. Second-order pro-poor judgments are based on second-order stochastic dominance which is a necessary and sufficient condition for additively separable poverty measures satisfying the strong transfer axiom to agree on the pro- poorness of a distributional change (Atkinson, 1987; Ravallion, 1994). In particular, we find
that all members of the FGT family of poverty measures along with the Watts index agree that poverty in Bhutan fell significantly between 2007 and 2012.
TABlE 2.2 Mobility in Select Countries
Peru (2004-05) Vietnam (2004-06) Senegal (2006-11) uS (2005-07)
Poor in both periods 32.7 11.0 26.3 7.2
Poor who became Non poor 9.7 7.8 21.3 3.8
Non-poor who became poor 11.2 3.9 20.8 3.1
Non-poor in both periods 46.4 77.3 31.7 85.8
all 100.0 100.0 100.0 99.9
memo items
Percentage of poor in period 2 43.9 14.9 47.1 10.3
Percentage of poor who remained
chronically poor 74.5 73.8 55.8 69.9
source: World Bank Policy Research Paper WPS 6504 (2013) and a draft paper on Senegal by the same authors.
FIguRE 2.7 A Picture of Poverty in Bhutan, 2007-2012
2007
2012
0 0 1 2 3 4 5 6 7
10 20 30 40 50 60 70 80 90 100
Cumulative sum of poverty gaps
Cumulative population share source: Author’s calculations
2.2. stable Inequality
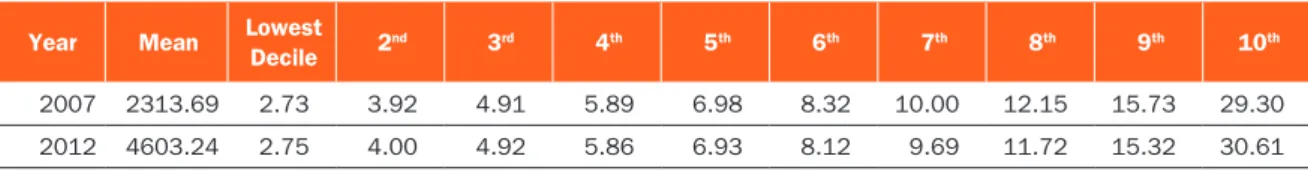
The growth process in Bhutan has been distribution-neutral. Table 2.3 is a summary of the distribution of per capita expenditure based on the 2007 and 2012 rounds of the BLSS.
The results are based on individual level data for both 2007 and 2012. The 2007 sample includes observations on 9,798 households; the 2012 dataset contains observations on 8,968 households. The summary information includes, for each round, mean per capita expenditure in real terms and the decile distribution of that per capita expenditure (see also Figure 2.8).
This information shows that real household per capita expenditure almost doubled in the span of five years. It also shows that the share of each decile below the richest has remained more or
less the same over time, while that of the richest increased a little bit. These results show that the growth process in Bhutan has been distribution neutral between 2007 and 2012 (Figure 2.9 shows national growth incidence).
The overall Gini coefficient for 2007 is estimated at 38.09 percent. In 2012 this measure of relative inequality stood at 38.75 percent.
Data show that inequality between groups has been quite stable9 (Table 2.4). This pattern of
9 These results are based on a simple decomposition approach applied by Benjamin, Brandt and Giles (2005) to the case of inequality in rural China. The approach entails estimating a regression of the log of the welfare indicator (income or expenditure per capita) on a set of location dummies. The resulting R-squared shows the proportion of the variation of the log of the welfare indicator that is accounted for by the location dummies. In other words, this is the amount of variation that is “explained” by differences in average level of living. The residual variance is linked to within-location inequality. In our application for Bhutan we use Dzongkhag dummies as location variables.
TABlE 2.3 Distribution of Real per capita Expenditure in Bhutan, 2007-2012 Year Mean lowest
Decile 2nd 3rd 4th 5th 6th 7th 8th 9th 10th
2007 2313.69 2.73 3.92 4.91 5.89 6.98 8.32 10.00 12.15 15.73 29.30
2012 4603.24 2.75 4.00 4.92 5.86 6.93 8.12 9.69 11.72 15.32 30.61
source: Author’s calculations
FIguRE 2.8 Change in Relative Inequality in Bhutan, 2007-2012
00 20 40 60 80 100
10 20 30 40 50 60 70 80 90 100 Expenditure Percentiles
Lorenz Curves Expenditure Shares (percent) by Decile
2007 2012
0 5 10 15 20 25 30 35
1 2 3 4 5 6 7 8 9 10
2007 2012
Expenditure Shares
source: Author’s calculations
distributional change suggests that, overall, the observed reduction in poverty was driven exclusively by the size effect.
Inequality between dzongkhags remained stable in Bhutan. These results are based on a simple decomposition approach applied by Benjamin, Brandt and Giles (2005) to the case of inequality in rural China. The approach entails estimating a regression of the log of the welfare indicator (income or expenditure per capita) on a
set of location dummies. The resulting R-squared shows the proportion of the variation of the log of the welfare indicator that is accounted for by the location dummies. In other words, this is the amount of variation that is “explained” by differences in average level of living. The residual variance is linked to within-location inequality.
In our application for Bhutan we use dzongkhag dummies as location variables.
2.2.1. uneven Poverty reduction across Dzongkhags
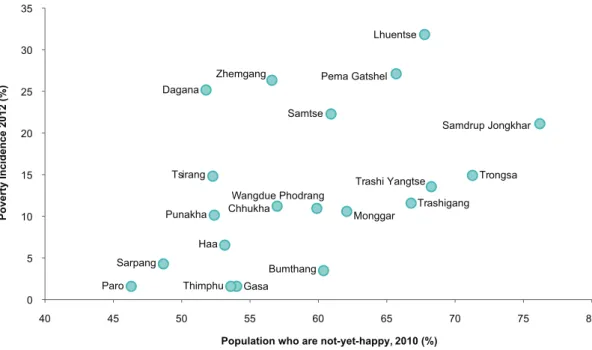
Incidences of unhappiness and poverty are higher in the eastern dzongkhags. The 2010 GNH survey estimates that 59 percent of Bhutanese are not-yet-happy; even in the least-poor Paro close to 47 percent are not-yet-happy. Using the national average for the percentage of poor in 2012 and not-yet-happy in 2010 as dividing lines (Figure 2.10), we note that unhappiness tends
TABlE 2.4 Between-Group (Dzongkhag) Inequality in Bhutan by Area of Residence
Year urban Rural Bhutan
2007 13.3 20.4 26.0
2012 14.5 22.4 25.0
source: Author’s calculations
Note: Between-group inequality is measured by the proportion of the variance of the log of per capita expenditure explained by dzongkhag of residence. This is the R2 of the regression of log per capita expenditure on a set of dummy variables representing the dzongkhag (see Benjamin and Brandt. 2005.“The Evolution of Income Inequality in Rural China.” Economic Development and Cultural Change).
FIguRE 2.9 Growth Incidence Curve for Bhutan, 2007-2012
12 14 16 18 20 22 24
0 10 20 30 40 50 60 70 80 90 100
Expenditure Percentiles
Annual Growth Rate (%)
source: Author’s calculations
FIguRE 2.11 Uneven Poverty Reduction across Dzongkhags, 2007-2012
Bumthang
Chhukha
Dagana
Haa
Lhuentse Monggar
Pema Gatshel
Punakha
Samdrup Jongkhar Samtse
Sarpang
Trashigang
Trashi Yangtse Trongsa
Tsirang Wangdue Phodrang
Zhemgang
0 10 20 30 40 50 60
Percent of poor in 2007
Percent of poor in 2012 Thimphu
source: Poverty Analysis Reports, 2007 and 2012
Note: Bubble size is proportional to the number of poor. For instance, Samtse is home to the largest number for a dzongkhag, 12,000, and Pema Gatshelhas 6,000.
FIguRE 2.10 Poverty and Unhappiness across Dzongkhags
Bumthang Chhukha Dagana
Gasa Haa
Lhuentse
Monggar
Paro
Pema Gatshel
Punakha
Samdrup Jongkhar Samtse
Sarpang
Thimphu
Trashigang Trashi Yangtse Trongsa Tsirang
Wangdue Phodrang Zhemgang
0 5 10 15 20 25 30 35
40 45 50 55 60 65 70 75 80
Poverty Incidence 2012 (%)
Population who are not-yet-happy, 2010 (%) source: Poverty Analysis Report 2012 and Gross National Happiness Report 2010
Note: Not-yet-happy are those who lack sufficiency in indicators identified in the GNH report.
to increase with poverty and the eastern part of the country is highly prone to unhappiness and poverty.
Poverty reduction across dzongkhags has been uneven. Of the 20 dzongkhags in Bhutan, poverty reduction touched all except two, Pema Gatshel and Tsirang (Figure 2.11). The pace of poverty reduction was slower in Dagana and Lhuentse, but much faster in initially-very-poor Monggar, Samtse and Zhemgang. Even among the poor eastern dzongkhags, Zhemgang has been more successful than Lhuentse in poverty reduction.
Changing Profiles of the Poor and Bottom 40 Percent of the
Population
This chapter presents the change in profiles of the poor and bottom 40 percent of the population between 2007 and 2012. The profiles are presented in terms of asset and amenities, health and nutrition, gender, and land ownership. This analysis complements discussion of the profile of the poor in Bhutan Poverty Analysis 2012.
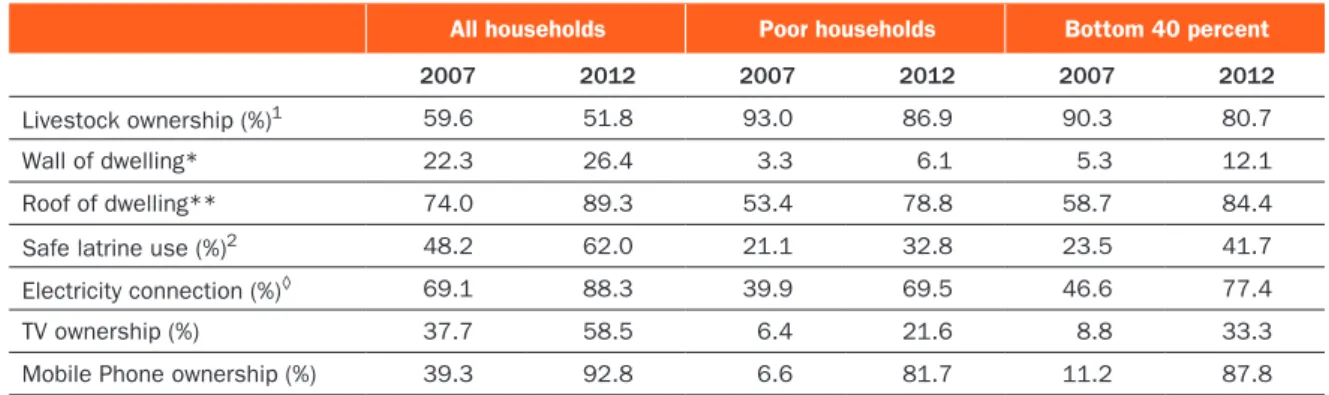
3.1. Welfare Indicators (assets and amenities)
All non-consumption indicators of welfare showed significant improvements between 2007 and 2012, both for the general population and the poor (Table 3.1). Basic asset and amenity indi- cators used in BLSS survey years 2007 and 2012 show that the biggest improvements occurred in mobile phone ownership, housing, and electricity connections. In particular, there have been signi- ficant increases in the percentages of households with metal sheet roofs, electricity connections, and access to mobile phones. There has been a significant increase in the poorest households’
access to mobile phones and electricity. Improve- ment in their housing conditions, specifically in roof quality, has been dramatic.
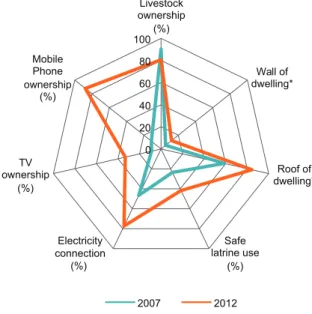
The improvements in households’ assets indicators are illustrated by the following three charts, in seven key dimensions of welfare – livestock ownership, type of dwelling wall, type of dwelling roof, safe latrine access, electricity access, television ownership, and access to mobile phone.
For all households (Figure 3.1), between 2007 and 2012 there were improvements in six dimensions of welfare, except for livestock ownership which showed a small decline. The same pattern held true for the poorest households and those in the bottom four deciles of the real per-capita consumption distribution (Figures 3.2, 3.3). Both of these categories experienced relatively large improvements in asset ownership in the same six dimensions of welfare between 2007 and 2012, reflecting the ongoing pattern of improvement in asset accumulation in the country at large. By far the largest improvement in both the poorest households and those in the bottom four deciles was in mobile phone ownership – from 11 percent