Climate and energy investment map in Germany
Status report 2016
Aleksandra Novikova Kateryna Stelmakh Alexander Klinge Irina Stamo
FEBRUARY 2019
PREPARED BY
Project in brief
The EU Member States must mobilise significant capital to achieve EU energy and climate targets for 2030. Many States have limited experience in mobilising private capital and must now build the knowledge and capacity to do so. The project ‘Climate investment capacity (CIC2030): climate finance dynamics & structure for financing the 2030 targets’ aims to address this challenge by supporting the development of prototypes to (a) track current climate and energy investment vol- umes and patterns in a given country; (b) analyse existing investment needs and gaps against energy and climate targets; and (c) develop plans to raise capital and close current funding gaps. This report addresses point (a) and the development of a climate and energy investment map (CEIM) for Ger- many as a frontrunner in the European energy transition. In parallel, the project focusses on point (b) and the preparation of a prototype for a German investment need and gap assessment (INGA). It will then transfer and adapt this knowledge to national circumstances in selected Member States, namely Czechia and Latvia. Using a learning-by-doing approach, the latter countries will prepare similar prototypes as well as additional plans to raise capital and close existing investment gaps.
Report abstract
This report aims to contribute to the discussion of EU Member States’ upcoming National Energy and Climate Plans (NECPs), in which Member States are required to present information on existing in- vestment flows to decarbonisation efforts. The report assesses existing data sources and climate-fi- nance tracking systems to estimate climate and energy investment in Germany in 2016. It presents a map illustrating the volume of climate and energy investment flows – from the financing sources, through the intermediaries and financial instruments, to the recipient sectors (i.e. agriculture, build- ings, energy, industry, and transport sectors). The map provides insight into who invests how much into what kind of measures. It is intended to serve as an example for Latvia and Czechia as they seek to replicate this exercise. The report also points to the status of available information and discusses the various methodological and data challenges encountered in the analysis.
Disclaimer
This project is part of the European Climate Initiative (EUKI – www.euki.de) of the German Federal Ministry for the Environment, Nature Conservation and Nuclear Safety (BMU). It is the overarching goal of the EUKI to foster climate cooperation within the European Union (EU) in order to mitigate greenhouse gas emissions. The opinions put forward in this report are the sole responsibility of the authors and do not necessarily reflect the views of the Federal Ministry for the Environment, Nature Conservation and Nuclear Safety (BMU).
Contacts
Simon Schäfer-Stradowsky, Aleksandra Novikova, Irina Stamo Institut für Klimaschutz, Energie und Mobilität (IKEM)
Magazinstr. 15–16 | D-10179 Berlin
simon.schaefer-stradowsky@ikem.de, aleksandra.novikova@ikem.de, irina.stamo@ikem.de
This report should be cited as follows:
Novikova, A., Stelmakh, K., Klinge, A., Stamo I. 2019 Climate and energy investment map of Germany.
Status Report 2016. Institute for Climate Protection, Energy and Mobility (IKEM): February 2019.
Acknowledgements
We would like to express our gratitude to the Federal Ministry for the Environment, Nature Conser- vation and Nuclear Safety (BMU) and the Federal Ministry of Economics and Technology (BMWi) for supporting our project. We are also grateful to Ms Caterina Salb and Ms Mareike Welke, of the BMU, and Mr Niels Anger, of BMWi, for providing useful information and feedback for project implementa- tion. In addition, we thank the EUKI officer, Ms Ulrike Leis, for her project management on behalf of the GIZ.
We are indebted to Ms Anja Rosenberg, who played a leading role in updating the methodology for tracking climate finance in Germany and provided invaluable support in collecting, analysing, and con- solidating data for the Climate and Energy Investment Map presented in this report.
We also thank our project partners, Ms Michaela Valentova, of the Czech Technical University in Pra- gue (CVUT), and Mr Agris Kamenders, of Riga Technical University (RTU), for discussing how to max- imise the benefits of climate and energy investment for other EU countries. We extend special thanks to Mr Ingmar Juergens and Mr David Rusnok for brainstorming, discussing, and reviewing this report.
We thank the following organisations and individuals for providing invaluable information and assis- tance in our research: Mr Thomas Bernheim, Mr Andreas Boschon, Mr Georgios Patris, Ms Annachiara Vercellin, and Ms Iris Imcke, of the European Commission; Mr Andreas Barkmann, of the European Environmental Agency (EEA); Mr Juergens Kern, Ms Marianne Strunz, and Ms Bettina Dorendorf, of Kreditanstalt für Wiederaufbau (KfW); Mr Eife Schmid, of the European Investment Bank (EIB); Mr Hans-Peter Klein and Ms Susanne von Horn, of Bundesamt für Wirtschaft und Ausfuhrkontrolle (BAFA); Mr Sven Remer, of Verein für Umweltmanagement und Nachhaltigkeit in Finanzinstituten e.V.
(VfU); Ms Angela McClellan, of Forum Nachhaltige Geldanlagen e.V. (FNG); Mr Dierk Francksen, of Rentenbank; and Mr Guerhan Gueloglu, of the Bundesamt für Güterverkehr.
We would also like to express our gratitude to Mr Padraig Oliver and Ms Chavi Meattle, of Climate Policy Initiative (CPI), for reviewing and providing feedback on our report; to Mr Ian Cochran and Mr Hadrian Hainaut, of the Institute for Climate Economics (I4CE); and to Ms Beate Hollweg, of the Ger- man Environmental Agency (UBA).
Finally, we are grateful to Ms Kate Miller, of the University of Greifswald, for editing and proofreading this report.
Acronyms
Acronyms in English Acronyms in German
BAFA Federal Office for Economic Af-
fairs and Export BAFA Bundesamt für Wirtschaft und Aus- fuhrkontrolle
BMU Federal Ministry for the Environ- ment, Nature Conservation and
Nuclear Safety BMU Bundesministerium für Umwelt, Na- turschutz und nukleare Sicherheit BMVI Federal Ministry of Transport and
Digital Infrastructure BMVI Bundesministerium für Verkehr und digitale Infrastruktur
BMWi Federal Ministry of Economics
and Technology BMWi Bundesministerium für Wirtschaft und Technologie
BMEL Federal Ministry of Food and Agri-
culture BMEL Bundesministerium für Ernährung
und Landwirtschaft BNetzA Federal Network Agency BNetzA Bundesnetzagentur CAP Common agricultural policy GAP Gemeinsame Agrarpolitik CEF Connecting Europe Facility (-E for
Energy and Infrastructure, and -T for Transport)
CEIM Climate and Energy Investment Map
CPI Climate Policy Initiative CO2 Carbon dioxide
EAFRD European Agricultural Fund for
Rural Development ELER Europäische Landwirtschaftsfonds für die Entwicklung des ländlichen Raums EAGF European Agricultural Guarantee
Fund EGFL Europäischen Garantiefonds für die
Landwirtschaft ECA European Court of Auditors
EEA Renewable Energy Agency EEA Erneuerbare Energien Agentur EEG Renewable Energy Sources Act Erneuerbare-Energien-Gesetz EEPR European Energy Programme for
Recovery
Europäisches Energieprogramm zur Konjunkturbelebung
Acronyms in English Acronyms in German
EIB European Investment Bank Europäische Investitionsbank ERDF European Regional Development
Fund EFRE Europäische Fonds für regionale Ent-
wicklung
FIT Feed-in tariff Einspeisevergütung
GAK
Joint Task for the Improvement of Agricultural Structures and
Coastal Protection GAK Gemeinschaftsaufgabe Agrarstruktur und Küstenschutz
GFCF Gross fixed capital formation GHG Greenhouse gas
IPCC Intergovernmental Panel for Cli- mate Change
KfW Credit Institution for Reconstruc-
tion KfW Kreditanstalt für Wiederaufbau
LFI Financial institution of a German
federal state [Land, plural Länder] LFI Landesförderinstitut
NKI National Climate Initiative NKI Nationale Klimaschutzinitiative NECP National energy and climate plan
PCI Projects of Common Interest R&D Research and development SME Small and medium-sized enter-
prises TEN
Trans-European Networks (-E for Energy and -T for Transport infra- structure)
UBA Federal Environment Agency UBA Umweltbundesamt
Contents
Executive summary 8
1. Introduction 12
1.1. Background and objective of this report 12
1.2. Why is the German case study so interesting? 12
1.3. Research output, questions, and structure 14
2. Methodology 15
2.1. Analytical framework 15
2.2. Scope and boundaries 18
2.3. Data sources used, data analysis, and limitations 23
3. Results 30
3.1. Sources of finance 32
3.2. Intermediaries 33
3.3. Financial instruments 37
3.4. Recipients 38
3.5. Comparison of 2010 with 2016 57
3.6. How to improve data and methodology for tracking climate financing in Germany 59
4. Conclusion 61
References 64
Annexes 83
Annex 1: Energy generation and infrastructure – assumptions 83
Annex 2: Industry sector – assumptions 87
Annex 3: Building sector – assumptions 88
Annex 4: Transport sector – assumptions 99
Annex 5: Agriculture sector – assumptions 102 Annex 6: Other sectors (waste and wastewater) – assumptions 104 Annex 7: Split of KfW programmes by investor and by financial instrument in 2016 105 Annex 8: Förder- und Landesbanken climate-related finance 106
Executive summary
Addressing climate change will require the redistribution of investment towards climate-friendly so- lutions as well as an overall increase in such investment. As one important element in addressing this challenge in the European Union (EU), the Regulation on the Energy Union Governance requires the EU Member States to create national energy and climate plans (NECPs). These must include details on current investment flows to the decarbonisation of Member State economies.
The present report aims to contribute to the discussion of current climate and energy invest- ment in Germany by evaluating recent data for 2016 and comparing it to a similar assessment con- ducted for 2010 (Juergens et al. 2010). The report is also intended to assess whether the methodolog- ical and data challenges encountered in such assessments have changed since 2010.
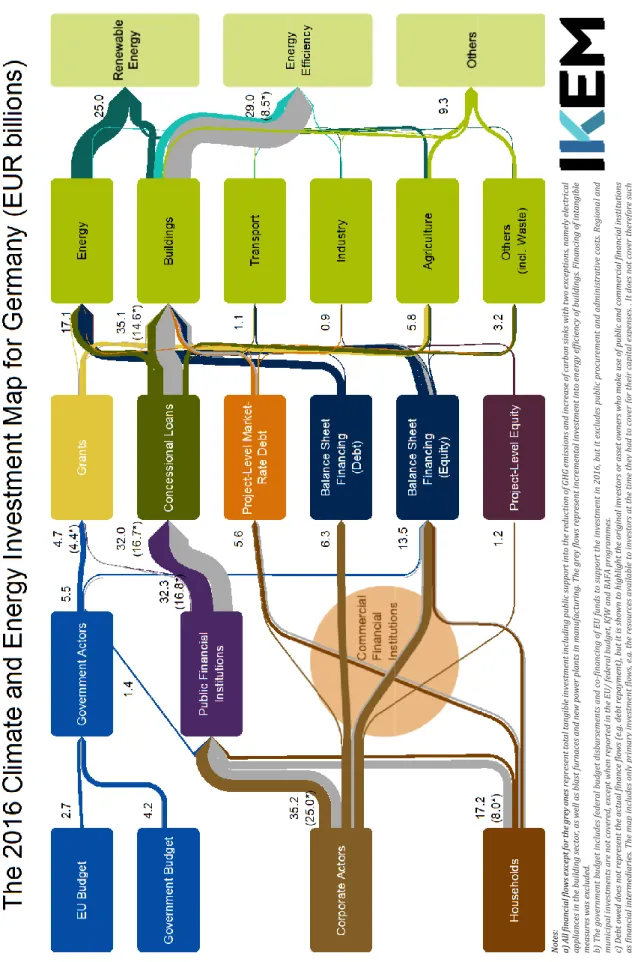
The principal output of this report is a climate and energy investment map (CEIM) for Germany for the year 2016. This map provides a snapshot of climate and energy investment flows, from the sources of capital, through the relevant intermediaries and financial instruments, to the recipient sec- tors.
The map was created using a bottom-up approach, tracking actual 2016 disbursements at a tech- nology level and aggregating them at sector and then country level. We considered only climate-spe- cific tangible investment (i.e. energy-efficient equipment, infrastructure, buildings, and renewable energy technologies targeting or resulting in greenhouse gas (GHG) emissions reductions and/or in- creases in carbon sinks). Soft measures (i.e. research and development, information campaigns, and policy development) play a key role in driving the energy transition and climate-change mitigation;
however, these were excluded from our analysis.
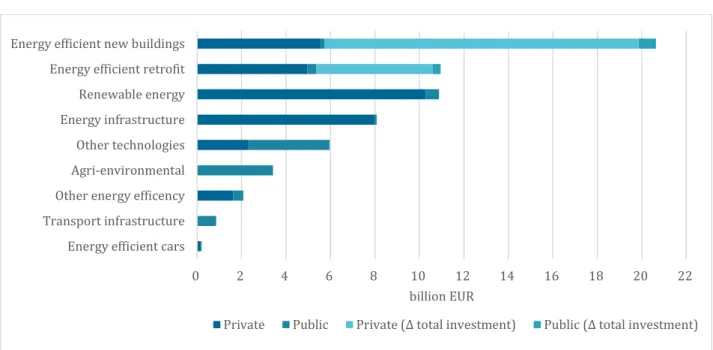
The map reflects both total capital investment and incremental investment. The incremental in- vestment represents the additional expenditure necessary to invest in a low-carbon technology rather than a business-as-usual practice. Total capital investment reflects the full cost of a technology or prac- tice.
Based on the climate-specific investment flows traced here, we observe a 16% increase in the vol- ume in 2016 (EUR 42.7 billion) relative to 2010 levels (EUR 36.7 billion). These volumes reflect the share of incremental investment in energy efficiency (EUR 8.5 billion), the total investment cost of renewable energy deployment (EUR 25.0 billion), and the total investment cost of non-energy-related mitigation and cross-cutting measures (EUR 9.3 billion). Relative to 2010 investment, the volume of flows to renewable energies decreased by 6%, while the volume of flows to energy efficiency increased by 18%.
We calculated total investment1 in energy efficiency (EUR 29.0 billion) for 2016, as well as the incre- mental share of investment cost reflected in the comparison above (EUR 8.5 billion). Total investment across all technologies (including energy efficiency, renewable energy, and non-energy-related miti- gation and cross-cutting measures) was EUR 63.2 billion in 2016. The report text provides an analysis of the total investment volume, except where stated otherwise.
The private sector accounted for 83% of total investment (EUR 52.3 billion); the remaining 17%
originated in the public sector (EUR 10.9 billion). Corporate actors remained by far the largest private investors (EUR 35.2 billion), followed by households (EUR 17.2). In the public sector, the German gov- ernment budget played the largest role (EUR 4.2 billion), followed by the EU budget (EUR 2.7 billion).
Germany is characterised by strong public promotional banks at federal level (e.g. KfW, Rentenbank, sixteen state-level promotional banks, and a large number of commercial banks). Our study indicates that public banks played a large role in providing means to finance climate-change mitigation measures and the energy transition. Altogether, they disbursed EUR 32.3 billion to support climate- specific investment. We were unable to evaluate the role of commercial banks due to the limited avail- ability of relevant data.
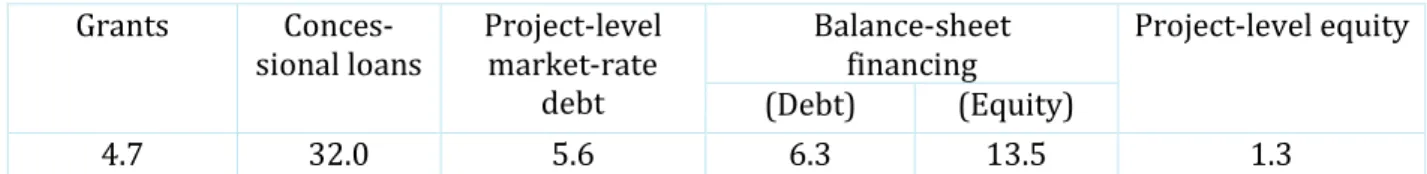
In 2016, both low-cost debt (EUR 32.0 billion) and grants (EUR 4.7 billion) offered by public actors played an important role in driving climate investment. Due to the lack of data, there is significant uncertainty around the EUR 26.6 billion delivered through other financial instruments, such as bal- ance-sheet financing, project-level equity, and market-rate debt.
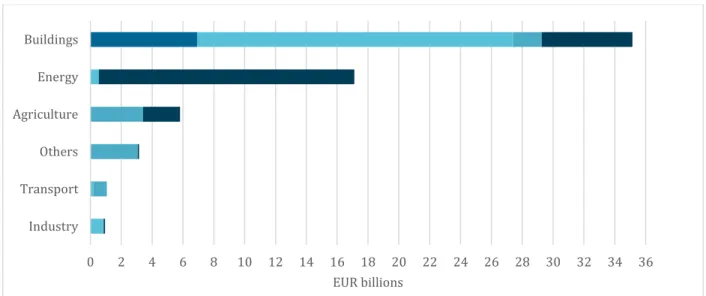
The sectors that attracted the largest share of investment were the buildings sector (total: EUR 35.1 billion, incremental: EUR 14.6 billion) and the energy generation and transmission sector (total: EUR 17.1 billion). These sectors are also those with the highest sector-specific targets for GHG emission reductions by 2030 (BMU 2016a), namely 66–67% for buildings and 61–62% for energy.
However, total investment volumes do not measure effectiveness in actual GHG reductions, and care should be taken in assessing such volumes in relation to GHG emissions-reduction targets. Other sec- tors that attracted less climate and energy investment include the agriculture (total: EUR 5.8 billion), transport (total: EUR 1.1 billion), and industry (total: EUR 945 million) sectors, as well as cross-cutting measures (total: EUR 3.2 billion).
1 Except for household electrical appliances in the buildings sector, blast furnaces, or newly built power plants used in manufacturing, for which the incremental cost was included in the total investment figure.
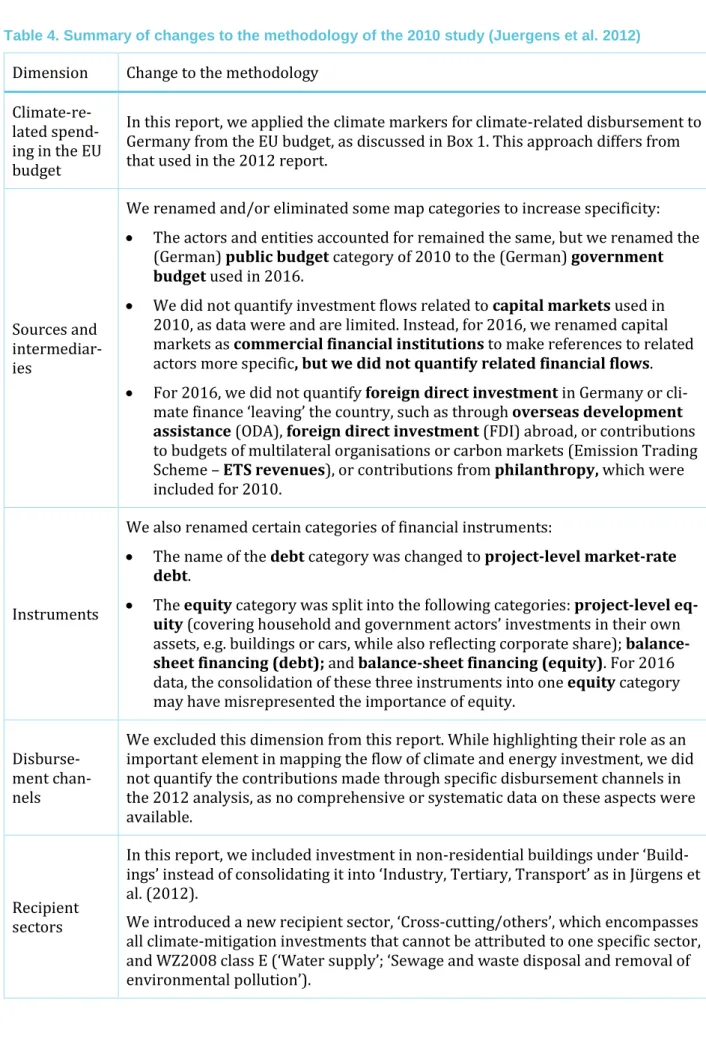
Notes: a) All financial flows except for the grey onesrepresent total tangible investment including public support into the reduction of GHG emissions and increase of carbon sinks with two exceptions, namely electrical appliances in the building sector, as well as blast furnaces and new power plants in manufacturing. The grey flows represent incremental investment into energy efficiency of buildings. Financing of intangible measures was excluded. b) The government budget includes federal budget disbursements and co-financing of EU funds to support the investment in 2016, but it excludes public procurement and administrative costs. Regional and municipal investments are not covered, except when reported in the EU/ federal budget, KfW and BAFA programmes. c) Debt owed does not represent the actual finance flows (e.g. debt repayment), but it is shown to highlight the original investors or asset owners who make use of public and commercial financial institutions as financial intermediaries. The map includes only primary investment flows, e.g. the resources available to investors at the time they had to cover for their capital expenses. . It does not cover therefore such financial instruments as guarantees, green bonds, the cost of capital or debt repayment by investors, the compensation payments from the public budget to energy generators supplying renewable electricity under the feed-in tariff, and others. The following differences between 2010 and 2016 reports affect the finance volumes: a) In this report, we account for total and incremental cost of energy efficiency investment into the building sector. This allows to add up investment across sectors and to compare 2010 and 2016 figures. b) In 2016, investments in non-residential buildings are reflected under “Buildings” instead of consolidating it under “Industry, Tertiary, Transport” as in Jürgens et al. 2012. c) We acknowledge the application of the climate markers to track climate expenditure of the EU funds targeting the energy, transport and agricultural sectors in 2016, while Jürgens et al. 2012 applied the same definition of climate finance to all sources of finance and sectors. This change leads to an increase of estimated grant volume by EUR 2.3 billion in 2016. d) The instrument “Equity” used in 2010 is now split up into “Balance Sheet Financing (Debt)”, “Balance Sheet Financing (Equity)”, and “Project-level Equity”. e) We now account for investments into technologies and measures related to the waste sector, which adds another EUR 1.0 billion EUR to the total volume reflected in the 2016 CEIM for Germany.
Challenges associated with data availability and format make a comprehensive and unbiased overview of climate finance in Germany impossible. Future climate and energy investment assessment exer- cises would benefit from the introduction of systematic tracking procedures for domestic pub- lic climate finance that covers federal, regional, and local government budgets and climate pro- grammes implemented by public banks and agencies. Possible approaches to such procedures in- clude the introduction of climate tagging in public budgets and/or the establishment of annual evalu- ation procedures. In addition, investment assessments could be improved by evaluating and streamlining existing private-sector surveys and reporting efforts with the government’s cli- mate-investment tracking approaches.
There is also a need for further debate on what constitutes climate finance at the domestic level.
The discussion should address how and to what extent climate-related measures such as infra- structure projects should be accounted for. Similarly, practicable approaches to calculating in- cremental costs of climate investment, especially in the building sector, should be developed fur- ther to prevent over- or underestimating related investment. In establishing a comprehensive and consistent tracking approach for Germany, it will be useful to review the lessons learned from relevant legislation implemented elsewhere, such as in France, and from the application of climate markers by the EU Commission.
1. Introduction
1.1. Background and objective of this report
Global climate assessments (IPCC 2014; IPCC 2018) agree that there is an urgent need to change global patterns of energy production and consumption, land use, and lifestyle to limit warming to 1.5°C rel- ative to pre-industrial levels. Such assessments have also emphasised the importance of adapting to impacts from changes in climatic variability and global warming. These changes will require a redis- tribution of investments towards climate-friendly solutions, as well as an overall increase in such in- vestment. Even though the European Union (EU) is among the global leaders in energy transition, meeting the targets of the ‘Clean Energy for All Europeans’ package alone will require the mobilisation of EUR 11.2 trillion of largely private capital by 2030 (EC 2016a).
As one important element in addressing the investment challenge, the Regulation on the Energy Union Governance (EC 2016b) requires the EU Member States to design national energy and climate plans (NECPs) based on a common template. These must include analytical details on current investment flows to the decarbonisation of Member State economies.
The present report aims to contribute to the discussion of current climate and energy investment in Germany by assessing the most recent data available, i.e. for the year 2016. The first and last compre- hensive assessment of such investment in Germany was prepared by Climate Policy Initiative’s (CPI) Berlin office based on 2010 data (see the German Landscape of Climate Finance, Juergens et al. 2012).
The objective of the present report is to update available information, analyse data and draw conclu- sions, and then compare these with conclusions from 2010. The objective is also to provide an update on whether methodological and data challenges associated with such assessments for Germany have changed since 2010.
1.2. Why is the German case study so interesting?
In 2016, Germany, with roughly 82 million inhabitants, was ranked the 12th richest economy in the world in terms of GDP per capita (OECD 2018). Germany has won international recognition for its leadership in the energy transition, a role that dates back to the 1970s, when it introduced energy efficiency and energy-supply diversification policies. Germany set more ambitious policy goals in 2010 with the adoption of the Energy Concept and Energiewende law (BMWi and BMU 2010): it pledged to reduce its GHG emissions by 80–95% by 2050 relative to 1990 levels and to carry out a complete nuclear phaseout.
In 2013, three German political parties (the CDU, CSU, and SPD) came to a coalition agreement defining the country’s emissions pathway towards these targets. In 2016, the German cabinet adopted the Cli- mate Action Plan 2030 (BMU 2016a), which presents guiding principles, milestones, and measures for the whole economy. It sets intermediate country-wide and sector-specific targets for 2030, identified in Table 1.
Table 1. 2030 targets for sector and total GHG emissions reductions in Germany
Sector Target
Energy - 61 to - 62%
Buildings - 66 to - 67%
Transport - 40 to - 42%
Industry - 49 to - 51%
Agriculture - 31 to - 34%
Other - 87%
Total - 55 to - 56%
Data source: BMU 2016a.
Despite Germany’s leadership in the global energy transition, the targets pose a challenge for the coun- try. As the table illustrates, it must reduce its emissions by 55–56% by 2030 relative to 1990 levels.
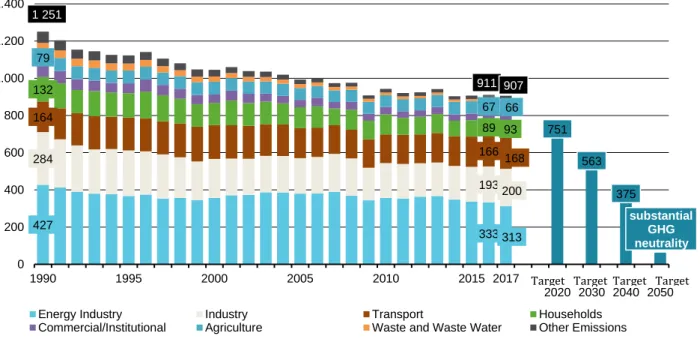
By 2017, Germany had achieved 27.7% of its emissions-reduction target; however, reductions were negligible between 2014 and 2017 (Figure 1). Primary energy demand followed a similar trend, de- clining from 2010–2014 but rising again in 2015 (BMWi 2018c). If Germany is to achieve its long-term decarbonisation targets, additional investment is needed.
Figure 1. GHG emission trends, excluding land use, land use change, and forestry
Source: UBA 2018a.
751 563
375
427 333 313
284
193200 164
166 168 132
89 93 79
67 66 1 251
911 907
0 200 400 600 800 1.000 1.200 1.400
1990 1995 2000 2005 2010 2015 2017 Ziel
2020 Ziel 2030
Ziel 2040
Ziel 2050
Energy Industry Industry Transport Households
Commercial/Institutional Agriculture Waste and Waste Water Other Emissions
substantial GHG neutrality Target TargetTarget Target Million tCO2-eq.
1.3. Research output, questions, and structure
The main output of this report is a climate and energy investment map (CEIM). The CEIM identifies the actors investing in climate-change mitigation and the energy transition in Germany in 2016, as well as the amount that they invested, the financial intermediaries and instruments that played key roles in this process, and the sectors and types of technological installations that absorbed these in- vestments. The map replicates the concept of the ‘Landscape of Domestic Climate Finance’ (see section 2.1). Where possible, our analysis compares current conditions for investment in climate and energy investment with those of 2010. In addition, we discuss the status of climate- and energy-investment tracking in the country.
Specific questions addressed in this report include:
• How much capital was invested in climate and energy transition measures in 2016?
• Who were the main investors?
• What financing instruments were the most common?
• Which sectors and type of technological installation were financed?
• Do the methodological and data challenges observed in 2010 continue to exist or have these been overcome?
This report consists of three chapters. Following this introduction, chapter 2 introduces the analytical and methodological framework for the CEIM; chapter 3 discusses selected results; and the conclusion summarises key findings of our assessment. Annexes provide details on the input data, assumptions, and references for the evaluation.
2. Methodology
2.1. Analytical framework
The principal output of this report is a climate and energy investment map (CEIM) for Germany. In this report, climate and energy investment is defined as spending by public and private actors for gross fixed capital formation (GFCF) that leads to a GHG emissions reduction in line with the German Climate Action Plan 2050 (BMU 2016a). According to EUROSTAT guidelines (ESA 2010), GFCF covers expend- itures to acquire physical assets, such as buildings and transport infrastructure. This report also tracks expenditures for durable goods acquired by households that are not covered by GFCF, e.g. individual vehicles. In addition, it assesses expenditures by public actors to support climate-friendly activities (e.g., climate-friendly land management).
The map represents climate and energy investment flows – from the sources of capital and the rele- vant intermediaries, through the instruments used, and ultimately to the recipient sectors. The con- struction of the diagram uses a bottom-up approach, tracking investment at a technology level and aggregating it at sector and then country level. The map identifies the type of actors who invest, the amount they invest, the sectors and types of technological installations that absorb these investments, and the intermediaries and financial instruments that facilitate these flows.
The approach to tracking climate finance flows was introduced in 2011 by CPI, which tracked these at global level using the Landscape of Climate Finance diagram (Buchner et al. 2011). As discussed in the introduction, CPI tracked climate finance flows in 2010 in Germany, developing the global approach into a framework suitable for analysing national-level data at a meaningful level of sectoral disaggre- gation (Juergens et al. 2012). Following Germany’s know-how, the Institute for Climate Economics (I4CE) adopted and further developed the approach to track climate investment for France on an an- nual basis, beginning in 2011 (Hainaut et al. 2018). The CEIM represented in this report mirrors the landscape method applied for Germany in 2012, updating these findings with the most recent data and analysing differences between these financial flows and 2010 volumes.
2.1.1. Sources of investment
The CEIM differentiates public and private sources of investment. Public sources include spending from the EU budget through EU funds, including the European Agricultural Fund for Rural Develop- ment (EAFRD), European Agricultural Guarantee Fund (EAGF), European Energy Programme for Re- covery (EEPR), European Regional Development Fund (ERDF), and Connecting Europe Facility (CEF).
Other public sources are national government budgets, including those at federal, regional, and local
levels. Spending by these entities takes two forms. It can be rendered as a direct investment in low- carbon public assets (e.g. investment in energy efficiency and renewable energy generation deployed in municipal buildings) or as public finances provided to private and public actors as a financial incen- tive to invest (e.g. grants to purchase electric cars).
Private sources of investment include households and corporate actors in agriculture and forestry, energy generation and infrastructure, mining and quarrying, manufacturing industries, water supply, etc. (For sector definitions, see section 2.1.4.).
The CEIM excludes German public expenditures for GHG mitigation executed in other countries and private foreign direct investments in Germany.
2.1.2. Intermediaries
Intermediaries enabling investment in climate mitigation are government actors, public financial institutions, and commercial financial institutions. Government actors are federal states, federal ministries, and government agencies, such as the Federal Office for Economic Affairs and Export Con- trol (BAFA). Public financial institutions include the European Investment Bank (EIB), Kreditanstalt für Wiederaufbau (KfW), Rentenbank, and financial institutions of federal states [Länder], or LFIs (see Annex 6 for a complete list). Commercial financial institutions represent different actors, such as com- mercial banks, pension funds, and investment funds. These play an important role in financing climate mitigation, but we did not quantify flows supported by them.
2.1.3. Financial instruments
This report covers a wide range of financial instruments that support investment in climate mitigation, namely grants, concessional loans, project-level market-rate debt, balance-sheet financing (debt), balance-sheet financing (equity), and project-level equity.
In keeping with the methodology used in the Landscape of Climate Finance in Germany 2010 (Juergens et al. 2012), we tracked only primary investment flows, e.g. the resources available to investors at the time when they had to cover their capital expenses or resources that they could reliably call in to cover their expenses immediately after the expenses were incurred (I4CE 2019). For this reason, we ex- cluded risk-management instruments, such as guarantees, the cost of capital or debt repayments, re- payment grants, feed-in tariffs, or green bonds issued in Germany, although these can play an im- portant role in enabling investment in climate mitigation. Accounting for these flows would lead to an overestimation of climate and energy investments and may result in double-counting. For the defini- tion of financial instrument mentioned, see the recent version of CPI’s Global Landscape of Climate Finance (Buchner et al. 2017).
2.1.4. Recipients
In the CEIM, we associate specific climate-mitigation technologies with each of six sector recipients, including energy generation and infrastructure, industry, buildings, transportation, and agriculture (including waste). The sectors were defined according to energy balances of Germany (AGEB 2017), the Federal Statistical Office classification WZ2008 scheme (Destatis 2007) and assumptions, as pre- sented in Table 2.
Table 2. Sector delineation
Sector Sector boundaries Energy generation
and infrastructure Covers technologies and practices implemented by WZ2008 classes D ‘Elec- tricity, gas, steam, and air conditioning supply’, but focusses primarily on D35.1 ‘Electric power generation, transmission, and distribution’. We account for the deployment of renewable energy technologies as well as infrastructure for the transmission and distribution of gas and electricity from renewables.
Industry Covers technologies and practices implemented by WZ2008-B (mining and quarrying) and WZ2008-C (manufacturing industry), including the deploy- ment of renewable energies, energy efficiency, activities that reduce emissions from industrial processes, and the use of solvents and other products such as pesticides, lubricants, waxes, and paraffins.
Buildings Covers technologies and practices implemented in and at buildings that belong to households, public, and commercial actors. The latter largely corresponds to classes WZ2008-F to WZ2008-S (Destatis 2007). Office buildings of the en- ergy, industry, and agriculture sectors are included here, while their barns and production facilities are not. We account for such investment as thermal effi- ciency improvement of building envelopes, installations of energy efficient building systems, installation of building-integrated renewable energy sys- tems in buildings, and energy-efficiency improvement of appliances and equipment.
Transport Covers investment in infrastructure such as bike tracks, modal shift (from road to rail), and low-emission modes of transport, such as electromobility and re- duced fuel consumption, e.g. by lowering rolling resistance or low-emission motors.
Agriculture in- cluding afforesta- tion
Covers technologies and practices implemented by WZ2008 class A (Agricul- ture, forestry and fishing), including all of agriculture, but excluding fisheries and forestry-related practices except afforestation.
Others incl. cross- cutting and waste
Covers technologies and practices that cannot be clearly attributed to any of the sectors above; this includes investment supported by KfW schemes not clearly associated with the above classifications. In addition, investments by WZ2008 class E (Water supply; Sewage and waste disposal and removal of environmental pollution) are reflected here.
In the CEIM diagram, investment in the sector recipients was further grouped according to three types of technological installations, namely renewable energy, energy efficiency, and others. Annexes 1–6
provide information on all investment flows identified by our assessment, with a detailed breakdown by sector and technology.
2.2. Scope and boundaries
2.2.1. Temporal scope
This report tracks climate and energy investment that were disbursed in 2016, not the investments that were planned or committed for that year. As of today, 2016 is the most recent year for which energy statistics, audited public budget expenditures, annual reports of financial institutions, and monitoring reports of public subsidy programmes are available.
2.2.2. Investment scope: specific versus related
This report relies on the differentiation between climate-specific and climate-related investment used in Juergens et al. (2012). For the purpose of this analysis, these categories are defined as follows:
• Climate-specific investment has energy transition and/or climate change mitigation as its pri- mary objectives, and it targets or results in GHG emission reduction and/or an increase in car- bon sinks.2 Examples are renewable energy investments to replace fossil fuels or energy-effi- ciency investments to reduce the use of fossil fuels.
• Climate-related investment does not have energy transition and/or climate-change mitigation as its primary objective or effect, but it targets activities that deliver co-benefits in terms of GHG emissions reduction and/or an increase in carbon sinks. One example is investment in organic farming, which can lead to an increase in soil carbon storage and a reduction in nitrous oxide (N2O) emissions.
For our report, we included climate-specific investment in full and climate-related investment in part, either by extracting the climate-specific components of a climate-related budget line or investment programme, or by applying a scoring strategy, such as the use of climate markers recommended as part of the common methodology for tracking and monitoring climate expenditure in 2014–2020 for the European Structural and Investment Funds (see Box 1 below).
2 The definition of climate-specific investment used in the literature (OECD 2016) and by the European Com- mission (EC 2014) includes investments targeting adaptation to climate change. While adaptation investment is outside the scope of the present report, the lack of differentiation (between mitigation and adaptation) in the EU’s tracking approach has also been criticised by the ECA (European Court of Auditors 2016). The authors of this report share this criticism, as climate adaptation and mitigation are different policy objectives; corre- sponding investment should therefore be tracked separately, as the normative justifications vary for each at a given jurisdictional level.
2.2.3. Investment scope: tangible versus intangible
As explained in section 2.1.1, we tracked only tangible energy and climate investment, such as invest- ment in material assets (e.g. machinery, equipment, infrastructure, or buildings). Actors may also spend money on intangible measures, often referred also to ‘soft’ measures, such as research and de- velopment, including feasibility and preparatory studies, information campaigns, training, and capac- ity-building activities. Due to time constraints, such spending was not included in this report. Where a programme included tangible and intangible components, we accounted only for the tangible com- ponents; if the components were impossible to separate, the programme was excluded from our cal- culation.
2.2.4. Investment scope: total versus incremental
For this report, we tracked total capital investment for all investment flows rather than incremental cost, with two exceptions. The incremental cost reflects the additional expenditure necessary to invest
Box 1. Climate markers for tracking climate-related expenditures of EU funds
In 1998, the Development Assistance Committee (DAC) of the Organisation for Economic Co-operation and De- velopment (OECD) introduced ‘Rio markers’ to monitor and systematically track finance flows relevant to the Rio Conventions on biodiversity, desertification, climate-change mitigation, and adaption.
In 2014, the European Commission adopted a climate-marker system based on Rio markers to identify the cli- mate-relevant share of 2014–2020 disbursement from the European Structural and Investment Funds. Climate mitigation can be a ‘principal’, ‘significant’, or ‘untargeted’ objective of policy action, which is then accounted for as 100%, 40%, or 0% climate-relevant. A descriptive table with sectoral examples of how to score against the markers has been published by the Commission and the OECD-DAC (EC 2014, pp. 29–30; OECD 2016, pp.
61–81). Recently, the European Court of Auditors (ECA) published an assessment of the EU’s approach to tracking the 20% climate-finance target in the EU’s multi-annual financial framework (MFF) and identified considerable room for improvement, not least in relation to the application of climate markers. The ECA iden- tified a significant number of challenges to be addressed for the next MFF in a much-needed reform of the EU’s tracking approach (European Court of Auditors 2016).
We applied the climate-marker methodology to track the disbursement of Connecting Europe Facility (CEF) funding in the energy and transport sector; the agricultural funding schemes of the European Agricultural Guarantee Fund (EAGF) and the European Agricultural Fund for Rural Development (EAFRD); and the dis- bursement of the European Regional Development Fund (ERDF) in the transport and energy sector. Our ap- proach follows the application of climate markers in the European budget reports and the Commission’s publi- cation of an explicit methodology for climate tracking in the 2014–2020 disbursements from the European Structural and Investment Funds.
We also followed this methodology to track climate-specific finance under the funding schemes of the Euro- pean Energy Programme for Recovery (EEPR) in the energy sector. Climate markers were derived from rele- vant fields of the table provided in the common methodology for climate expenditure tracking of the European Commission (EC 2014).
in low-carbon technology instead of a business-as-usual practice, while total capital investment re- flects the full cost of a technology or practice. The flows for which we tracked only the incremental cost represented investment in energy-efficient electrical appliances used in the building sector, as well as in energy-efficient blast furnaces and newly built power plants in the industrial sector (see Table 3).
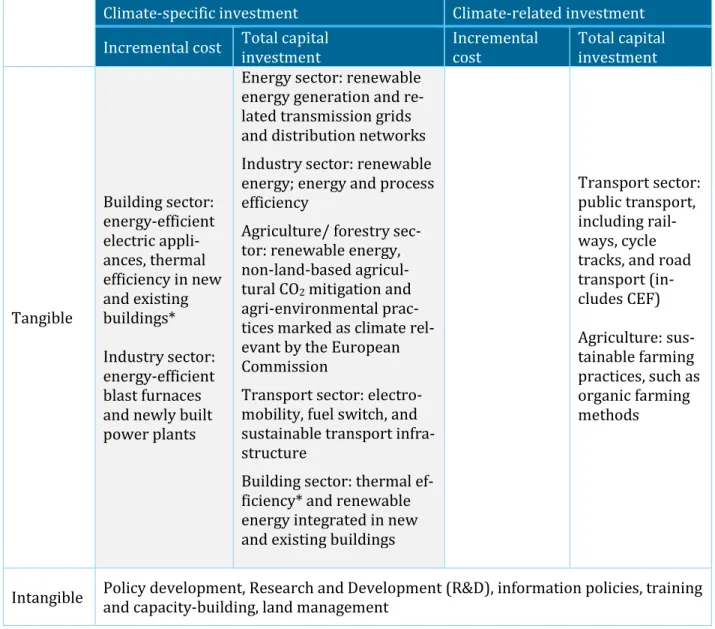
Table 3: Summary of investment and cost delineations
Climate-specific investment Climate-related investment Incremental cost Total capital
investment
Incremental cost
Total capital investment
Tangible
Building sector:
energy-efficient electric appli- ances, thermal efficiency in new and existing buildings*
Industry sector:
energy-efficient blast furnaces and newly built power plants
Energy sector: renewable energy generation and re- lated transmission grids and distribution networks Industry sector: renewable energy; energy and process efficiency
Agriculture/ forestry sec- tor: renewable energy, non-land-based agricul- tural CO2 mitigation and agri-environmental prac- tices marked as climate rel- evant by the European Commission
Transport sector: electro- mobility, fuel switch, and sustainable transport infra- structure
Building sector: thermal ef- ficiency* and renewable energy integrated in new and existing buildings
Transport sector:
public transport, including rail- ways, cycle tracks, and road transport (in- cludes CEF) Agriculture: sus- tainable farming practices, such as organic farming methods
Intangible Policy development, Research and Development (R&D), information policies, training and capacity-building, land management
Covered in this report Not covered in this re-
port
*Both total and incremental investment was estimated for energy-efficiency investment in new and existing build- ings.
As in the 2010 report (Juergens et al. 2012), we also calculated the incremental share of energy-effi- ciency investment in buildings. Construction of new buildings and retrofit of existing buildings imply
the use of many non-energy-related technologies and practices (e. g. painting, and plastering), as well as a high share of business-as-usual construction or retrofit costs (e.g. the cost of a double-glazed typ- ical window instead of an efficient triple-glazed window). The total investment cost of building con- struction and retrofits will therefore overestimate actual efforts towards energy transition. In other sectors, an estimate of total investment could be useful, particularly over time, e.g. to understand the learning cost curve and make market projections for individual renewable energy installations.
Box 2 provides details on how we calculated the incremental investment into the thermal efficiency improvement of existing and new buildings. The estimate of this flow should be treated with caution due to the very limited time available for calculation.
2.2.5. Overview of changes to the analytical framework and methodology
Our assessment applied the same analytical framework and methodology described in Juergens et al.
(2012). However, some changes were necessary to improve the readability of this report and to ac- count for the data limitations described in Table 4 and the next chapter.
Box 2. Incremental investment in the building sector
In this report, the incremental share of investment in the construction of a new building or the retrofit of an existing building refers to the additional investment made to improve the building performance that is beyond that defined by the 2016 minimum energy performance standard for buildings.
Construction of new buildings
The estimate is relevant to the construction and first purchase of new buildings supported by a range of KfW programs. The same assumption was used to calculate the incremental share of energy-efficiency investment for building-related equipment and systems installed in existing buildings and supported by BAFA programs.
The 10% share of incremental investment in its total volume was derived from an analysis conducted by the Institute for Housing and Environment (Institut Wohnen und Umwelt (IWU)). The institute calculated addi- tional energy-relevant retrofit costs per square metre for buildings that exceed the energy-performance stand- ard required under the German energy-performance ordinance for 2016 (IWU 2016). We multiplied this cost by the average ground-floor area for a new house in Germany (Destatis 2018c) to estimate the additional en- ergy-efficiency-related investment per new house. Dividing the latter figure by the average volume of invest- ment in most typical new constructions or building purchase projects supported by KfW programmes yielded a 10% incremental share of energy-efficiency investment in total.
Retrofit of existing buildings
The estimate is relevant to the thermal efficiency retrofits of existing buildings supported by a range of KfW programmes. The same assumption was used to calculate the incremental investment that flowed into the ret- rofit of building-related equipment and systems supported by BAFA programmes.
The share of incremental investment in its total volume was estimated at 40% based on a study by the same institute, IWU. The study analysed the costs of energy-relevant building components and building systems in the energetic modernisation of old buildings (Hinz 2015, p.112). The share of incremental investment was cal- culated as a share of the energy-relevant costs of building components, reported as a percentage of the total costs for these components identified in the study. The study provided the costs for two scenarios, high-cost and low-cost; of these, 40% was the average share.