IHS Economics Series Working Paper 70
September 1999
Cross-Section Analysis of Health Spending with Special Regard to Trends in Austria
Maria M. Hofmarcher
Impressum Author(s):
Maria M. Hofmarcher Title:
Cross-Section Analysis of Health Spending with Special Regard to Trends in Austria ISSN: Unspecified
1999 Institut für Höhere Studien - Institute for Advanced Studies (IHS) Josefstädter Straße 39, A-1080 Wien
E-Mail: o ce@ihs.ac.atffi Web: ww w .ihs.ac. a t
All IHS Working Papers are available online: http://irihs. ihs. ac.at/view/ihs_series/
This paper is available for download without charge at:
https://irihs.ihs.ac.at/id/eprint/1191/
Institut für Höhere Studien (IHS), Wien Institute for Advanced Studies, Vienna
Reihe Ökonomie / Economics Series No. 70
Cross-Section Analysis of Health Spending with Special Regard to Trends in Austria
Maria M. Hofmarcher
Cross-Section Analysis of Health Spending with Special Regard to Trends in Austria
Maria M. Hofmarcher
Reihe Ökonomie / Economics Series No. 70
September 1999
Institut für Höhere Studien Stumpergasse 56, A -1060 Wien Fax: +43/1/599 91-163 Maria M. Hofmarcher Phone: +43/1/599-91-127 E-mail: hofmarch@ihs.ac.at
Institut für Höhere Studien (IHS), Wien
Institute for Advanced Studies, Vienna
The Institute for Advanced Studies in Vienna is an independent center of postgraduate training and research in the social sciences. The Economics Series presents research carried out at the Department of Economics and Finance of the Institute. Department members, guests, visitors, and other researchers are invited to submit manuscripts for possible inclusion in the series. The submissions are subjected to an internal refereeing process.
Editorial Board Editor:
Robert M. Kunst (Econometrics) Associate Editors:
Walter Fisher (Macroeconomics) Klaus Ritzberger (Microeconomics)
Abstract
During the 90s the increase in health spending which compared to the overall growth had taken place at a rather rapid pace experienced a worldwide slow-down. In relation to overall economic growth and the expansion of other countries’ health care systems, Austria’s system grew below average- a fact which holds particularly true for the years between 1990 and 1997. This development may largely be due to a constant consolidation of budget and relatively high prices for private households which are possibly overestimated, however. This overestimation of prices are probably caused by unascertained productivity improvements which may have occurred in the acute care sectors. Within our observation period of 16 years, the private households’ expenditure reached a peak with spending on physician services experiencing the fastest increase. Although overestimated, the high prices in the health sector together with sharply rising consumption expenditure on health care constitute an increased burden on households.
Zusammenfassung
Je reicher ein Land ist, um so mehr wird für den Gesundheitssektor ausgegeben. Das relativ schnellere Wachstum der Gesundheitsausgaben ist – global betrachtet – in den 90er Jahren träger geworden. Im Verhältnis zum Wirschaftswachstum und im Vergleich mit anderen Ländern ist das reale Wachstum der Gesundheitsausgaben pro Kopf in Österreich vor allem in der Periode 1990 bis 1997 unterdurchschnittlich. Budgetkonsolidierung, relativ hohe Preise für die privaten Haushalte, die allerdings auch systematisch überschätzt sein dürften, bei gleichzeitig nicht erfaßten, aber ziemlich wahrscheinlichen Produktivitätsfortschritten in den Kernbereichen des Gesundheitssektors, könnten die Ursachen für diese Entwicklung sein. Die Ausgaben der privaten Haushalte verzeichneten innerhalb von 16 Jahren das größte Plus. Am raschesten wuchsen die Ausgaben für Ärztliche Dienste. Im Lichte der, wenngleich wahrscheinlich überschätzten, Preisentwicklung bedeutet die Kombination aus relativ hohen Preisen und stark wachsenden Konsumausgaben für Gesundheit eine verstärkte Belastung für die privaten Haushalte.
Keywords
Health Expenditures, Cross Section, Estimation of, European Union, Austria
Schlagworte
Gesundheitsausgaben, Querschnittsanalyse, Schätzung, Europäische Union, Österreich
JEL Classifications
C21, C22, I10
Contents
1 INTRODUCTION: THE RICHER A COUNTRY, THE HIGHER ITS EXPENDITURE ON HEALTH CARE1
2 CROSS COUNTRY ESTIMATION... 2
3 DECELERATED INCREASE IN HEALTH SPENDING... 3
3.1 DECELERATED GROWTH IN HEALTH CARE EXPENDITURE IN EU COUNTRIES...5
3.2 INDIVIDUAL COUNTRIES INFLUENCE WORLDWIDE GROWTH IN EXPENDITURE...6
4 THE ROLE OF THE PRICES IN A HEALTH CARE SYSTEM ... 7
4.1 REAL PER CAPITA SPENDING IS UP IN NEARLY ALL THE COUNTRIES...8
4.2 THE REAL INCREASES CHANGE AS THE GAP BETWEEN GROWTH RATES WIDENS...8
4.3 RELATIVE PRICES ARE UP...9
5 AUSTRIA ... 11
5.1 DEVELOPMENT IN HEALTH SPENDING AND TRENDS CONCERNING THE FACT ORS CONNECTED WITH IT...11
5.2 ELASTICITIES OF HEALT H SPENDING IN AUSTRIA BETWEEN 1981 AND 1997...14
6 CONCLUSION: THE HEALTH CARE SYSTEM WILL EXPAND FURTHER ...16
LITERATURE...22
I H S — Maria M. Hofmarcher / Cross-Section Analysis of Health Spending — 1
1 Introduction: The richer a country, the higher its expenditure on health care
In contrast to a linear correlation, the exponential trend depicted in figure 1 not only demonstrates that the development of health spending interacts with the development of the GDP but also shows that after a certain level of income an increase in earnings is accompanied by a disproportionately sharp rise in health care expenditure.
Relative to the respective GDP-level, health care expenditures in Poland, in Slovenia and in Greece are lower compared to the EU-average. In rich countries, for example
Austria, Belgium, France, Germany, the Netherlands, Switzerland and the USA, the amount spent on health care is high relative to GDP.
In the following sections we will closely examine the relationship between GDP and health care spending and in particular estimate the elasticities of health care expenditure with respect to income1. For this purpose the relationship between health
1 The concept of elasticities gives us the chance to quantify by how many percent health spending - ceteris paribus - rises when the aggregate income increases by one percent. An income elasticity of one indicates that a one- percent increase in income leads to a one-percent rise in spending (constant elasticity). If the elasticity ranges above one, spending is increasing more rapidly than income (which makes health care services appear to be a luxury good). From the beginning of the 70s economists have been engaged in an empirical analysis of the relationship between health spending and aggregate income. To get a better understanding of their various approaches, please see Gerdtham, U.-G. et al.: An econometric analysis of health care expenditures: A cross section study of the OECD-countries, Journal of Health Economics 11 (1992), p. 63-84, North Holland; Mc Gurie, A.
et al.: Econometric analysis of National Health expenditures: Can positive economics help to answer normative questions? Health Economics 2 (1993), p. 113-126; OECD: Factors affecting health spending: a cross country econometric analysis, Annex A, New Directions in Health Care Policiy, Health Policy Studies 7, p. 71-88, Paris.
N e t h e r l a n d s F r a n c e
G e r m a n y
S w e d e n Italy F i n l a n d
U n i t e d K i n g d o m I r e l a n d
S p a i n P o r t u g a l
G r e e c e S l o v e n i a C z e c h R e p u b l i c
H u n g a r y
P o l a n d
D e n m a r k
B e l g i u m A u s t r i a
R2 = 0 . 8 4 3 7
0 2 0 4 0 6 0 8 0 1 0 0 1 2 0 1 4 0 1 6 0
0 2 0 4 0 6 0 8 0 1 0 0 1 2 0
G r o s s d o m e s t i c p r o d u c t E U 1 5 = 1 0 0 Health Expenditures, EU15=100
F i g u r e 1 : H e a l t h E x p e n d i t u r e a n d G D P 1 9 9 7 o r l a s t a v a i l a b l e y e a r , w i t h o u t L u x e m b u r g , S w i t z e r l a n d , U S A
p e r c a p i t a $ p u r c h a s e p o w e r p a r i t y , E U - 1 5 = 1 0 0
I H S — Maria M. Hofmarcher / Cross-Section Analysis of Health Spending — 2
careexpenditure and aggregate income is depicted by means of a line. The slope of the line is estimated in a cross-section approach which captures all the respective countries2. Based on percentage changes in aggregate income, percentage changes in health spending help to understand how distinct income levels affect the level of health care expenditure3.
2 Cross Country Estimation
The relation between Health Expenditures (HE per capita) and GDP (per capita) was measured by a linear regression model for the log of the values. For justifying the linearity of the relationship both variables were transformed with the logarithm function:
log(HE)i =α βi+ ⋅log(GDP)i (1)
and elasticities have been computed for the years 1991, 1994, 1996 and 1997. In this simple model 1 no time trend was considered.
In a second model a least square dummy variable approach (Fixed Effects)4 was employed to capture both time and country inter-correlation. Extending the least square dummy variable approach by considering the time specific effects has the general form, where country specific dummies are represented by
α
i and time specific dummies byγ
t:yit =α γi + t +βxit +εit (2)
Thus, in our case we have the following model with dummy variables for country and time:
log( HE ) const log( GDP ) Dummy Dummy Be lg ium Denmark Finland France Germany Greece
Ireland Italy Luxembourg Netherlands Portugal
Spain Sweden UK
it it
it
= + ⋅ + ⋅ + ⋅ + ⋅
+ ⋅ + ⋅ + ⋅ + ⋅ + ⋅
+ ⋅ + ⋅ + ⋅ + ⋅ + ⋅
+ ⋅ + ⋅ + ⋅ +
β γ γ α
α α α α α
α α α α α
α α α ε
1 2 1
2 3 4 5 6
7 8 9 10 11
12 13 14
91 94
2 With regard to new findings that had been made concerning the functional relationship between health spending and GDP (double-logarithmic function), both variables were measured in logarithms in this analysis. (see further Gerdtham, U.-G. et al. (1992). Even in multiple regressions, the relationship between GDP and health spending turns out to be most pronounced which is why we solely concentrate on this relationship in our analysis.
3 The following figures also include Luxemburg, Switzerland and the USA.
4 See Greene , W.H.- Econometric Analysis, Macmillian Publishing Company, New Jersey 1993 p.444-480.
I H S — Maria M. Hofmarcher / Cross-Section Analysis of Health Spending — 3
The data base for model 2 was the pool of the countries under consideration with the variables for health care expenditure and GDP (in logarithms) for the years 1991, 1994 and 1997. In this variance-analytical approach the datapoint “Austria 1997” was used as the reference category. The occuring effects have to be interpreted as deviation from
“Austria 1997”. The relation between the variables health expenditure and GDP can be seen as adjusted for time and country effects.
3 Decelerated increase in health spending
The ratio between the annual growth in GDP per capita and the annual increase in health spending per capita shows that the goods and services of a health care system appear to be “luxury goods”. From the middle of the 90s, however, the increase in spending has been slowed down all over the globe but particularly in the EU countries.
For example, in 1997 the rise in health care expenditure was slightly lower than the increase in income in those countries which had already qualified for the monetary union.
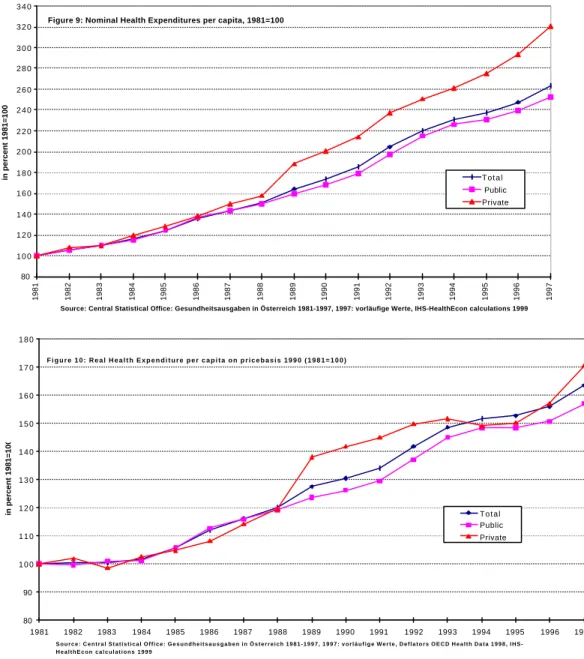
After adjusting for differences in purchasing power expressed in US dollars, GDP and health spending significantly correlated in 1991, 1994, 1996 and 1997. The slope of the lines depicted in figures 2 to 4 shows the elasticity reflecting the relationship between the increase in health spending per capita and the rise in income per capita. Table 1 summarizes the income elasticities of health spending depicted in figures 2 to 5.
Furthermore, the countries concerned were classified into certain groups which revealed that the income elasticity of health spending experienced a worldwide decrease by 25% between 1991 and 1997 and amounted to 1.15 in 1997. Relative to aggregate income health spending decreased by 16% between 1991 and 1994 and by 8% between 1994 and 1997. When we compare 1997 to the years 1991 and 1994, we come to the conclusion that either proportionally less money was spent on health care in 1997 or other factors not included in the relationship between GDP and health spending were growing proportionally stronger. Thus, either the formerly „luxurious“
medical services became “necessities” or other factors like structural changes and/or the introduction of new institutional rules or new “market systems“ were growing increasingly dominant.
I H S — Maria M. Hofmarcher / Cross-Section Analysis of Health Spending — 4
Figure2: Income Elasticity of Health Expenditure 1991 per capita $ purchasing power parity
Spain
Belgium Finland
3.16Schweden,Italien4.23 Netherlands
Germany Austria Denmark France
Greece Ireland Portugal
United Kingdom Switzerland
Luxemburg United States
Czech Republic Hungary
Slovenia
Poland
y = 1.5528x - 3.4462 R2 = 0.8551
2,00 2,10 2,20 2,30 2,40 2,50 2,60 2,70 2,80 2,90 3,00 3,10 3,20 3,30 3,40 3,50 3,60
3,60 3,70 3,80 3,90 4,00 4,10 4,20 4,30 4,40 4,50 4,60
Log (GDP per capita)
Log (Health Expenditures per capita)
Figure 3: Income Elasticity of Health Expenditure 1994 per capita $ purchasing power parity
Ireland
Switzerland
Portugal
Finland Italy
Austria Netherlands
Belgium France
Denmark Germany
Greece Spain Czech Republic
Luxemburg
Sweden
Hungary
Poland
Slovenia
United States
United Kingdom
y = 1.3026x - 2.3787 R2 = 0.8893 2,00
2,10 2,20 2,30 2,40 2,50 2,60 2,70 2,80 2,90 3,00 3,10 3,20 3,30 3,40 3,50 3,60
3,60 3,70 3,80 3,90 4,00 4,10 4,20 4,30 4,40 4,50 4,60
Log (GDP per capita)
Log (Health Expendituers per capita)
I H S — Maria M. Hofmarcher / Cross-Section Analysis of Health Spending — 5
Poland (Estimation) Hungary (Estimation)
Czech Republic (Estimation
Switzerland
Spain Portugal
Luxemburg
Italy
Greece
Germany
Denmark Austria,Belgium
Slovenia (1994)
Netherlands United Kingdom
Sweden Finland France
Ireland
United States
y = 1.2472x - 2.1601 R2 = 0.8539
2,00 2,10 2,20 2,30 2,40 2,50 2,60 2,70 2,80 2,90 3,00 3,10 3,20 3,30 3,40 3,50 3,60
3,70 3,80 3,90 4,00 4,10 4,20 4,30 4,40 4,50 4,60
Log (Gross Domestic Product per capita)
Log (Health Expenditure per capita)
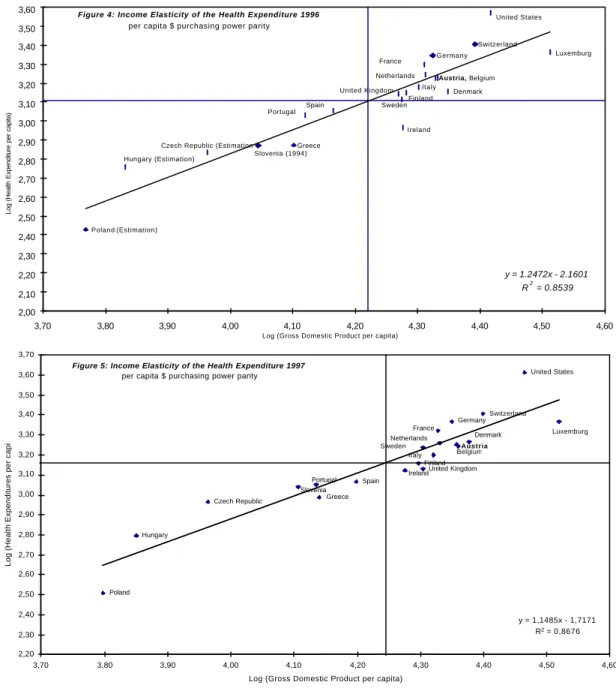
Figure 4: Income Elasticity of the Health Expenditure 1996 per capita $ purchasing power parity
Austria
United States
Luxemburg Switzerland
Germany
Belgium Denmark Netherlands
France
Ireland Spain Portugal Slovenia Czech Republic
Hungary
Poland
Greece
Finland United Kingdom Sweden
Italy
y = 1,1485x - 1,7171 R2 = 0,8676 2,20
2,30 2,40 2,50 2,60 2,70 2,80 2,90 3,00 3,10 3,20 3,30 3,40 3,50 3,60 3,70
3,70 3,80 3,90 4,00 4,10 4,20 4,30 4,40 4,50 4,60
Log (Gross Domestic Product per capita)
Log (Health Expenditures per capita)
Figure 5: Income Elasticity of the Health Expenditure 1997 per capita $ purchasing power parity
3.1 Decelerated growth in health care expenditure in EU countries
According to our calculations, it is above all the EU countries which seem to cause a slow-down in the rise of health spending compared to changes in GDP. The cross- section analysis of the relative rise in health spending shows that the elasticity was decreasing by 25% between 1991 and 1997 when it reached 1.05. This development may be due to the EU member states‘ strenuous efforts to meet the convergence criteria for participation in the monetary union. In this context it has to be pointed out that the share of health spending in overall public expenditure accounts for 10 to 20% within the EU. The income elasticity of those 11 European countrieswhich already qualified for participation amounted to 0.98 1996 and 1997, respectively, and thus just failed to reach 1 – a fact which occurs to be a further sign for a decelerated growth in expenditure.
I H S — Maria M. Hofmarcher / Cross-Section Analysis of Health Spending — 6
Table 1 Income elasticity of health spending Model 1 Cross-section measurement
dependent variable: health spending per capita $ PPP
1991 1994 1996 1997
All the countries-21
log GDP (t-value)
1.55 (10.59)
1.30 (12.36)
1.25 (10.54)
1.15 (11.16) (R2=0.80-0.88) constant
term (t-value)
-3.45 (-5.67)
-2.38 (-5.38)
-2.16 (-4.32)
-1.71 (-3.91)
EU-15 log GDP (t-value)
1.40 (6.52)
1.14 (6.29)
1.11 (4.96)
1.05 (6.65) (R2=0.63-0.77) constant
term (t-value)
-2.82 (-3.12)
-1.70 (-2.21)
-1.59 (-1.66)
-1.32 (-1.94)
EU-11 log GDP (t-value)
-- -- 0.98
(3.48)
0.98 (5.02) (R2=0.53) constant
term (t-value)
-- -- -1.02
(-0.85)
-1.01 (-1.20)
Model 2 Fixed effects measurements
dependent variable: health spending per capita $ PPP
1991, 1994, 1997
Coefficient Confidence Interval
EU-15 log GDP (t-value)
1.45 (3.89)
0.69-2.22
(R2=0,978), (F=45.17) DW: 2.06
constant term (t-value)
-3.09 (-1.89)
EU-15, Switzerland,
USA
log GDP (t-value)
1.29 (3,87)
0.61-1.96
(R2=0,966), (F=72.12) DW: 2.06
constant term (t-value)
-2.35 (-1.63)
GDP: gross domestic product per capita $PPP
t-value: Test statistics for the coefficients. A value ≥ 2 confirms the hypothesis that GDP per capita is significantly different from 0 (error probability of 5%).
R2 : coefficient of determination regarding the strength of the relationship between GDP and health spending
Durbin Watson Test: A test for serially correlated (or autocorrelated) residuals. Values less than 2 indicate positive autocorrelation, a common problem in time-series data. Values greater than 2 indicate negative autocorrelation.
Sources: see tables A1 and A2, calculations by IHS HealthEcon.
3.2 Individual countries influence worldwide growth in expenditure
However, a cross section analysis has a disadvantage because it assumes that all countries under investigations have a similar propensity to consume health care. In addition such an analysis cannot embrace real changes that took place within the period studied and/or structural breaks. When looking at the fixed effects measurement we see that the relative change in health spending amounted to 1.45 over time.However, the corresponding 95% confidence interval is quite wide and ranges from 0.7 to 2.22. Defining a 5% error probability we found that - adjusted for time trends - France, Germany and the Netherlands exhibit a significantly higher elasticity of health spending
I H S — Maria M. Hofmarcher / Cross-Section Analysis of Health Spending — 7
than Austria. In those countries expenditure on health care either grew excessively or proportionally weaker in relation to the rise in GDP. If we include Switzerland and the USA into our analysis, the change accounts for 1.29, with France, Germany, the Netherlands and the United States having a significant effect on the global elasticity. Our results are generally in keeping with those obtained in other studies (see footnote 2).
The measurement of a fixed effects model for the 21-country sample, however, lessens the stability of our parameters which may be due to different determinants not included into the relationship between growth in health spending and GDP in the various countries. This may have occurred primarily due to the variance of the relation in spending and income in the applicant countries (MOEL-4). Nevertheless, the elasticity is very likely to dependent on other factors which exert a certain kind of influence on health care expenditure5.
With a low 0.78, the relative change in health spending was out of proportion in the Czech Republic, Hungary, Poland and Slovenia (MOEL-4) in 1996. This result corresponds to findings obtained in other studies, in which GDP did not correlate sig- nificantly with health spending and in which no reasonable results could be obtained for 1997. According to calculations by the World Bank, the elasticity of health spending lies between 0.8 and 1.08 in low-income countries (less than US$ 785 per capita) and amounts to 1.10 in “middle income countries“ (between US$ 786 and US$ 9,635 per capita).6 Apart from the fact that an updating of components included in the national accounts distorted the national statistics of transition countries, there might be striking disproportionalities between the development of the health care systems and the pace of overall economic growth which are inefficient on a macroeconomic basis. This trend is further reinforced by the fact that potential life years lost (before age 65) in Central and Eastern Europe are approximately 60% higher than the EU average.7
4 The role of the prices in a health care system
While the relative increase in health spending took place at a steady pace during the 1980s, it experienced a slow-down in the first half of the 90s. In addition to that the gap between the annual increase in GDP and the annual rise in health care expenditure widened. The problems with the measurement of price indices surely account for part of the increasing gap but inefficiencies, as well as excessive charges may also be held responsible for the change.
5 Blomqvist et al. suggested that all the calculations of elasticity overestimated its real level which was particularly due to country-specific factors that had not been taken into account but had nevertheless correlated with income.
Their criticism, however, refers far more to the methods applied than to the contents. Blomqvist, A.G., Carter, R.A.L.: Is Health Care really a luxury? Journal of Health Economics 16 (1997), p. 207-229.
6 The World Bank: World Development Indicators 1998, Washington D.C., p. 91.
7 Hofmarcher, M. M: Is Public Health Between East and West? Analysis of Wealth, Health and Mortality in Austria, Central and Eastern European Countries, and Croatia Relative to the European Union, Croatian Medical Journal 39/3 (1998), p. 241-248.
I H S — Maria M. Hofmarcher / Cross-Section Analysis of Health Spending — 8
4.1 Real per capita spending is up in nearly all the countries
It is rather striking that relative prices, as well as real spending per capita were growing strongly although differences in the set-up and financing of the various health care systems were persistent. Between 1981 and 1996 real spending per capita (at constant 1990 prices), experienced an average annual rise of 1.25% in Germany, 1.93% in the USA, 2.12% in Switzerland and 3.59% in France. In Austria the expenditure rose by 1%
within the same period of time whereas real GDP increased by 1.73% a year.
Throughout the 80s nominal, as well as real growth rates developed concurrently without major gaps between levels.
4.2 The real increases change as the gap between growth rates widens
In Austria, France, Germany, the Netherlands, Switzerland, Great Britain and the United States, the real rise in GDP per capita amounted to an average of 1.40% between 1981 and 1996 while the increase in real health spending per capita accounted for 1.92%within the same period of time. Table 2 shows that between 1983 and 1989 real per capita growth rates equaled 2.55% and 2.72%. From 1990 to 1996, however, they experienced a slow-down to 0.42 and 1.25%.
Within the periods considered, the increase in real health care spending per capita was diminishing by an average of more than 50% while real GDP per capita was suffering an even stronger decrease. This development led to a displacement effect, as well as to a widening in the gap between the two growth rates. Both real increase in income and real rise in spending were below average with the latter being a bit higher in all the countries except for the USA, Switzerland, and Austria between 1990 and 1996. Within our three periods of observation the Dutch health care system grew slightly less in relation to the other countries’ systems.
Real per capita growth has been quite consistent during the 80s. However, in the first half of the 90s the tendency became heterogeneous while nominal spending per capita grew much stronger than GDP per capita. The sometimes significant differences between the institutional set-ups of the various health care systems might have become stronger in recent years. Massive structural changes as for example the introduction of so-called “quasi-markets“ which have by now become a rather common feature in Finland, Italy, Spain, Sweden, Great Britain etc. might incite a medium-term price increase.
I H S — Maria M. Hofmarcher / Cross-Section Analysis of Health Spending — 9
Apart from ever increasing transaction costs regarding the drawing-up of price lists for medical services, contracts etc., the practical problem consists of the rather costly development of “real“ bargaining prices. According to new findings8 Great Britain and Sweden are particularly engaged in a reexamination of the concept of market liberalization in the field of health care with the emphasis being once again placed on the planning competence of the communities.9
4.3 Relative prices are up
Figure 6 shows both the rate of price increase and the relative prices10 then current in the EU member states, Switzerland and the USA. Except for Denmark, France, Germany, Italy and Spain the rise in prices for medical services are sometimes quite higher than the general price level in an economy, which holds also true for Austria. At constant 1990 prices, relative prices accounted for 2.58 in 1996 (right scale) which shows that the price increase in the health care sector was more than twice as high as the overall rise in prices. It is, however, difficult to assess whether prices are “too high”
8 Interview with Victor Fuchs, Health Affairs 17/1 (1998), p. 91-96. Fuchs points out that the change in European health spending which unfolds much more slowly than in the USA has to be particularly attributed to supply side constraints (p. 95).
9 Saltman, R. B., Figueras, J.: European Health Care Reform: Analysis of Current Strategies, WHO Regional Office for Europe, 1997, Kopenhagen.
10 Relative prices indicate for example in how far a country’s prices for health care services change in relation to other prices.
Table 2 Growth rates of the gross national product per capita (GDP) and health spending per capita (HS)
1981-1996 1983-1989 1990-1996
nominal real nominal real nominal real
GDP HS GDP HS GDP HS GDP HS GDP HS GDP HS
Austria 5.19 6.14 1.73 1.00 5.46 6.98 2.21 2.20 4.18 5.86 1.05 0.42 France 5.73 7.21 1.32 3.59 6.89 8.06 2.12 4.38 2.72 4.25 0.54 2.21 Germany 3.75 4.56 0.93 1.25 4.73 4.36 2.68 2.49 2.02* 4.83* -1.21* 1.44*
Netherlands 3.56 3.94 1.77 1.71 3.25 3.14 2.40 1.91 3.51 3.97 1.51 1.46 Switzerland 3.66 5.93 0.38 2.12 5.46 6.82 2.25 3.62 1.15 3.65 -1.25 0.14 Great Britain 7.11 8.23 2.16 1.84 8.91 8.37 3.47 1.76 4.75 7.24 1.12 2.24
USA 4.89 7.77 1.51 1.93 6.38 8.76 2.74 2.69 3.59 5.50 1.14 0.86**
Average growth 4.84 6.25 1.40 1.92 5.87 6.64 2.55 2.72 3.13 5.04 0.42 1.25
*including Eastern Germany
**deflator of health spending estimated for 1995 and 1996
Sources: OECD Health Data 1998, Central Statistical Office, May, June 1998, IHS-HealthEcon – calculations for 1999.
I H S — Maria M. Hofmarcher / Cross-Section Analysis of Health Spending — 10
when we have no information about possible improvements in productivity.11 The only thing we are able to derive from figure 5 is that in 12 out of 17 countries prices in the health sectors increased more rapidly than the general price level. There are various factors which surely contribute to a distortion or exaggeration of the extent of price increase on health care markets, as for example unascertained improvements in productivity12, an excessive rise in the amount of goods used and services performed and problems to measure output and outcome, as well as their changes in quality over time. A special price index for health care systems might be used to ascertain improvements in productivity. Measurement problems concerning the indices which are persistent in any calculation of inflation rates explain part of the differences between the rates of price increase. Nevertheless, inefficiencies and “real” high prices may also be responsible for the development of prices in the health care sector.
Figure 6: Average Growth Rates of Prices per year 1990 - 1997* (1990=100)
3,34
4,15
9,97
4,95 3,85
4,89
3,11
0,70 4,77 5,63
3,80
2,00 18,74
7,00
7,75
2,39
5,18
0,00 2,00 4,00 6,00 8,00 10,00 12,00 14,00 16,00 18,00 20,00
Austria Belgium Denmark Finland France Germany Greece Ireland Italy Luxembourg Netherlands Portugal Spain Sweden United Kingdom Switzerland United States
*or last year available (1996: A, F, GER, ITA, LUX, NED, SPAIN, UK; 1995: FIN; 1994: IRE, USA; 1993: B, G, ITA, P, SWE) Sources: OECD Health Data 1998, IHS HealthEcon calculations 1999
Growth Rates in percent
-2,00 -1,00 0,00 1,00 2,00 3,00 4,00 5,00 6,00
Growth Rates in percent (relative prices)
GDP Deflator Health Deflator
Relative Prices (righthand scale)
11 If “potential life years lost“ is regarded as a proxy indicator for improvements in productivity, Austria ranks first among all the other countries studied. (see also Hofmarcher, M.M.: Das Gesundheitswesen in Österreich, neue Trends, neue Fakten, IHS Working Paper Nr. 19 (1997), Vienna.
12 Weisbrod (1991) and Newhouse (1992) describe the impact of technological changes and research on the spending trend in a health care system. Weisbrod, B.A: “The Health Care Quadrilemma: An Essay on Technological Change, Insurance, Quality of Care and Cost Containment”, Journal of Economic Literature 29 (1991), p. 523-52;
Newhouse, J.P.: “Medical Care Costs: How much Welfare Loss?”, Journal of Economic Perspective 6/3 (1992), p.
3-21.
I H S — Maria M. Hofmarcher / Cross-Section Analysis of Health Spending — 11
5 Austria
5.1 Development in health spending and trends concerning the factors connected with it
In Austria, the propensity to consume health services is high. Thus Austrians apparently consider health care to be a superior good. In real terms, however, health spending experienced a lower increase than GDP per capita . With regard to a rise in services performed, a variety of new goods and services available and an ever increasing life expectancy, this result clearly contradicts every experience made so far. However, significant measuring difficulties and overcharged prices in the private sector which in the view of ever rising consumption expenditure put a particular burden on private households might explain this development.
Figure 7: Development of Health Expenditures (in percent of GDP 1981-1997)
6,8 6,7
6,5 6,6 6,7
6,9 7,1 7,1 7,3 7,2 7,2
7,6
8,1 8,1 8,0 8,0
8,3
5,2 5,1 5,0 5,0 5,1
5,3 5,4 5,4 5,4
5,3 5,3
5,6
6,0 6,0
5,9 5,9 6,0
1,6 1,6 1,5 1,6 1,6 1,6 1,7 1,7
1,9 1,9 1,9 2,1 2,1 2,1 2,1 2,2 2,3
0,0 1,0 2,0 3,0 4,0 5,0 6,0 7,0 8,0 9,0
1981 1982 1983 1984 1985 1986 1987 1988 1989 1990 1991 1992 1993 1994 1995 1996 1997
Source: Health Expenditure in Austria, Statistische Nachrichten 5 (1998), Gesundheitsausgaben 1997: vorläufige Werte, IHS- HealthEcon calculations 1999
In Prozent des BIP
Total Public Private
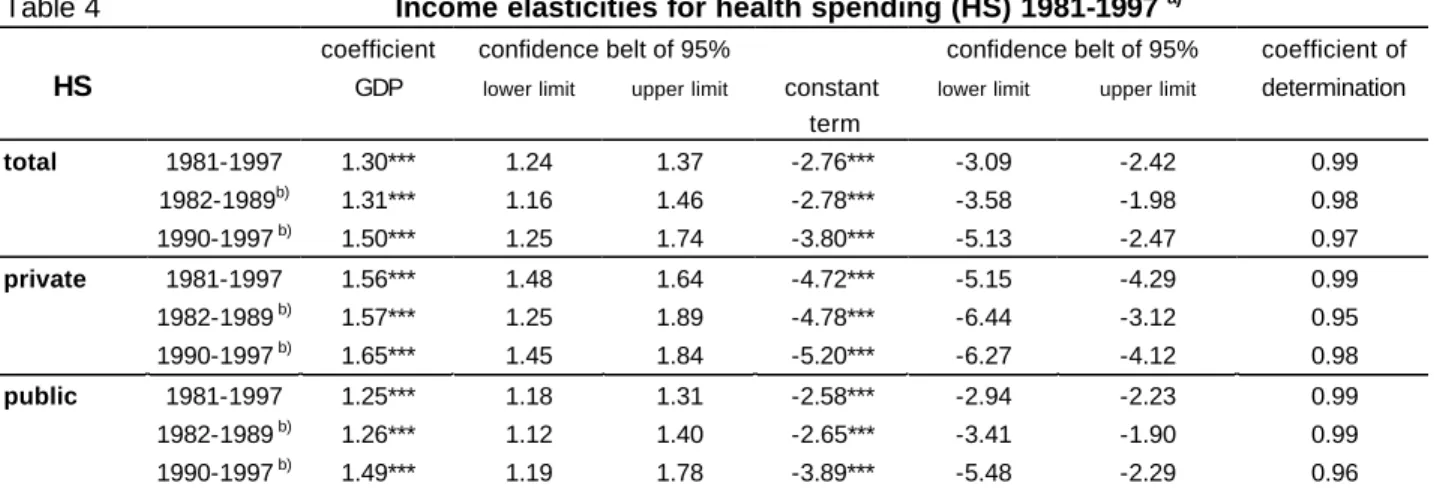
In 1997 overall health care expenditure13 amounted to 8.3% of the GDP (Figure 7) and was thus 21.4% higher than in 1981. Public health spending increased by 16.4%. The private households‘ consumption expenditure, however experienced a rise of 48%
between 1981 and 1997. Figure 8 shows that the private households‘ spending on physician services as share of their overall health spending increased by 25% within the period studied. Compared to public expenditure, private health care spending per capita rose significantly. Figure 9 documents the development of nominal spending per capita.
From 1981 to 1997 private health spending morethan tripled. At the end of our period of observation the increase in private health spending was 27% higher than public health care expenditure, which, however, had also more than doubled from 1981 to 1997. With
13 Health care expenditures in Austria: OECD/VGR - concept; 1981 - 1997: Central Statistical Office, December 1998.
I H S — Maria M. Hofmarcher / Cross-Section Analysis of Health Spending — 12
regard to constant 1990 prices14 real private spending per capita rose by 70% (see Figure 10).
Figure 8: Development of the Expenditures of private households 1981-1997 (in percent of total expenditures of private households)
0 20 40 60 80 100 120 140
1981 1982 1983 1984 1985 1986 1987 1988 1989 1990 1991 1992 1993 1994 1995 1996 1997
Source: Central Statistical Office: Gesundheitsausgaben in Österreich 1981-1997, GA für 1997: vorläufige Werte, Dezember 1998, IHS- HealthEcon calculations 1999
in percent 1981=100
Copayments Physician Services Private Health Insurance
As demonstrated in table 3, the average rise of private nominal spending on physician services amounted to slightly more than 10% a year and was thus twice as high as the increase in both co-payments and expenditure on private health insurance. Within our total period of observation, the nominal health spending of private households rose by 8.03% with the growth rate amounting to 8.4% between 1982 and 1989 and to 7.7%
from 1990 to 1997.
Between 1981 and 1997 public spending on health increased by 6.4% with overall public expenditures rising by 5.9% and overall health care expenditure increasing by 6.7% per year.
The slow-down in the rise of public spending was to a large extent due to a reinforced policy of budget consolidation which also affected social health insurance that finance at least 80% of overall public health expenditure. Effective tools for a deceleration of the increase in spending were reduced contracts with physician practices, efficient negotiations with pharmaceutical companies, as well as the budgeting of expenditure in certain fields of health care.
The sharp increase in private spending on physician services could be due to people’s ever increasing demand for private doctors who practice but who have no contracts
14 Both nominal and overall publich health spending were adjusted by means of the GDP deflator. Private spending, however, was adjusted with the help of the price index regarding private consumption of medical services which can be found in the OECD Health Data 1998.
I H S — Maria M. Hofmarcher / Cross-Section Analysis of Health Spending — 13
with social insurance companies. In addition, since 1996 the reimbursement rate for patients who see a private physician decreased from 100% to 80% This analysis, however, is by no means clear on the question whether the Austrians‘ preference for private physicians arises from both a stronger health awareness and higher disposable income and /or whether the increased deductible is responsible for the dynamic change in health spending. It is highly probable, however, that a mixture of both trends accounts for the Austrian status-quo.
Figure 9: Nominal Health Expenditures per capita, 1981=100
80 1 0 0 1 2 0 1 4 0 1 6 0 1 8 0 2 0 0 2 2 0 2 4 0 2 6 0 2 8 0 3 0 0 3 2 0 3 4 0
1981 1982 1983 1984 1985 1986 1987 1988 1989 1990 1991 1992 1993 1994 1995 1996 1997
Source: Central Statistical Office: Gesundheitsausgaben in Österreich 1981-1997, 1997: vorläufige Werte, IHS-HealthEcon calculations 1999
in percent 1981=100 T o t a l
Public Private
F i g u r e 1 0 : R e a l H e a l t h E x p e n d i t u r e p e r c a p i t a o n p r i c e b a s i s 1 9 9 0 ( 1 9 8 1 = 1 0 0 )
80 90 1 0 0 1 1 0 1 2 0 1 3 0 1 4 0 1 5 0 1 6 0 1 7 0 1 8 0
1981 1982 1983 1984 1985 1986 1987 1988 1989 1990 1991 1992 1993 1994 1995 1996 1997
S o u r c e : C e n t r a l S t a t i s t i c a l O f f i c e : G e s u n d h e i t s a u s g a b e n i n Ö s t e r r e i c h 1 9 8 1 - 1 9 9 7 , 1 9 9 7 : v o r l ä u f i g e W e r t e , D e f l a t o r s O E C D H e a l t h D a t a 1 9 9 8 , I H S - H e a l t h E c o n c a l c u l a t i o n s 1 9 9 9
in percent 1981=100 T o t a l
Public Private
We are not able to give a detailed enumeration of reasons why private health spending rose so excessively, however, the data seem to indicate that the Austrians‘ increased care for their health manifested itself in a higher consumption of health care services.
As already mentioned before, health is probably the population’s supreme asset.
I H S — Maria M. Hofmarcher / Cross-Section Analysis of Health Spending — 14
Table 3 Nominal average growth rates
1981-1997 1982-1989 1990-1997
Health spending public 6.43 6.32 6.74
private 8.03 8.42 7.70
Private households Co-payments 7.36 8.33 6.35
Physician services 9.35 9.17 10.48
Private health insurance 6.44 7.11 4.94
Gross national product 5.42 5.39 4.79
Total public spending 5.86 5.5 5.65
Total health spending 6.70 6.67 6.85
Source: Central Statistical Office, December 1998, calculations by IHS-HealthEcon, 1999.
5.2 Elasticities of health spending in Austria between 1981 and 1997
Between 1981 and 1997 the relative increase in nominal health spending per capita ranged between 1.24 and 1.37 (95% confidence interval). Within the same period of time, private consumption expenditure experienced a proportional rise between 1.48 and 1.64 while public consumption spending grew between 1.18 and 1.31. (Table 4)15.Compared to relative public spending in the periods 1982 to1989 and 1990 to 1997 respectively, the elasticity of private spending was 24 percent and 11 percent higher.
This higher elasticity of private households health spending confirms the observations in figure 9 and reinforces the evidence indicated in table 4.
Table 4 Income elasticities for health spending (HS) 1981-1997 a)
coefficient confidence belt of 95% confidence belt of 95% coefficient of
HS GDP lower limit upper limit constant
term
lower limit upper limit determination
total 1981-1997 1.30*** 1.24 1.37 -2.76*** -3.09 -2.42 0.99
1982-1989b) 1.31*** 1.16 1.46 -2.78*** -3.58 -1.98 0.98
1990-1997 b) 1.50*** 1.25 1.74 -3.80*** -5.13 -2.47 0.97
private 1981-1997 1.56*** 1.48 1.64 -4.72*** -5.15 -4.29 0.99
1982-1989 b) 1.57*** 1.25 1.89 -4.78*** -6.44 -3.12 0.95
1990-1997 b) 1.65*** 1.45 1.84 -5.20*** -6.27 -4.12 0.98
public 1981-1997 1.25*** 1.18 1.31 -2.58*** -2.94 -2.23 0.99
1982-1989 b) 1.26*** 1.12 1.40 -2.65*** -3.41 -1.90 0.99
1990-1997 b) 1.49*** 1.19 1.78 -3.89*** -5.48 -2.29 0.96
a) OLS-Regressions according to model 1;
b) in order to have symmetric periods to compare, seven year intervals were chosen.
*** p≤0.001
Source: Central Statistical Office, December 1998, IHS HealthEcon-calculations1999.
15 By using the deflator for Austrian health care expenditure, we see that elasticity ranged between 0.63 and 0.86 (within a 95% confidence limit) which means that real health spending rose degressively in relation to real GDP per capita. With regard to an increase in services performed, a variety of new goods and services, as well as a steadily rising life expectancy, these results contradict every experience made so far. In an OECD cross-sectional study of 18 countries (1987) elasticity of real health spending amounted to 1.6%. OECD: Financing and delivering Health Care (1987), Paris.
I H S — Maria M. Hofmarcher / Cross-Section Analysis of Health Spending — 15
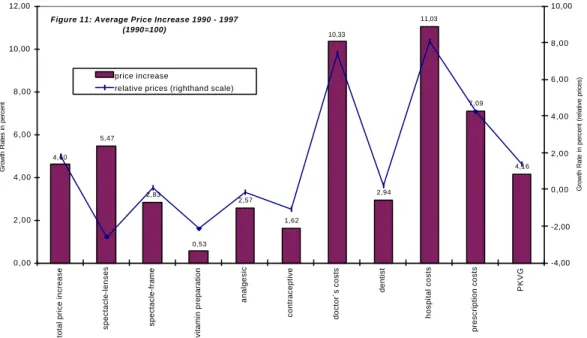
Figure 11 shows the increase in the Austrian health care system’s prices split up into the individual components of the index. The costs for hospital treatment and the fees of physicians rose strongest tightly followed by prescription charges and the costs for new glasses. It is generally assumed, however, that the rise in the Austrian health care system’s prices is overestimated16 since the individual factors of the price index only paint a rather selective picture of the real situation. The reason for this overestimation of prices is that the deflator reflects a trend in fees rather than market prices. It is furthermore assumed that certain measures of deregulation led to an increased competition in some fields of the health care system and thus provoked a decrease in prices in the 90s. From 1994 this development again stimulated the demand and in consequence also the consumption of health care services. It has to be taken into account, though, that even if the index is distorted and the fees do not represent market prices they may comprise monopoly rents which lead to an increase in prices and thus negatively affect welfare. Recent debates on the charges for dental crowns show that the recommended price which was finally agreed upon is way beyond an equally realistic but less profitable price.
16 According to information disseminated by the Central Statistical Office on June 8, 1998, price trends in health care were particularly overestimated from 1981 to 1989. Between 1990 and 1996 the real effect probably dominated the price effect. The hypothesis thus is that prices sank and turnover rose within this period because more money was spent on health care services.
Figure 11: Average Price Increase 1990 - 1997 (1990=100)
4,60 5,47
2,83
0,53 2,57
1,62 10,33
2,94 11,03
7,09
4,16
0,00 2,00 4,00 6,00 8,00 10,00 12,00
total price increase spectacle-lenses spectacle-frame vitamin preparation analgesic contraceptive doctor´s costs dentist hospital costs prescription costs PKVG
Quelle: Central Statistical Office, June 1998, IHS-HealthEcon calculations 1999
Growth Rates in percent
-4,00 -2,00 0,00 2,00 4,00 6,00 8,00 10,00
Growth Rate in percent (relative prices)
price increase
relative prices (righthand scale)
I H S — Maria M. Hofmarcher / Cross-Section Analysis of Health Spending — 16
6 Conclusion: The health care system will expand further
The increase in the health care system‘s price indices17 beyond the rise in the overall economic price indices is usually explained by the fact that the system’s productivity generally improves on a slower rate than overall economic productivity. This trend in turn is due to the fact that the health care system forms part of the service sector. If the service sector improves to a lesser extent than the economy as a whole, relative prices will rise over time. Consequently, expenditure will increase since the demand for health care services is rather insensitive to price changes – a fact that at least holds true for the main fields of health care that constitute more than 60% of overall health care spending. It is particularly difficult to ascertain improvements in productivity in the field of health care, because it is nearly impossible to measure the “final output“. It is, however, rather illogical to assume that productivity has not been improved in our health care system’s main branches, for example in acute care. It is far more likely, though hard to measureable, that productivity in health care has risen. If the quality of treatment is improved, it has only slight effects on the price indices. Therefore, it will be even more important in future to study factor flow and factor prices over a period of time, as well as to reasonably measure productivity with respect to output, i. e., to ascertain real effects of rapid product as well as process innovations in the health care sector.
17 Apart from the general level of prices, real income per capita, the use of technological innovations and the percentage of people over 65, the density of physicians was identified as a determinant in a recent study. This new factor, however, correlated negatively with the increase in prices. In consequence, we might suppose that the density of physicians does not simulate demand, as has been generally assumed so far, but that increased supply leads to a decrease in prices charged for medical treatment. Cebula, R. J.: Determinants of the inflation rate of the health care CPI in the US, Applied Economic Letters 5 (1998), p. 47-49.
I H S — Maria M.Hofmarcher / Cross-section analysis of health spending — 17
Table A1 GROSS NATIONAL PRODUCT PER CAPITA EU-15=100
Purchasing power parities expressed in U.S. dollars
1990 1991 1992 1993 1994 1995 1996 1997 1998 1990 1991 1992 1993 1994 1995 1996 1997 1998 Austria 16712 17576 18581 19190 20036 20618 21965 22789 22262 1998 110 111 111 110 109 111 110 109 Belgium 16668 17538 19011 19699 20577 21107 21986 22902 22452 110 110 113 114 113 111 111 110 110 Denmark 16557 17497 18096 19169 20419 21479 22669 23874 22679 109 110 108 111 112 113 114 115 111 Germany 14626 17070 18453 18558 19747 20466 21622 22385 21741 96 107 110 108 109 108 109 108 107 Finland 16203 15540 14868 15636 16330 17911 18634 19821 19814 107 97 89 91 90 94 94 96 97 France 17358 18244 19003 18684 19279 19909 20464 21290 20695 114 114 113 108 106 105 103 103 101 Greece 9187 9829 10680 11047 11700 12222 13143 13805 13608 60 62 64 64 64 64 66 67 67 Great Britain 15907 15758 16600 16881 17558 17865 19055 20139 19669 105 99 99 98 97 94 96 97 96 Ireland 11378 12149 13465 14255 15713 17198 18190 18875 20245 75 76 80 83 87 91 92 91 99 Italy 16257 17198 18099 17717 18682 19460 20236 20914 20069 107 108 108 103 103 102 102 101 98 Luxemburg 22809 24382 26523 28176 30178 31206 31677 33089 32679 150 153 158 163 166 164 160 160 160 Netherlands 15926 16517 17424 17854 18838 19852 20481 21450 20964 105 104 104 104 104 105 103 103 103 Portugal 9372 10167 10889 11431 12042 12457 12963 13672 14095 62 64 65 66 66 66 65 66 69 Sweden 17011 16898 16908 16824 17543 18727 19419 20150 19528 112 106 101 98 97 99 98 97 96 Spain 11856 12873 13287 13440 13743 14318 15162 15800 15593 78 81 79 78 76 75 76 76 76
EU-15§ 15188 15949 16792 17237 18159 18986 19844 20730 20406 100 100 100 100 100 100 100 100 100 EU-EURO§ 15379 16296 17237 17695 18651 19500 20307 21181 20964 101 102 103 103 103 103 102 102 103
Switzerland 21223 21770 22829 23498 24173 24992 24608 25088 * 140 136 136 136 133 132 124 121 * USA 22224 22605 23600 24551 25764 26711 27821 29195 * 146 142 141 142 142 141 140 141 *
Estonia n.v. 8819 7283 6750 6697 7057 7407 8251 * * 55 43 39 37 37 37 40 *
Poland 5089 4718 4828 5000 5242 5565 5866 6271 * 34 30 29 29 29 29 30 30 *
Slovenia 11878 10896 10333 10500 11087 11704 12308 12776 * 78 68 62 61 61 62 62 62 * Czech Republic 10027 8825 8268 8200 8414 8759 9184 9193 * 66 55 49 48 46 46 46 44 *
Hungary 7471 7224 6375 6200 6400 6558 6789 7088 * 49 45 38 36 35 35 34 34 *
MOEL-5§ 8616 8096 7417 7330 7568 7929 8311 8716 * 57 51 44 43 42 42 42 42 *
§ unweighed average.
Sources: OECD-Health Data 1998, data for central and eastern european countries (MOEL-5): Nationale Statistics, WHO Health for All Database 1999, GDP 1998: Eurostat:
I H S — Maria M.Hofmarcher / Cross-section analysis of health spending — 18
table agc01u16 ESVG-Aggregate zu jeweiligen Preisen - in $PPP, IHS-HealthEcon calculations 1999.