Dielectric Wakefield Acceleration of a Relativistic Electron Beam in a Slab-Symmetric Dielectric Lined Waveguide
G. Andonian,
1D. Stratakis,
1M. Babzien,
2S. Barber,
1M. Fedurin,
2E. Hemsing,
3K. Kusche,
2P. Muggli,
4B. O’Shea,
1X. Wei,
1O. Williams,
1V. Yakimenko,
2and J. B. Rosenzweig
11
Department of Physics and Astronomy, UCLA, Los Angeles, California 90095, USA
2
Accelerator Test Facility, Brookhaven National Laboratory, Upton, New York 11973, USA
3
SLAC National Accelerator Laboratory, Menlo Park, California 94025, USA
4
Max-Planck-Institut fu¨r Physik, Munchen, Germany (Received 12 October 2011; published 15 June 2012)
We report first evidence of wakefield acceleration of a relativistic electron beam in a dielectric-lined slab-symmetric structure. The high energy tail of a
!60 MeVelectron beam was accelerated by
!150 keVin a 2 cm-long, slab-symmetric
SiO2waveguide, with the acceleration or deceleration clearly visible due to the use of a beam with a bifurcated longitudinal distribution that serves to approximate a driver-witness beam pair. This split-bunch distribution is verified by longitudinal recon- struction analysis of the emitted coherent transition radiation. The dielectric waveguide structure is further characterized by spectral analysis of the emitted coherent Cherenkov radiation at THz frequencies, from a single electron bunch, and from a relativistic bunch train with spacing selectively tuned to the second longitudinal mode (TM
02). Start-to-end simulation results reproduce aspects of the electron beam bifurcation dynamics, emitted THz radiation properties, and the observation of acceleration in the dielectric-lined, slab-symmetric waveguide.
DOI:10.1103/PhysRevLett.108.244801 PACS numbers: 41.75.Lx, 41.60.Bq
In recent years, there has been ever-increasing research into the use of large amplitude wakefields driven in dielec- tric waveguide structures [1]. This interest is propelled by a variety of compelling applications, such as ultrahigh gra- dient dielectric wakefield acceleration (DWA) schemes in future high-energy physics linear colliders, and narrow band, high power THz generation (termed coherent Cherenkov radiation, or CCR). There has been rapid ex- perimental progress that has demonstrated > GV=m field breakdown thresholds in wake-driven dielectric structures [2], as well as line-spectra from CCR, tuned by either exchange of dielectric structures [3], or by specific excita- tion of harmonics in the structure through use of electron beam pulse trains [4].
These recent advances have occurred in the context of cylindrical dielectric-lined waveguides, as this simple ge- ometry maximizes the coupling of the beam, which must be well-focused, have high total charge Q, and short lon- gitudinal extent !
z. Under the condition that the inner radius of the structure a be similar in size to !
z, the wake mode wave number scales as k
m’ !
m=c / a
"1, and the single bunch collective wakefield is proportional to (in cgs units) Qk
2m’ Q=!
"z2[5,6]. This scaling illus- trates the connection between small dimensions in both the beam and the structure, and in achieving high fields. Given the current state of the art in electron beam generation and manipulation, to arrive at GV=m fields it is natural for a DWA to operate in the THz regime, which is fortuitous for enabling unique and powerful CCR sources in this spectral region. The need to operate at high frequency to reach a
large wakefield amplitude implies that one may not natu- rally accelerate large charge trailing beams in two-beam DWA schemes, as the structure does not store a large amount of energy per unit length. This problem is consid- ered in terms of longitudinal beam loading of the structure as the permitted charge Q / k
"m1. The scaling of transverse wakefields, which provoke both short and long range beam breakup instabilities, is even more dramatic, being propor- tional to k
2m, strongly limiting the employable charge.
In order to evade such limitations in the context of both wakefield accelerators and laser-fed structures, it has been proposed to use slab-symmetric structures in which the structure is very wide (much larger than the mode wave- length "
m¼ 2#=k
m) in one direction (e.g., x); it is under- stood that the beam should also be very wide (ribbon-like,
!
x$ !
y) [7,8]. Under these circumstances the amount of charge accelerated may be expanded by the ratio of the structure width in x (L
x) over the cylindrical transverse size a. Further, it was noted theoretically that in slab symmetry, in the limit that !
x$ "
m, the net transverse wakefield vanishes [9,10]. With such advantages, slab-symmetric geometries have been studied for potential application in linear colliders and advanced light sources. Note that this geometry is particularly suitable for linear colliders that naturally require flat beams. This Letter presents the first experimental tests of such DWA structures, in which slab- symmetric quartz-lined waveguides are excited by both single electron beam pulses and multiple-pulse trains.
The wakefields are probed by measurement of change in
momentum spectrum induced by beam passage through the
slab DWA, as well as the characteristic mode frequencies of the CCR launched from the quasioptical horn at the end of the waveguide.
The experiment was conducted at the Brookhaven National Laboratory Accelerator Test Facility (BNL ATF). The electron beam employed at the BNL ATF has a mean energy of E ¼ 59 MeV, normalized emittance
$
n¼ 2 mm-mrad, pulse length !
t’ 4 ps and total Q vari- able from 500–900 pC depending on the specific measure- ment pursued. In addition, the BNL ATF has the capability to produce pulse trains (with spacing variable from 150–600 %m) created by temporal slicing of the beam.
For the set of measurements described here, the beam was operated at negative energy-time chirp (beam tail with greater energy than beam head) by accelerating approxi- mately 7
%forward of crest (peak accelerating field in the linac). This negative chirp operation allows for unambig- uous observation of the growth in the momentum spectrum width as the beam tail samples the accelerating field gen- erated by the bunch.
After acceleration in the linac, the electron beam is transported through a dispersive line, where sextupole corrector magnets are used to linearize the second-order chromatic effects. A coherent transition radiation (CTR) diagnostic [11,12] is used to determine the beam’s longi- tudinal profile (closely reproduced by the CTR pulse itself ) and characterize the frequency spacing in multi-bunch applications. The diagnostic station consists of a retract- able thin foil to generate the CTR, and a Michelson-like THz interferometer with a liquid He-cooled Si bolometer detector that enables measurement of the autocorrelation of the emitted radiation. The autocorrelation data are analyzed using a Kramers-Kronig algorithm for bunch profile characterization including multi-pulse spacing determination.
Once the beam is characterized at the CTR station [Figs. 2(a) and 2(b)], it is transported to the DWA slab structure for wakefield measurements. As the beam traver- ses the structure, CCR is emitted; this radiation is trans- ported to a detector and analyzer setup by quasioptical methods, beginning with a flared rectangular launching horn, a Au-coated mirror and subsequent collimating op- tics (off-axis paraboloid mirrors). The radiation is collected by the initial mirror, which has a 5 mm hole drilled through its center line. The hole allows the electron beam to pass through to a beam dump, which incorporates a dipole spectrometer for momentum spectrum measurements.
The transported CCR is ultimately focused into a second Michelson interferometer and autocorrelated. The Fourier- analysis of the autocorrelation is used to confirm the reso- nant longitudinal modes (TM
0n-like modes) of the waveguide.
The DWA structures are nearly slab-symmetric dielec- tric lined waveguides, schematically represented in Fig. 1.
The dielectric material is SiO
2with a permittivity of 3.8.
The upper and lower slab thicknesses are 240 & 5 %m, with a gap of 240 & 5 %m maintained by insertion of an equivalent thickness slab 2 cm away from the beam center.
The outer surfaces of the slabs are coated with aluminum and are mounted in a custom holder which incorporates a radiation horn with flare angles of 12
%. The DWA structure is 2 cm long, which gives enough wakefield interaction (at 10 MV=m maximum) to unequivocally demonstrate accel- eration in the beam. The structure is mounted on a remote controlled 3-axis optical harness to allow for in situ align- ment without disturbing electron beam operations. The alignment of the slab structure to the beam was optimized with a local alignment HeNe laser, focused down to a
’ 50 %m diameter and translated horizontally to confirm alignment across the inner surfaces. The elliptical beam (!
x¼ 250 %m) was fully transmitted through the struc- ture gap.
For 3D slab symmetric structures, a combination of longitudinal-section electric (LSE) and longitudinal- section magnetic (LSM) modes are excited [13]; however, for large height or length aspect ratios, the structure can be approximated in the 2D limit, where the LSM modes dominate. In this 2D regime, the modes can be expressed as TM
0nmodes. For the structure discussed here, the aspect ratio is greater than 150, allowing us to express the modes in the 2D limit, and refer to them as TM
0n, or more accurately as TM
0n-like [7].
The initial experimental step involves characterization of the symmetric longitudinal modes of the structure that couple most strongly to the beam. At THz frequencies, beam-based resonant mode excitation, with subsequent quasioptical autocorrelation, gives a robust method to ex- perimentally confirm the frequency spectrum of the DWA structure’s accelerating modes. This excitation is per- formed either by use of a single bunch, where only the fundamental wavelength TM
01("
01¼ 1800 %m) is coher- ently excited by the beam current’s spectral distribution, or by use of a pulse train to characterize the structure’s higher order longitudinal modes. Analytical treatments, con- firmed with
OOPIC[14] simulations, show that the next
e-beam ba
L
FIG. 1 (color online). The slab used in the experiment is
schematically represented (not too scale). The half gap is given
by
a¼120%m, the dielectric thickness isðb"aÞ ¼240 %m,and the total length is
L¼2 cm. The gap is vacuum, thedielectric is
SiO2, and the outer conductor is aluminum. The
two
SiO2support slabs (not pictured) are
>2 cmaway from
beam center along the symmetry plane (dashed line).
two higher longitudinal modes (approximated to TM
02and TM
03) for the structure are "
02¼ 600 %m (0.5 THz) and
"
03¼ 355 %m (0.843 THz).
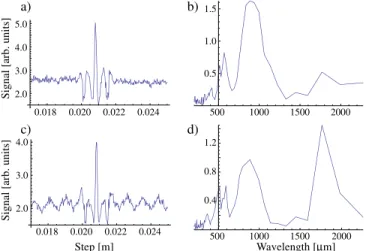
Using the methods described in Ref. [4], the modes were characterized using both an unmodulated relativistic electron beam, as well as a beam configured into a pulse train having the same repetition frequency as the second longitudinal mode. First, a single, relatively long pulse approximately ! 4 ps (!
z¼ 1200 %m) was propagated through the DWA structure, which contains frequency ele- ments that are too low to excite higher order longitudinal modes [Figs. 2(a) and 2(b)]. The emitted CCR from this single pulse was analyzed [Figs. 2(c) and 2(d)]. In this spectral region, the radiation spectrum showed the expected peak at "
01¼ 1:8 mm [Fig. 2(d)]. It also included signs of coherent diffraction radiation (CDR), as seen from the peak at 900 %m in Fig. 2(d), which are attributed to limited clearance through nearby apertures. The CDR spec- trum was directly studied with the DWA retracted from the beam line under identical beam charge, energy, and energy chirp conditions to provide a reference baseline and system- atic considerations [Fig. 2(b)]. This CDR emission was autocorrelated and frequency analyzed; the Fourier analysis of the CDR signal displays detailed information about the spectrum of the beam current itself, giving results compa- rable to the CTR measurement system.
The CTR spectrum obtained from autocorrelation is treated using a Kramers-Kronig (minimal phase assump- tion) approach to reconstruct the longitudinal bunch profile [15]. Our specific approach uses an apodization function to filter low frequency components in the measured radiation spectrum, with resultant reconstruction of the longitudinal
profile optimized using a multi-Gaussian fit. The result of this analysis is given in Fig. 3. This procedure reveals that the beam is split into two components, with a smaller peak trailing the core of the beam. We shall see below that this profile optimally allows for the observation of acceleration, as the trailing peak may serve as a witness beam at the correct phase in the wake for acceleration.
Second, the DWA structure was further characterized by examining the second resonant mode (TM
02) using a pulse train with spacing equal to "
02. The pulse train is generated by a comb-collimation technique, in which a partially intercepting mask is placed at a high momentum dispersion point along the transport [16]. Using the beam longitudinal position-energy correlation (chirp) imparted in the linac, in tandem with sextupole correction of dynamical nonlineari- ties [4,17], the pulse train periodicity may be tuned in the range 150–600 %m.
The second mode of the dielectric waveguide (TM
02) lies within the operating parameters of the pulse train generation at the BNL ATF, and thus could be excited with this method to further ascertain the electromagnetic characteristics of the waveguide. Fig. 4 shows the autocor- relation of the CCR emitted from the DWA structure excited by a three pulse train with spacing of ! 600 %m.
The resultant Fourier transform shows a sharp peak at
! 590 %m, corresponding well with the expected second longitudinal resonant (TM
02-like) mode, and confirming the analytical estimates and simulation results.
Mirror Position [mm]
-3 -2 -1 0 1 2 3
0.0 -0.5 0.5 1.0
Signal [arb. units]
0 500 1000 1500
0 50 100 150
z [µm]
Current [Αmp]
FIG. 3 (color online). Top: The autocorrelation of the pro- cessed CTR signal (solid), superimposed with an apodization window (dashed) and the first-order Gaussian fit (solid Gaussian envelope). Beam charge (dotted) is nearly constant and moni- tored to ensure stability throughout the autocorrelation measure- ment. Bottom: The reconstruction of the bunch profile using the minimum phase assumption retrieval technique.
500 1000 1500 2000
0.5 1.0 1.5
2000
500 1000 1500
0.4 0.8 1.2
Wavelength [µm]
0.018 0.020 0.022 0.024 2.0
3.0 4.0
Step [m]
Signal [arb. units]
0.018 0.020 0.022 0.024 2.0
3.0 4.0 5.0
Signal [arb. units]
a) b)
c) d)
FIG. 2 (color online). (a) CTR autocorrelation trace of the long electron bunch (!
z¼1200%m) and (b) its Fourier transform.(c) Raw autocorrelation and (d) Fourier transform for CDR and CCR emitted by the beam going through the slab DWA structure.
The peak at
1800%mis indicative of the fundamental
TM01mode, evident in (d) and absent in (b). The structure in (a) and
(b) indicates the presence of a bifurcated beam at approximately
900%m.The coherent radiation measurements described above serve to both benchmark our analytical and computational models of the DWA accelerating mode structure, and to reveal the details of the unmodulated beam’s longitudinal profile. Both of these inputs are essential to understanding the beam energy spectral measurements performed down- stream of the DWA interaction. These measurements are performed at a calibrated dipole spectrometer (Fig. 5). The spectrum obtained with the DWA slab structure removed from the beam path gives the injected energy distribution, which is used along with the above-described current profile measurement to give two projections of the longi- tudinal phase space. These projections are then used to constrain the input longitudinal phase space in
PARMELAsimulations [18]; the current profile obtained from such simulations is shown in Fig. 5.
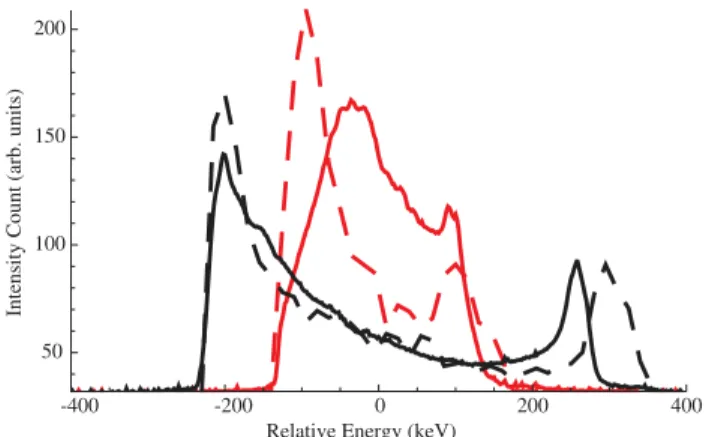
The final momentum spectrum of the 4 ps beam, after the DWA interaction, is displayed in Fig. 5. The core of the beam is decelerated, while the peak that trails the core by ! "
01=2 (and thus changes sign) is accelerated by over
150 keV in 2 cm. Here the relevant beam parameters used in simulation for charge and horizontal beam size are Q ¼ 0:55 nC and !
x¼ 250 %m, respectively, in addition to the measured longitudinal phase space characteristics. This is consistent with the final component of the start-to-end simulation model, which employs
OOPIC[14] in 2D slab (Cartesian) mode, and takes as input the measured charge, transverse sizes and (benchmarked) longitudinal phase space. While this model does not contain 3D effects (i.e., variation in the x direction), the results of the calculation, (Fig. 5) are in good agreement with the experimental results. This successful comparison is likely due to dif- fractive effects in the wake propagation that allow spread- ing and homogenization of the fields in x.
In conclusion, we have presented first experimental tests of slab-symmetric DWA structures. Using specialized techniques in electron beam manipulation and diagnosis, in tandem with methods that exploit coherent electromag- netic radiation from such beams, we have characterized important aspects of the wakefield response in these sys- tems. The main results include a verification of the first two longitudinal accelerating modes of the structure, and demonstration of acceleration and deceleration that took advantage of a split-pulse structure. These interconnecting results have enabled development of a well-benchmarked, sophisticated start-to-end computer model that reproduces the acceleration or deceleration results well. This demon- stration of dielectric wakefield acceleration in a slab structure using elliptical beam distributions is a key mea- surement in the experimental series [2–4], as it allows for higher charge operation while avoiding transverse insta- bility and material breakdown issues. Near future work to follow at the nascent FACET facility at Stanford is planned that will explore slab structures at high (up to breakdown- level) fields. These experiments will also employ novel materials such as chemical vapor deposition diamond, and structures, e.g., the use of Bragg mirrors instead of metal walls to provide mode confinement.
This work supported by U.S. Department of Energy Contracts No. DE-FG02-07ER46272, No. DE-FG03- 92ER40693, No. DE-FG02-92ER40745, Office of Naval Research Contract No. ONR N00014-06-1-0925 and DARPA Contract No. N66001-11-4197.
[1] W. Gai, P. Schoessow, B. Cole, R. Konecny, J. Norem, J.
Rosenzweig, and J. Simpson, Phys. Rev. Lett.
61, 2756(1988).
[2] M. Thompson, H. Badakov, A. Cook, J. Rosenzweig, R.
Tikhoplav, G. Travish, I. Blumenfeld, M. Hogan, R.
Ischebeck, and N. Kirby et al., Phys. Rev. Lett.
100,214801 (2008).
[3] A. M. Cook, R. Tikhoplav, S. Y. Tochitsky, G. Travish, O. B. Williams, and J. B. Rosenzweig, Phys. Rev. Lett.
103, 095003 (2009).
0.018 0.020 0.022 0.024 2
3 4 5
Signal [a.u.]
step [m]
1 200 400 600 800 1000 1200
1.0 2.0 3.0
Wavelength [µm]
FIG. 4 (color online). Autocorrelation of the emitted coherent Cherenkov radiation of the beam passing through the slab waveguide (left) and the frequency spectrum of the autocorre- lation (right). A peak at
!590%mis evident, confirming the resonant excitation of the
TM02-like mode of the structure.
-400 -200 0 200 400
Relative Energy (keV) 50
100 150 200
Intensity Count (arb. units)
FIG. 5 (color online). Measured energy spectra of the drive or witness bunches without the DWA structure (solid red) and with the DWA structure (solid black). An energy gain (loss) of about 150 keV is observed for the high energy tail (low energy core) of the beam. The input energy distribution prior to DWA from
PARMELA
(dashed red) and the final energy distribution from
OOPIC