Decreased GLUT 1 /NHE 1 RNA expression in whole
blood predicts disease severity in patients with COVID ‐ 19
Julian Mustroph1*††, Julian Hupf2††, Frank Hanses2,3, Katja Evert4, Maria J. Baier1, Matthias Evert4, Christine Meindl1, Stefan Wagner1, Ute Hubauer1, Gabriela Pietrzyk1, Simon Leininger1, Stephan Staudner1, Manuel Vogel1, Stefan Wallner5, Markus Zimmermann2, Samuel Sossalla1, Lars S. Maier1††and Carsten Jungbauer1††
1Department of Internal Medicine II (Cardiology), University Hospital Regensburg, Franz‐Josef‐Strauß‐Allee11, Regensburg,93053, Germany;2Emergency Department, University Hospital Regensburg, Regensburg, Germany;3Department of Infection Prevention and Infectious Diseases, University Hospital Regensburg, Regensburg, Germany;
4Institute of Pathology, University Hospital Regensburg, Regensburg, Germany;5Department of Clinical Chemistry and Laboratory Medicine, University Hospital Regensburg, Regensburg, Germany
Abstract
Aims We aimed to assess whether expression of whole‐blood RNA of sodium proton exchanger1(NHE1) and glucose trans- porter1(GLUT1) is associated with COVID‐19infection and outcome in patients presenting to the emergency department with respiratory infections. Furthermore, we investigated NHE1and GLUT1expression in the myocardium of deceased COVID‐19 patients.
Methods and results Whole‐blood quantitative assessment of NHE1and GLUT1RNA was performed using quantitative PCR in patients with respiratory infection upon first contact in the emergency department and subsequently stratified by SARS‐ CoV‐2infection status. Assessment of NHE1and GLUT1RNA using PCR was also performed in left ventricular myocardium of deceased COVID‐19patients.
NHE1expression is up‐regulated in whole blood of patients with COVID‐19compared with other respiratory infections atfirst medical contact in the emergency department (control:0.0021±0.0002, COVID‐19:0.0031±0.0003,P=0.01). The ratio of GLUT1to NHE1is significantly decreased in the blood of COVID‐19patients who are subsequently intubated and/or die (severe disease) compared with patients with moderate disease (moderate disease:0.497±0.083vs. severe disease:0.294±0.0336, P=0.036). This ratio is even further decreased in the myocardium of patients who deceased from COVID‐19in comparison with the myocardium of non‐infected donors.
Conclusions NHE1and GLUT1may be critically involved in the disease progression of SARS‐CoV‐2infection. We show here that SARS‐CoV‐2infection critically disturbs ion channel expression in the heart. A decreased ratio of GLUT1/NHE1could po- tentially serve as a biomarker for disease severity in patients with COVID‐19.
Keywords COVID‐19; Infection; Heart; GLUT1; NHE1
Received:23July2020; Revised:9September2020; Accepted:25September2020
*Correspondence to: Julian Mustroph, Department of Internal Medicine II, University of Regensburg, Franz-Josef-Strauß-Allee11, Regensburg93053, Germany. Tel.: +49- 941-9442725. Email: julian.mustroph@ukr.de
†Thefirst and last authors contributed equally to this publication.
[Correction added on5December2020, afterfirst online publication: Projekt Deal funding statement has been added.]
Introduction
In the current SARS‐CoV‐2 pandemic, markers of increased risk for progression to severe disease are urgently needed to allocate limited healthcare resources to patients who need them most.
Furthermore, it is important to identify baseline medica- tion that could be harmful (or beneficial) for patients with SARS‐CoV‐2 infection. The ion transporter sodium proton exchanger 1(NHE1) is an important regulator of cellular pH in many tissues and is involved in the cellular response to stress, such as inflammation and infection.1,2 Additionally, Published online in Wiley Online Library (wileyonlinelibrary.com)DOI:10.1002/ehf2.13063
the glucose transporter 1(GLUT1) is a critical glucose trans- porter in many tissues, especially the heart.3
It has previously been shown that inhibitors of sodium– coglucose transporter 2 (SGLT2 inhibitors) may exert their beneficial effects directly on the heart via inhibition of NHE1,4,5as SGLT2is not present in the heart.6 Additionally, our working group has shown recently in that gliflozins in- crease myocardial expression of GLUT1, thus increasing glu- cose uptake into cardiomyocytes7 while also altering myocardial sodium homoeostasis.6 Furthermore, expression and activity of NHE1have been shown to be affected by hyp- oxia and glucocorticoid levels, among others, via serum and glucocorticoid‐inducible kinase1(Sgk1).8,9It has been shown that GLUT1activity (but not expression) is also stimulated by Sgk1.10Also, regulation of cellular pH is dependent on both GLUT1 expression and NHE1‐expression.11 Interestingly, in the kidney, both low and high sodium levels can alter GLUT1 expression,12 and NHE1‐deficient mice show strongly in- creased cardiac GLUT1expression.13As such, it is reasonable that GLUT1and NHE1expression could be directly linked. We aimed to assess if SARS‐CoV‐2 infection altered the expres- sion profile of these important cellular transporters in the blood of patients with COVID‐19. Furthermore, as COVID‐19 has been shown to affect cardiac function as well, we also in- vestigated NHE1and GLUT1expression in the myocardium of deceased COVID‐19patients.
We present data from our ongoing prospective clinical ob- servational study investigating COVID‐19 patients at initial presentation to the emergency department (ED). We report on whole‐blood quantitative assessment of NHE1and GLUT1 RNA using quantitative PCR (qPCR).
Methods
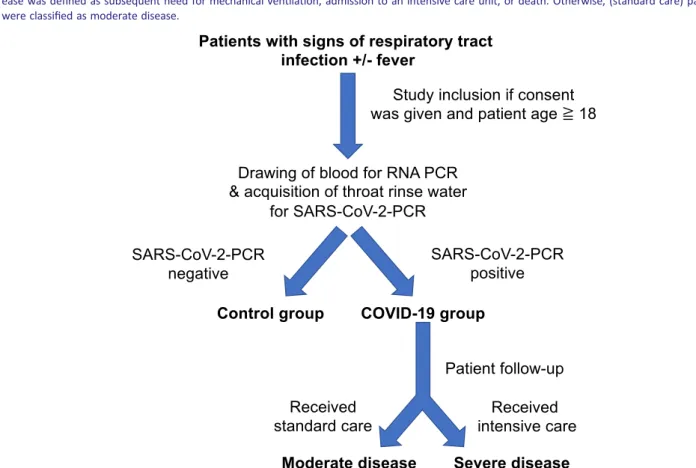
Patients were included in the study if they presented with signs of acute respiratory infection to the ED. Pre‐specified in- clusion criteria were age≥18years and signs of acute respi- ratory infection, possibly COVID‐19. As all SARS‐CoV‐2‐
positive patients reported symptomatic illness, the term COVID‐19 is used synonymously for these patients. In this study, we first included all patients with suspected COVID‐19 (defined by respiratory tract infection ± reported fever). Patients were then tested for SARS‐CoV‐2infection.
The patients with negative SARS‐CoV‐2test result, who pre- sented themselves with viral or bacterial respiratory tract in- fection, were used as control group.
Pre‐specified exclusion criteria were withdrawal of consent or patients unable to consent and delay of life‐saving diag- nostic or therapeutic procedures by inclusion into the study (which did not occur in this study cohort). Researchers in- volved in the qPCR analysis were blinded with respect to group allocation/SARS‐CoV‐2 test status. As some patients
were referred to our hospital ED from general practitioners with existing COVID‐19 diagnosis, nurses and physicians drawing blood and taking clinical data could not always be blinded to SARS‐CoV‐2status, also for personnel safety con- siderations. However, all patients included into the study were treated equally with regard to diagnostic testing, timing of the testing, and safety precautions. The current study was approved by the Ethics Committee of the University of Re- gensburg. Informed consent was obtained from all patients.
After consent, clinical baseline characteristics and vital signs were documented for each patient. Furthermore, out- come and complications during hospital stay were assessed.
Severe disease was defined as subsequent need for mechan- ical ventilation, admission to an intensive care unit, or death.
Otherwise, patients were classified as moderate disease. An overview of inclusion procedures and patient stratification can be found inFigure1.
For qPCR analysis, patient blood was drawn by venepuncture from each consenting patient immediately after admission to the ED and inactivated using Trifast (Ambion, Waltham, MA, USA). RNA was extracted using trichloromethane–chloroform solution and isopropanol solu- tion. RNA was purified using the RNeasy Plus Mini Kit (Qiagen, Venlo, Netherlands) and transcribed to cDNA. Quantitative analysis of NHE1 and GLUT1 RNA was performed using the respective primer (NHE1: Hs00300047_m1, GLUT1: Hs00892681_m1, Applied Biosystems, Waltham, MA, USA) on a TaqMan apparatus (Applied Biosystems), and expression was normalized toβ‐actin or GAPDH (β‐actin: Hs00357333_g1, GAPDH: Hs02786624_g1, Applied Biosystems). An extended description of the methodology can be found in the Supporting Information. We chose whole‐blood analysis for its easy applicability, requiring no separation stages of cells or plasma, and for safety considerations, as SARS‐CoV‐2can easily be inactivated using Trifast without opening the blood tubes, thus avoiding potentially hazardous aerosol generation.
To strengthen our RNA data from whole blood of patients with COVID‐19, we also obtained left ventricular cardiac tis- sue from patients who died of COVID‐19 and analysed NHE1and GLUT1RNA in this cardiac tissue. Because of ethical and legal concerns, these deceased patients were not all from our ED study. However, infection had been verified by PCR from respiratory material in all of these patients, and all pa- tients had symptomatic illness, which was determined to be the cause of death. As control tissue is extremely rare, we used a combination of left ventricular tissues from patients who had died from other respiratory infections or from pa- tients whose hearts were destined for heart donations that ultimately could not be performed. No clinical data are avail- able regarding the control group. Of note, there was no dif- ference between the entities comprising the control group.
As we had better experience with using GAPDH as a house- keeper for NHE1 in cardiac tissue, we used this instead of β‐actin for NHE1; however, to exclude this as confounder,
wefirst analysed the ratio of GAPDH andβ‐actin and found no significant difference (data not shown).
For SARS‐CoV‐2 testing, our facility mainly tested throat rinse water by PCR, but external test facilities also used throat swabs and sputum, which was accepted for our study if performed by a certified laboratory.
For statistical testing, normality was tested using the Kolmogorov–Smirnov test. For data with normal distribution, a Student’st‐test was performed in case of two groups with- out pairing. When testing multiple groups, an ANOVA was performed. For data for which normality could not be as- sumed, a Mann–Whitney U test was performed in case of two groups without pairing. Otherwise, a Kruskal–Wallis test was used. The respective post‐tests adjusting for multiple testing are referenced in thefigure legends. Categorical data were tested using Fisher’s exact test. The significance level was taken to 5% (two‐sided P). Data are presented as mean ± SEM, if not otherwise indicated. No data were ex- cluded from the analysis.
Statistics were performed using GraphPad Prism v8 (GraphPad Software, San Diego, CA, USA) and SPSS26. Orig- inal data can be made available in a blinded manner upon reasonable request.
Results
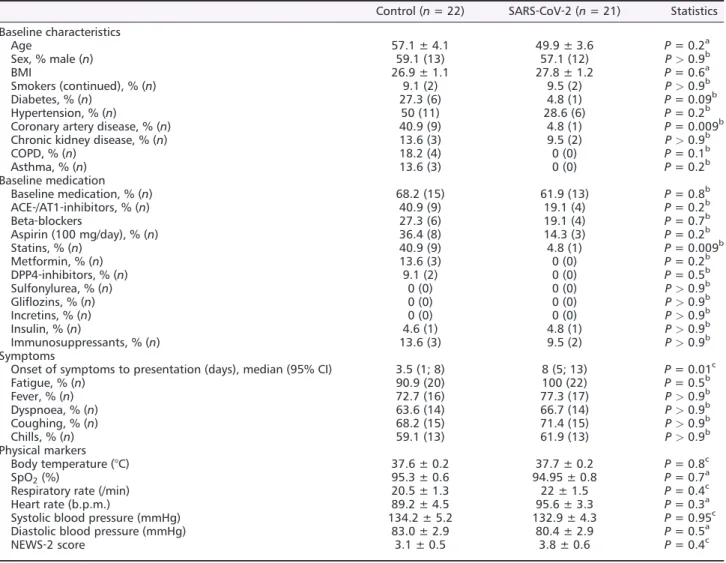
For this study,43 patients were included in our analysis of whole‐blood RNA. In 21 of these patients (48.8%), SARS‐ CoV‐2 infection could be confirmed. Clinical characteristics of these patients can be found inTable1.
Patients in the study were mostly male, and the mean age was53.6years, which was not significantly different between patients with confirmed SARS‐CoV‐2 infection and control.
Body mass index was increased but similar in both groups.
The median time from symptom onset to presentation in the ED differed significantly between the SARS‐CoV‐2positive
Figure1 Overview of trial design. Patients were included in the study if they presented with signs of acute respiratory infection to the emergency department. Pre‐specified inclusion criteria were age≥18years and signs of acute respiratory infection. We included all patients with suspected COVID‐19(defined by respiratory tract infection ± reported fever). For quantitative PCR analysis, patient blood was drawn by venepuncture from each consenting patient immediately after admission to the emergency department. Patients were then tested for SARS‐CoV‐2infection. The patients with negative SARS‐CoV‐2test result, who presented themselves with viral or bacterial respiratory tract infection, were used as control group. After con- sent, clinical baseline characteristics and vital signs were documented, and outcome and complications during hospital stay were assessed. Severe dis- ease was defined as subsequent need for mechanical ventilation, admission to an intensive care unit, or death. Otherwise, (standard care) patients were classified as moderate disease.
cohort and the control group. Clinical symptoms, vital signs, or National Early Warning Score‐2(NEWS‐2) scoring on ad- mission were not significantly different between both groups.
In venous blood gas testing, pH, standard base excess, stan- dard bicarbonate, and pCO2 did not differ between SARS‐ CoV‐2 and control groups (Supporting Information, Table S1). In a non‐parametric correlation analysis, there was no significant association between NHE1 expression and pH in the SARS‐CoV‐2or the control group.
In the SARS‐CoV‐2group, one patient (4.8%), compared to six patients in the control group (27.3%), had diabetes mellitus, which was numerically different but did not reach statistical significance. Patients in the control group suffered significantly more often from coronary artery disease. Re- garding drug therapy, only the usage of statins differed signif- icantly between both groups.
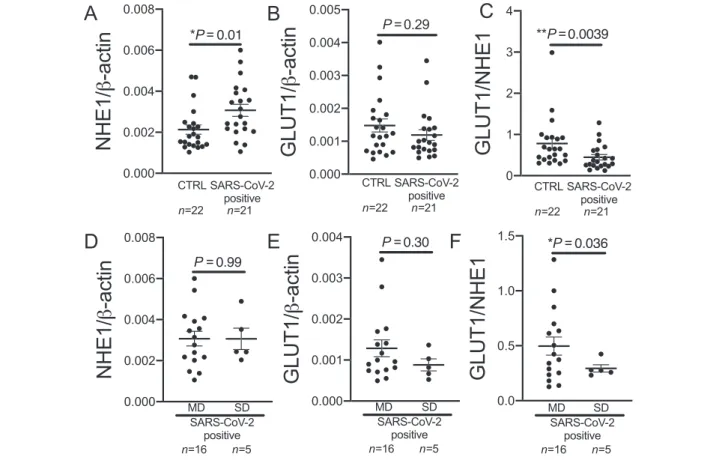
NHE1 expression from whole blood was significantly ele- vated in patients with SARS‐CoV‐2in comparison with control (P=0.01;Figure2A). There was no difference between male and female patients (P= not significant). RNA expression of GLUT1was not significantly different between control group and COVID‐19patients (Figure2B).
The ratio of GLUT1and NHE1whole‐blood RNA expression in SARS‐CoV‐2‐positive patients, however, was significantly reduced compared with control (Figure2C).
In a stepwise multivariate linear regression analysis, only SARS‐CoV‐2status was significantly associated with NHE1ex- pression (P=0.015), in contrast to diabetes, gender, age, cor- onary artery disease, heart failure, obesity, arterial hypertension, hyperlipidaemia, smoking, and statin usage, which were non‐significant covariates (each P = not significant).
Table 1 Patient characteristics
Control (n= 22) SARS‐CoV‐2 (n= 21) Statistics Baseline characteristics
Age 57.1 ± 4.1 49.9 ± 3.6 P= 0.2a
Sex, % male (n) 59.1 (13) 57.1 (12) P>0.9b
BMI 26.9 ± 1.1 27.8 ± 1.2 P= 0.6a
Smokers (continued), % (n) 9.1 (2) 9.5 (2) P>0.9b
Diabetes, % (n) 27.3 (6) 4.8 (1) P= 0.09b
Hypertension, % (n) 50 (11) 28.6 (6) P= 0.2b
Coronary artery disease, % (n) 40.9 (9) 4.8 (1) P= 0.009b
Chronic kidney disease, % (n) 13.6 (3) 9.5 (2) P>0.9b
COPD, % (n) 18.2 (4) 0 (0) P= 0.1b
Asthma, % (n) 13.6 (3) 0 (0) P= 0.2b
Baseline medication
Baseline medication, % (n) 68.2 (15) 61.9 (13) P= 0.8b
ACE‐/AT1‐inhibitors, % (n) 40.9 (9) 19.1 (4) P= 0.2b
Beta‐blockers 27.3 (6) 19.1 (4) P= 0.7b
Aspirin (100 mg/day), % (n) 36.4 (8) 14.3 (3) P= 0.2b
Statins, % (n) 40.9 (9) 4.8 (1) P= 0.009b
Metformin, % (n) 13.6 (3) 0 (0) P= 0.2b
DPP4‐inhibitors, % (n) 9.1 (2) 0 (0) P= 0.5b
Sulfonylurea, % (n) 0 (0) 0 (0) P>0.9b
Gliflozins, % (n) 0 (0) 0 (0) P>0.9b
Incretins, % (n) 0 (0) 0 (0) P>0.9b
Insulin, % (n) 4.6 (1) 4.8 (1) P>0.9b
Immunosuppressants, % (n) 13.6 (3) 9.5 (2) P>0.9b
Symptoms
Onset of symptoms to presentation (days), median (95% CI) 3.5 (1; 8) 8 (5; 13) P= 0.01c
Fatigue, % (n) 90.9 (20) 100 (22) P= 0.5b
Fever, % (n) 72.7 (16) 77.3 (17) P>0.9b
Dyspnoea, % (n) 63.6 (14) 66.7 (14) P>0.9b
Coughing, % (n) 68.2 (15) 71.4 (15) P>0.9b
Chills, % (n) 59.1 (13) 61.9 (13) P>0.9b
Physical markers
Body temperature (°C) 37.6 ± 0.2 37.7 ± 0.2 P= 0.8c
SpO2(%) 95.3 ± 0.6 94.95 ± 0.8 P= 0.7a
Respiratory rate (/min) 20.5 ± 1.3 22 ± 1.5 P= 0.4c
Heart rate (b.p.m.) 89.2 ± 4.5 95.6 ± 3.3 P= 0.3a
Systolic blood pressure (mmHg) 134.2 ± 5.2 132.9 ± 4.3 P= 0.95c
Diastolic blood pressure (mmHg) 83.0 ± 2.9 80.4 ± 2.9 P= 0.5a
NEWS‐2 score 3.1 ± 0.5 3.8 ± 0.6 P= 0.4c
ACE, angiotensin‐converting enzyme; AT1, angiotensin II‐receptor‐subtype 1; BMI, body mass index; CI, confidence interval; COPD, chronic obstructive pulmonary disease; NEWS‐2, National Early Warning Score‐2.
at‐test.
bFisher’s exact test.
cMann–WhitneyUtest.
Five patients in the SARS‐CoV‐2group had severe disease, and three of thesefive patients died. Neither NHE1expres- sion nor GLUT1 expression differed significantly between the COVID‐19 patients with moderate disease and the pa- tients with severe disease (Figure2D,E). The NEWS‐2 score was not different atfirst medical contact in the ED between COVID‐19patients with moderate disease and patients with severe disease (moderate disease:3.4±0.7, severe disease:
4.8±1.4,P=0.26). The ratio of GLUT1and NHE1expression was significantly lower in patients with severe disease com- pared with moderate disease (Figure2F).
RNA expression of NHE1 and GLUT1 was assessed in left ventricular myocardial tissue from patients who died of COVID‐19(n=6) and the control cohort (n=7). Limited clin- ical data for the COVID‐19patients are shown in Supporting Information,Table S2. NHE1expression was significantly ele- vated in patients who died from COVID‐19 compared with controls (Figure3A). Furthermore, the expression of GLUT1
was significantly lower in the patients who had died from COVID‐19 compared with controls (Figure3B). The ratio of GLUT1 to NHE1 was significantly lower in patients with COVID‐19than in the control group (Figure3C).
Discussion
For thefirst time, the current study shows that NHE1RNA ex- pression is up‐regulated in the blood of patients with COVID‐19compared with other respiratory infections, which can be determined already atfirst contact in the ED. Further- more, the ratio of GLUT1to NHE1is significantly lower in the blood of COVID‐19patients who are subsequently intubated and/or die compared with moderately ill patients. Interest- ingly, this expression profile of NHE1and GLUT1extends be- yond the blood, as expression of both transporters is
Figure2 Sodium proton exchanger1(NHE1) and glucose transporter1(GLUT1) expression in the blood of COVID‐19patients. (A) NHE1expression is significantly increased in whole blood of patients with SARS‐CoV‐2infection (SARS‐CoV‐2positive) atfirst contact in the emergency department com- pared with control (CTRL;P=0.01, Mann–WhitneyUtest). (B) GLUT1expression is not significantly altered in whole blood of patients with SARS‐CoV‐2 infection compared with CTRL (P=0.29, Mann–WhitneyUtest). (C) The ratio of GLUT1and NHE1is significantly decreased in patients with SARS‐CoV‐2 infection compared with CTRL (P=0.0039, Mann–WhitneyUtest). (D and E) In patients with COVID‐19atfirst contact in the emergency department, (D) NHE1or (E) GLUT1expression is not significantly different in patients who later develop moderate disease (MD) compared with patients later re- quiring intubation and/or dying [severe disease (SD); (D):P=0.99,t‐test; (E):P=0.30,t‐test]. (F) GLUT1to NHE1ratio is significantly decreased in patients with SD compared with patients with MD (P=0.036, Welsht‐test).
significantly altered in left ventricular myocardium of de- ceased COVID‐19patients. The ratio of GLUT1and NHE1in the myocardium of deceased COVID‐19patients was signifi- cantly lower, resembling the lower ratio of GLUT1 and NHE1in the blood of COVID‐19 patients in the ED, who are subsequently at risk of intubation or death. This suggests that NHE1and GLUT1may be critically involved in the disease pro- gression of SARS‐CoV‐2infection.
In COVID‐19, increased inflammatory markers such as C‐reactive protein and interleukin6have been reported, es- pecially in severe COVID‐19 cases.14 Cardiac complications, such as myocarditis, arrhythmias, acute coronary syndrome, or acute heart failure, are known complications in severe dis- ease courses. Furthermore, elevated levels of cardiac markers, like cardiac troponin or brain natriuretic peptide, are common in these patients as surrogate of myocardial damage due to inflammation or ischaemia.14,15 A potential explanation of the increased cardiovascular morbidity in COVID‐19is the binding of SARS‐CoV‐2to the host receptor angiotensin‐converting enzyme2, which is highly expressed in the human heart and vascular cells, but exact pathophysi- ological processes of myocardial damage are still not fully understood.
NHE is an ion transporter protein family, which plays a crit- ical role in regulation of intracellular pH or cell volume, and NHE1is the predominant isoform of the NHE family in myo- cardial and vascular cells.16 Previous studies found an in- creased activity of NHE1 associated with hypertrophy, cardiac fibrosis, and heart failure.17,18Therefore, NHE1 has been identified as a potential target in therapy of heart failure.19Recently, SGLT2inhibitors, which decrease NHE1ac- tivity, have been discussed as potential therapeutic agents in
heart failure.20,21Interestingly, NHE1activity seems to be in- volved in inflammatory response and leucocyte function.22,23 In this study, we found elevated NHE1 expression in whole blood of patients with COVID‐19 in comparison with other bacterial or viral infections. This elevated expression was also present in myocardial tissue of deceased patients with COVID‐19. Of note, inflammatory parameters like interleukin 6, C‐reactive protein, or white blood cell count did not differ significantly between both groups (Supporting Information, Table S3). A potential confounder due to increased inflamma- tory response in the SARS‐CoV‐2 group cannot be excluded but seems therefore unlikely. Under the aspect of increased cardiovascular complications due to COVID‐19, the elevated expression of NHE1could potentially be involved in patho- physiological pathways of cardiovascular damage due to COVID‐19. Increased NHE1expression and/or activity could also be involved in or be dependent on altered platelet func- tion in COVID‐19,24as NHE1activation contributes to platelet activation. Interestingly, platelet activation can also be modu- lated by SGLT2 inhibitors.25 In our COVID‐19 cohort, the platelet count is not significantly different between the con- trol group and the COVID‐19group (Supporting Information, Table S3). COVID‐19patients with moderate disease and se- vere disease show no difference in platelet counts (moderate disease:195.2±14.84vs. severe disease:144.6±35.25,t‐test P =0.14, data expressed as mean ± SEM). Pearson correla- tions for platelet counts and NHE1 expression in the blood show neither a significant correlation in the control or COVID‐19group nor when looking at COVID‐19patients with moderate vs. severe disease. However, platelet count and platelet activity may of course differ, but as we used lysed whole blood for our experiments (safety for our personnel),
Figure3 Sodium proton exchanger1(NHE1) and glucose transporter1(GLUT1) expression in left ventricular (LV) myocardium of deceased COVID‐19 patients. (A) In LV myocardium of deceased COVID‐19patients (SARS‐CoV‐2positive), NHE1expression is significantly decreased compared with con- trols (CTRL;P=0.016,t‐test). (B) In LV myocardium of deceased COVID‐19patients (SARS‐CoV‐2positive), GLUT1expression is significantly decreased compared with CTRL (P=0.004,t‐test). (C) Similar to the data from whole blood of patients in the emergency department, GLUT1/NHE1ratio is sig- nificantly decreased in LV myocardium of deceased COVID‐19patients (SARS‐CoV‐2positive), compared with CTRL (P=0.018,t‐test).
we cannot determine platelet activity in our study cohort, as this would require fresh samples with high safety precau- tions. Nevertheless, after strong platelet activation, platelets aggregate and thus cannot be measured in the bloodstream;
thus, platelet count is at least an indirect measure of platelet activity.26
Interestingly, it has been shown that NHE1‐deficient mice show strongly increased cardiac GLUT1expression.13GLUT1 is a glucose transporter of the GLUT family and ubiquitously expressed in almost all tissues. Primary function of GLUT1is the basal cellular glucose uptake independent from insulin. In- creased GLUT1 expression was shown in animal models of myocardial ischaemia or system inflammatory response syndrome,27,28 suggesting a compensatory mechanism due to stress and hypoxia. While hypoxia can also increase NHE1 expression, among others, via Sgk1,8,9activity of the kinase has also been shown to alter GLUT1activity. Further, GLUT1 expression was correlated with left ventricular contractility in that system inflammatory response syndrome animal model.
Interestingly, a reduced myocardial GLUT1 expression was found in patients with end‐stage heart failure in one study.29 In our study, GLUT1whole‐blood RNA expression was not sig- nificantly different between COVID‐19patients or control, but the ratio of GLUT1 to NHE1 was lower in patients with COVID‐19in comparison with control. In patients with severe COVID‐19, the ratio was even lower than in patients with mod- erate disease. These altered expressions on NHE1and GLUT1 were similar in myocardial tissue of deceased patients with COVID‐19. Furthermore, GLUT1 was significantly lower expressed in the myocardial tissue of patients who deceased due to COVID‐19. This pattern might reflect a maladaptation to inflammatory stress and myocardial ischaemia in patients with COVID‐19and unfavourable disease progression. It may also hint at disturbed cellular ion handling and pH regulation, as both low and high sodium levels can alter GLUT1 expression,12and regulation of cellular pH is dependent on both GLUT1expression and NHE1expression and vice versa.11 Further research regarding the role of these transporters is urgently warranted, especially regarding the potential effects of gliflozins in COVID‐19, which have been reported to affect both NHE1and GLUT1.4,7
Potential limitations of our study include the low number of diabetic patients in the COVID‐19 group, as diabetic pa- tients are at increased risk of mortality when contracting SARS‐CoV‐2. Also, we could not investigate the effects of gliflozins on GLUT1 and NHE1 in COVID‐19 patients, which will need to be addressed in the future. Furthermore, an ad- ditional desirable control group for the analysis of cardiac ex- pression of NHE1and GLUT1in deceased COVID‐19patients would arguably be tissue from patients who have recovered from COVID‐19; however, this is of course not reasonably ob- tainable. In addition, thesefindings from a limited number of
patients from only one site have to be validated in larger pa- tient cohorts in the near future, also exploring whether re- duced GLUT1/NHE1 ratio is an independent risk factor for mortality in COVID‐19.
Acknowledgements
We acknowledge the expert technical assistance of Teresa Stauber and Sebastian Benkhoff. Open access funding en- abled and organized by Projekt DEAL.
Con fl ict of interest
The authors state that no conflict of interest exists.
Funding
J.M. is funded by the German Cardiac Society Clinician Scien- tist programme. L.S.M. is funded by the Deutsche Forschungsgemeinschaft (DFG) grant Ma1982/5‐1. S.W. and L.S.M. are funded by SFB1350TPA6and the University of Re- gensburg ReForM C programme. S.W. is funded by DFG grants WA2539/4‐1,5‐1,7‐1, and8‐1.
Author contributions
J.M., J.H., and C.J. designed the study, gathered and analysed data, performed statistical analysis, wrote the manuscript, and are responsible for the integrity of the work as a whole.
F.H., K.E., M.E., and C.M. gathered data and revised the man- uscript for critical intellectual content. S.W., S.S., and L.S.M.
analysed data and revised the manuscript for critical intellec- tual content.
Supporting information
Additional supporting information may be found online in the Supporting Information section at the end of the article.
Table S1.Venous blood gas analyses.
Table S2.Clinical data for deceased COVID‐19patients with left ventricular tissue donation.
Table S3.Laboratory parameters.
References
1. Deng X, Ji Z, Xu B, Guo L, Xu L, Qin T, Feng L, Ma Z, Fu Q, Qu R, Quo Q, Ma S. Suppressing the Na+/H+ exchanger 1: a new sight to treat depression.Cell Death Dis Nature Publishing Group UK 2019;10: 370–370.
2. Chai N, Bates P. Na+/H+exchanger type 1 is a receptor for pathogenic subgroup J avian leukosis virus.Proc Natl Acad Sci 2006;103: 5531–5536.
3. Shao D, Tian R. Glucose transporters in cardiac metabolism and hypertrophy. In Terjung R., ed. Comprehensive Physiol- ogy. Hoboken, NJ, USA: John Wiley &
Sons, Inc.; 2015. p 331–351.
4. Baartscheer A, Schumacher CA, Wüst RCI, Fiolet JWT, Stienen GJM, Coronel R, Zuurbier CJ. Empagliflozin decreases myocardial cytoplasmic Na+through in- hibition of the cardiac Na+/H+ ex- changer in rats and rabbits.
Diabetologia2017;60: 568–573.
5. Uthman L, Baartscheer A, Bleijlevens B, Schumacher CA, Fiolet JWT, Koeman A, Jancev M, Hollmann MW, Weber NC, Coronel R, Zuurbier CJ. Class effects of SGLT2 inhibitors in mouse cardiomyocytes and hearts: inhibition of Na+/H+exchanger, lowering of cyto- solic Na+and vasodilation.Diabetologia 2018; 61( 3): 722–726. https://doi.
org/10.1007/s00125‐017‐4509‐7 6. Mustroph J, Wagemann O, Lücht CM,
Trum M, Hammer KP, Sag CM, Lebek S, Tarnowski D, Reinders J, Perbellini F, Terracciano C, Schmid C, Schopka S, Hilker M, Zausig Y, Pabel S, Sossalla ST, Schweda F, Maier LS, Wagner S.
Empagliflozin reduces Ca/calmodulin‐ dependent kinase II activity in isolated ventricular cardiomyocytes. ESC Heart Fail2018;5: 642–648.
7. Mustroph J, Lücht CM, Wagemann O, Sowa T, Hammer KP, Sag CM, Tarnowski D, Holzamer A, Pabel S, Beuthner BE, Sossalla S, Maier LS, Wagner S.
Empagliflozin enhances human and mu- rine cardiomyocyte glucose uptake by in- creased expression of GLUT1.
Diabetologia2019;62: 726–729.
8. Voelkl J, Pasham V, Ahmed MSE, Walker B, Szteyn K, Kuhl D, Metzler B, Alesutan I, Lang F. Sgk1‐dependent stimulation of cardiac Na+/H+ exchanger Nhe1 by dexamethasone. Cell Physiol Biochem 2013;32: 25–38.
9. Shimoda LA, Fallon M, Pisarcik S, Wang J, Semenza GL. HIF‐1 regulates hypoxic induction of NHE1 expression and alka- linization of intracellular pH in pulmo- nary arterial myocytes. Am J Physiol‐Lung Cell Mol Physiol Am Physiol Soc2006;291: L941–L949.
10. Palmada M, Boehmer C, Akel A, Rajamanickam J, Jeyaraj S, Keller K, Lang F. SGK1 kinase upregulates GLUT1 activity and plasma membrane expres- sion.Diabetes2006;55: 421–427.
11. Lang KS, Mueller MM, Tanneur V, Wallisch S, Fedorenko O, Palmada M, Lang F, Bröer S, Heilig CW, Schleicher E, Weigert C. Regulation of cytosolic pH and lactic acid release in mesangial cells overexpressing GLUT1.Kidney Int 2003;64: 1338–1347.
12. Vestri S, Okamoto MM, de Freitas HS, Aparecida dos Santos R, Nunes MT, Morimatsu M, Heimann JC, Machado UF. Changes in sodium or glucosefiltra- tion rate modulate expression of glucose transporters in renal proximal tubular cells of rat. J Membr Biol2001; 182: 105–112.
13. Prasad V, Lorenz JN, Miller ML, Vairamani K, Nieman ML, Wang Y, Shull GE. Loss of NHE1 activity leads to reduced oxidative stress in heart and mitigates high‐fat diet‐induced myocardial stress.J Mol Cell Cardiol2013;6533–42.
14. Kermali M, Khalsa RK, Pillai K, Ismail Z, Harky A. The role of biomarkers in diag- nosis of COVID‐19—a systematic review.
Life Sci2020;254: 117788.
15. The European Society for Cardiology. ESC guidance for the diagnosis and manage- ment of CV disease during the COVID‐19 pandemic. 2020. https://www.escardio.
org/Education/COVID‐19‐and‐Cardiol- ogy/ESC‐COVID‐19‐Guidance
16. Padan E, Landau M. Sodium‐proton (Na+/H+) antiporters: properties and roles in health and disease. In Sigel A., Sigel H., Sigel R. K. O., eds.The Alkali Metal Ions: Their Role for Life. Cham:
Springer International Publishing;
2016. p 391–458.
17. Nakamura TY, Iwata Y, Arai Y, Komamura K, Wakabayashi S. Activation of Na+/H+ exchanger 1 is sufficient to generate Ca2+ signals that induce car- diac hypertrophy and heart failure.Circ Res2008;103: 891–899.
18. Despa S, Bers DM. Na+transport in the normal and failing heart—remember the balance. J Mol Cell Cardiol 2013;
61: 2–10.
19. Baartscheer A, Schumacher CA, van Borren MMGJ, Belterman CNW, Coronel R, Opthof T, Fiolet JWT. Chronic inhibi- tion of Na+/H+‐exchanger attenuates cardiac hypertrophy and prevents cellu- lar remodeling in heart failure.
Cardiovasc Res2005;65: 83–92.
20. McMurray JJV, Solomon SD, Inzucchi SE, Køber L, Kosiborod MN, Martinez FA, Ponikowski P, Sabatine MS, Anand IS, Bělohlávek J, Böhm M, Chiang C‐E, Chopra VK, de Boer RA, Desai AS, Diez M, Drozdz J, Dukát A, Ge J, Howlett JG, Katova T, Kitakaze M, Ljungman CEA, Merkely B, Nicolau JC, O’Meara E, Petrie MC, Vinh PN, Schou M, Tereshchenko S, Verma S, Held C, DeMets D, Docherty KF, Jhund PS, Bengtsson O, Sjöstrand M, Langkilde AM, DAPA‐HF Trial Committees and
Investigators. Dapagliflozin in patients with heart failure and reduced ejection fraction. N Engl J Med 2019; 381: 1995–2008.
21. Zinman B, Wanner C, Lachin JM, Fitchett D, Bluhmki E, Hantel S, Mattheus M, Devins T, Johansen OE, Woerle HJ, Broedl UC, Inzucchi SE.
Empagliflozin, cardiovascular outcomes, and mortality in type 2 diabetes.N Engl J Med2015;373: 2117–2128.
22. Qadri SM, Su Y, Cayabyab FS, Liu L. En- dothelial Na+/H+exchanger NHE1 par- ticipates in redox‐sensitive leukocyte recruitment triggered by methylglyoxal.
Cardiovasc Diabetol BioMed Central 2014;13: 134–134.
23. Zhao Y, Cui G, Zhang N, Liu Z, Sun W, Peng Q. Lipopolysaccharide induces en- dothelial cell apoptosis via activation of Na+/H+ exchanger 1 and calpain‐dependent degradation of Bcl‐ 2.Biochem Biophys Res Commun2012;
427: 125–132.
24. Manne BK, Denorme F, Middleton EA, Portier I, Rowley JW, Stubben CJ, Petrey AC, Tolley ND, Guo L, Cody MJ, Weyrich AS, Yost CC, Rondina MT, Campbell RA.
Platelet gene expression and function in COVID‐19 patients. Blood 2020; 136: 1317–1329.
25. Spigoni V, Fantuzzi F, Carubbi C, Pozzi G, Masselli E, Gobbi G, Solini A, Bonadonna RC, Dei Cas A. Sodium‐glu- cose cotransporter 2 inhibitors antago- nize lipotoxicity in human myeloid angiogenic cells and ADP‐dependent ac- tivation in human platelets: potential relevance to prevention of cardiovascu- lar events. Cardiovasc Diabetol BioMed Central2020;19: 46–46.
26. Würtz M, Hvas A‐M, Kristensen SD, Grove EL. Platelet aggregation is depen- dent on platelet count in patients with coronary artery disease. Thromb Res 2012;129: 56–61.
27. Rosenblatt‐Velin N, Montessuit C, Papageorgiou I, Terrand J, Lerch R.
Postinfarction heart failure in rats is as- sociated with upregulation of GLUT‐1 and downregulation of genes of fatty acid metabolism. Cardiovasc Res 2001;
52: 407–416.
28. Bateman RM, Tokunaga C, Kareco T, Dorscheid DR, Walley KR. Myocardial hypoxia‐inducible HIF‐1α, VEGF, and GLUT1 gene expression is associated with microvascular and ICAM‐1 hetero- geneity during endotoxemia. Am J Physiol‐Heart Circ Physiol Am Physiol Soc2007;293: H448–H456.
29. Razeghi P, Young ME, Ying J, Depre C, Uray IP, Kolesar J, Shipley GL, Moravec CS, Davies PJA, Frazier OH, Taegtmeyer H. Downregulation of metabolic gene expression in failing human heart before and after mechanical unloading.Cardi- ology2002;97: 203–209.