Differential Processing of Olfactory Information in Identified Central Olfactory Neurons
I n a u g u r a l – D i s s e r t a t i o n
zur Erlangung des Doktorgrades
der Mathematisch‐Naturwissenschaftlichen Fakultät der Universität zu Köln
vorgelegt von
Andreas Pippow
aus Essen
Köln 2008
Tag der mündlichen Prüfung: 14. Juli 2008
Abbreviations...6
Zusammenfassung...7
Abstract...9
1 Introduction...11
1.1 Determining parameters that control calcium dynamics with the added buffer approach...13
1.2 Calcium imaging of odor evoked responses...16
2 Materials & Methods...21
2.1 Animals and materials...21
2.2 Cell culture...22
2.3 Intact brain preparation...23
2.4 Whole cell recordings...24
2.5 Fluorimetric calcium measurements...25
2.5.1 Imaging setup...25
2.5.2 Imaging with fura‐2...26
2.5.3 Imaging with OGB‐1...30
2.6 Single compartment model of calcium buffering...31
2.6.1 Calcium influx...32
2.6.2 Buffering...32
2.6.3 Extrusion...33
2.6.4 Dynamics of calcium transients...33
2.7 Analysis of calcium buffering...34
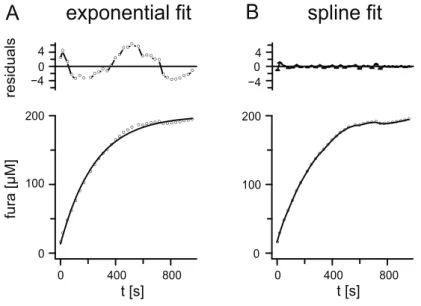
2.7.1 Fitting the loading curve...35
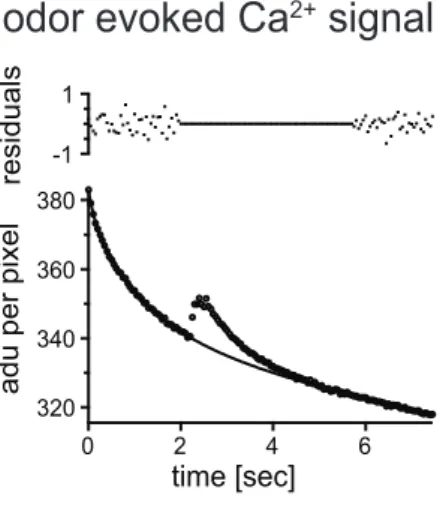
2.8 Analysis of odor evoked calcium signals...37
2.9 Odor stimulation...38
2.10 Histology...39
2.10.1 Single cell labelling...39
2.10.2 Confocal microscopy...40
2.11 Tools for data analysis...40
3 Results...41
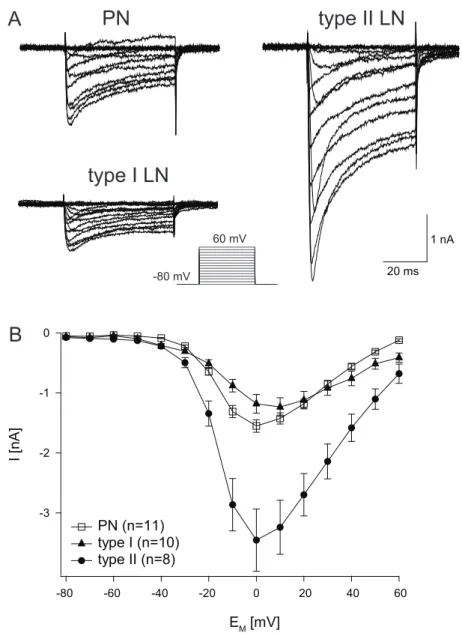
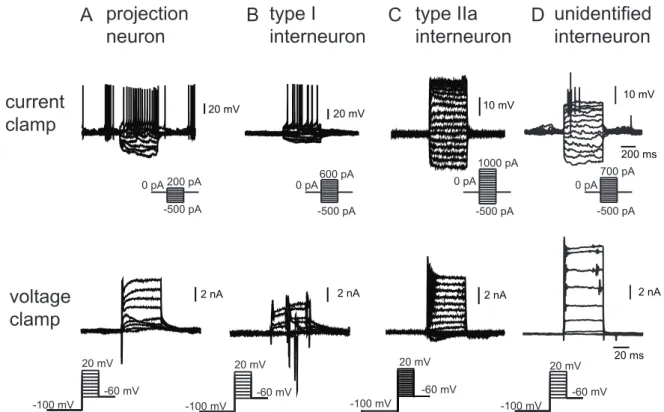
3.1 Identification of neuron types...41
3.1.1 Identification of neurons for the analysis of Ca
2+buffering...43
3.1.2 Identification of neurons for the analysis of odor evoked Ca
2+signals ...44
3.2 Calcium buffering...47
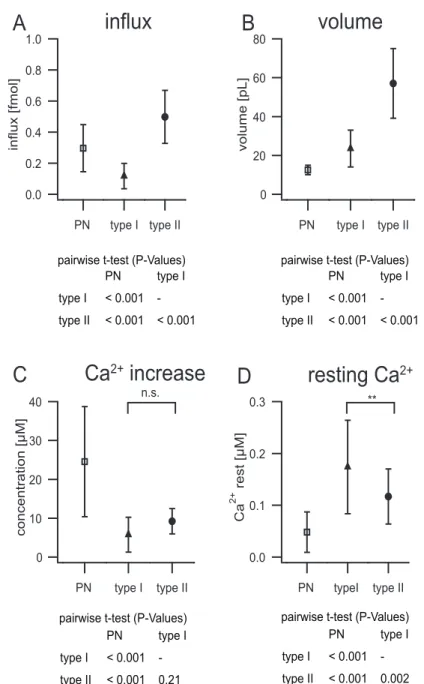
3.2.1 Calcium influx and calcium resting level...47
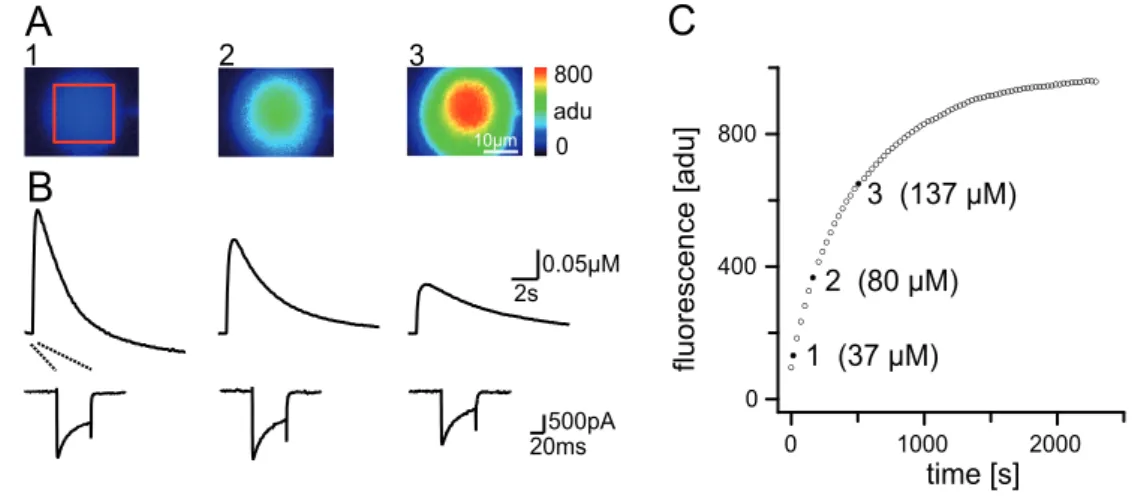
3.2.2 Dye concentration from loading curves...51
3.2.3 Buffering...53
3.2.4 Comparison of neuron types...58
3.2.5 Outlook – differential buffering in small neuronal compartments of single cells...61
3.3 Imaging of odor evoked calcium signals...63
3.3.1 LNs with glomerulus specific odor responses...65
3.3.2 LNs with uniform glomerular odor responses...72
3.3.3 Uniglomerular projection neurons...74
4 Discussion...77
4.1 Identification of neuron types ...77
4.2 Calcium Buffering...78
4.2.3 Calcium buffering in small neuronal compartments...86
4.3 Imaging of odor evoked calcium signals...87
4.3.1 Implications for olfactory coding...87
4.3.2 Significance of calcium buffering...90
4.3.3 Measuring calcium activity with CCD cameras...91
4.3.4 Outlook and experimental plan...92
List of Figures...93
References...95
Danksagung...105
Erklärung...107
Teilpuplikationen...108
(u)PN(s) (uniglomerular) projection neuron(s)
[BCa] concentration of calcium‐bound exogenous buffer B [B
T] total concentration of exogenous buffer B
[Ca
2+]
iintracellular calcium ion concentration [Ca
2+]
i,∞steady‐state (resting) calcium level
[SCa] concentration of calcium‐bound endogenous buffer S [S
T] total concentration of endogenous buffer S
4‐AP 4‐aminopyridine AL(s) antennal lobe(s) AP(s) action potential(s)
EGTA ethylene diamine tetraacetic acid
GABA
γ‐aminobutyric acidiACT inner antenno‐cerebral tract
j
in,pipettecalcium influx from the pipette in molar
j
in,stimcalcium influx from a stimulus in molar
Kd,Fura
dissociation constant of fura‐2
Kd,S
dissociation constant of endogenous buffer S LN(s) local interneuron(s)
nCa absolute calcium influx in mol OBP(s) olfactory binding protein(s) ORC(s) olfactory receptor cell(s)
vaccessible cell volume
γcalcium extrusion rate
Δ[Ca2+
]
ichange of intracellular calcium concentration, [Ca
2+]
i ‐ [Ca2+]
i,∞κB
calcium binding capacity of exogenous buffer B
κScalcium binding capacity of endogenous buffer S
τloading
fura‐2 loading time constant
τtransient
decay constant of monoexponential transient
Zusammenfassung
Informationsverarbeitung in Neuronen ist von hoch lokalisierten Kalziumsignalen abhängig. Die räumliche und zeitliche Dynamik solcher Signale wird von mehreren zellulären Parametern bestimmt, u.a. vom Kalzium‐Einstrom, der Kalzium‐Pufferung und der Pumprate von Kalzium aus der Zelle. Das langfristige Ziel dieser Arbeit gilt dem besseren Verständnis darüber, wie intrazelluläre Kalzium‐Dynamiken kontrolliert werden und zur Informationsverarbeitung in Interneuronen des olfaktorischen Systems von Insekten, welches als hervorragendes Modellsystem für allgemeine Mechanismen der Olfaktorik dient, beitragen. Ich habe die patch‐clamp Technik und schnelle optische imaging Methoden mit dem added buffer approach kombiniert, um die zellulären Parameter zu analysieren, welche die Dynamik intrazellulärer Kalziumsignale bestimmen.
Dafür erforderliche Messungen wurden in adulten Periplaneta americana in zwei
physiologisch unterschiedlichen lokalen Interneurontypen sowie in
uniglomerulären Projektionsneuronen durchgeführt. In uniglomerulären
Projektionsneuronen wurde durch 50 ms lange Spannungsschritte von ‐60 bis +
5 mV ein absoluter Kalzium Einstrom (n
Ca) von 0.3 fmol generiert. Die endogene
Kalzium‐Binderate (κ
S) war 418 und die Pumprate (γ) 221 s
‐1, was in einer
Zeitkonstante (τ
endo) des endogenen Signals von 1.8 s resultierte. In lokalen
Interneuronen waren diese Werte signifikant unterschiedlich. Lokale Interneurone
vom Typ I, die keine Na
+getragenen Aktionspotentiale generieren, hatten einen n
Cavon 0.12 fmol, κ
Svon 154 und γ von 141 s
‐1, was in einem τ
endovon 1.1 s resultierte. In lokalen Interneuronen vom Typ II war n
Cabei 0.5 fmol, κ
Sbei 672, γ bei 305 s
‐1und τ
endobei 2.2 s.
Die Daten zeigen, dass die Kalziumdynamik mit zellulären Funktionen der verschiedenen Neuronentypen korreliert. Interessanterweise haben lokale Interneurone vom Typ II, die keine spannungsaktivierten Na
+Kanäle besitzen und in denen Kalzium das einzige Kation ist, welches zur Membrandepolarisation beiträgt, die höchste endogene Kalzium‐Bindekapazität und ‐Pumprate.
In einem zweiten Teil wurden lokale Aktivitäten in lokalen Interneuronen vom
Typ I+II mit physiologischen Duftstimulationen untersucht. Glomeruläre
duftspezifische Tuning‐Kurven wurden für individuelle Interneurone
aufgenommen. Diese zeigten, dass bei bestimmten Düften einige
multiglomeruläre Neurone bevorzugt in nur einem Teil der innervierten
Glomeruli aktiv sind, während andere lokale Interneurone unspezifisch in allen
innervierten Glomeruli und bei allen Düften aktiv werden. Diese Daten legen
nahe, dass einzelne Neurone durch ihre intrinsischen Eigenschaften entweder
Netzwerke mit glomerulus‐spezifischen oder mit unspezifischen, gleichförmigen
Duftantworten bilden können.
Abstract
Information processing in neurons is dependent of highly localized calcium
signals. The spatial and temporal dynamics of these signals are determined by a
variety of cellular parameters including calcium influx, calcium buffering and
calcium extrusion. A long‐term goal is to better understand how intracellular
calcium dynamics are controlled and contribute to information processing in
interneurons of the insect olfactory system, an excellent model to study general
mechanisms of olfaction. We used patch‐clamp recordings and fast optical
imaging in combination with the ’added buffer approach’ to analyze cellular
parameters that determine the dynamics of internal calcium signaling. Recordings
were performed in adult Periplaneta americana from 2 types of physiologically
different local interneurons and from uniglomerular projection neurons. In
uniglomerular projection neurons 50 ms voltage steps from ‐60 to +5 mV
generated an absolute Ca
2+influx (n
Ca) of 0.3 fmol. The endogenous Ca
2+binding
ratio (κ
S) was 418, with an extrusion rate (γ) of 221 s
‐1resulting in a decay constant
of the endogenous signal (τ
endo) of 1.8 s. In local interneurons these values were
significantly different. In type I local interneurons, which generate Na
+driven
action potentials, the absolute Ca
2+influx upon a voltage steps from ‐60 to +5 mV
(50 ms) was 0.12 fmol. The endogenous Ca
2+binding ratio was 154, the extrusion
rate 141 s
‐1, resulting in a decay constant of 1.1 s. In type II local interneurons the
absolute Ca
2+influx was 0.5 fmol, the Ca
2+binding ratio was 672, the rate of Ca
2+removal was 305 s
‐1and the endogenous signal decayed with a time constant of 2.2 s.
These data show a clear correlation between Ca
2+handling properties and cellular function in different neuron types. Interestingly, type II local interneurons, which do not express voltage activated sodium channels and where Ca
2+is the only cation that enters the cell to contribute to membrane depolarization, has the highest endogenous Ca
2+binding ratio and Ca
2+extrusion rate.
In a second part physiological odor stimulations were applied to reveal general
principles of olfactory information processing in type I and type II local
interneurons. Odor specific glomerular tuning curves were obtained from
individual interneurons demonstrating that some multiglomerular neurons are
preferentially active in a subset of the glomeruli for certain odors. Other local
interneurons unspecifically react to odors. The results suggest that glomerulus
specific and unspecific networks are formed by the intrinsic properties of
individual LNs.
1 Introduction
The insect olfactory system serves as an extremely successful model for olfactory information processing (reviewed by Davis, 2004; Fiala, 2007; Hildebrand and Shepherd, 1997; Laurent, 1999; Strausfeld and Hildebrand, 1999; Wilson and Mainen, 2006). Due to the many striking similarities in structural organization and physiological function between vertebrate and invertebrate olfactory systems, data from the insect olfactory system have contributed significantly to the construction of a reasonable general model for olfactory systems on the network level (Davis, 2004; Distler and Boeckh, 1997b; Laurent and Davidowitz, 1994; Wilson and Laurent, 2005). This study is intended to further analyze the cellular parameters that determine intracellular calcium dynamics in central olfactory interneurons to better understand the mechanisms that are mediating olfactory information processing on the cellular and sub‐cellular level.
In neurons, calcium regulates a multitude of cellular functions and many aspects of information processing are dependent on highly localized calcium domains.
Besides being a charge carrier, which contributes directly to the membrane
potential, calcium serves as a second messenger that controls a variety of cellular
processes including synaptic release, membrane excitability, enzyme activation
and activity dependent gene activation. Selective activation of these functions is
achieved through the spatial and temporal distribution of calcium signals
(Augustine et al., 2003). The spatial‐temporal Ca
2+dynamics are determined by
several cellular parameters including calcium influx, geometry of the cell, location of the calcium source, calcium buffering, calcium extrusion, and locally changing diffusion coefficients. Voltage activated Ca
2+currents, an important Ca
2+entry pathway, have been studied in many insect neuron types (Benquet et al., 1999;
Grolleau and Lapied, 1996; Heidel and Pfluger, 2006; Husch et al., 2008; Mills and Pitman, 1997; Wicher and Penzlin, 1997). Other factors that influence calcium dynamics, however, are not as well studied and understood.
Here we used patch‐clamp recordings and fast optical imaging in combination with the ’added buffer approach’ (Neher and Augustine, 1992) to characterize the calcium buffering and calcium extrusion in interneurons of the first synaptic relay (antennal lobe, AL) in the Periplaneta americana olfactory system. The voltage activated Ca
2+currents have been described in these neurons previously (Husch et al., 2008).
A long term goal is to better understand how intracellular calcium dynamics contribute to information processing in olfactory interneurons of the insect AL.
Specifically, we are interested how far the different electrophysiological characteristics are correlated with differences in Ca
2+handling properties. This is of special interest in the AL, because we have recently identified 2 types of LNs with fundamental differences in intrinsic firing properties: type I LNs generate
ʹnormalʹ Na
+driven action potentials, whereas type II LNs do not express voltage
activated sodium channels. In type II LNs Ca
2+is the only cation that enters the cell to contribute to membrane depolarization. I consider the characterization of cellular parameters that determine cytosolic Ca
2+dynamics as an important step towards a detailed understanding of the cellular basis of olfactory information processing on the single cell level.
Besides being essential to better understand the mechanisms of neuronal Ca
2+handling and its role in information processing, these data are also important to
help interpret time constants of Ca
2+signals from experiments in which Ca
2+measurements are performed to monitor global neuronal activity.
This was done in a second part of this thesis, where Ca
2+imaging was used to determine odor evoked activity on the subcellular level in the same identified neuron types. Odor stimulations were applied to reveal general principles of olfactory information processing. These data complement the results on Ca
2+handling properties and help to better understand the interactions of interneurons in the AL of insects. Subsequently, the two parts of this thesis are introduced in more detail.
1.1 Determining parameters that control calcium dynamics with the added buffer approach
Calcium buffers are important for the control of intracellular Ca
2+dynamics. Some calcium‐buffering proteins that have been described in detail are calbindin‐D28K (Hackney et al., 2005; Jackson and Redman 2003), calretinin (Edmonds et al., 2000;
Hackney et al., 2005) and parvalbumin (Muller et al, 2007; Lee et al., 2000; Collin et al., 2005). In this study the ʹadded buffer approachʹ was used to determine endogenous buffering proteins, which were however not precisely defined. This study therefore does not go into detail about their nature and regards them as abstract general proteins.
The dynamics of an intracellular calcium signal are mainly determined by the Ca
2+source (influx or release from intracellular stores), the intracellular Ca
2+buffering
and the Ca
2+extrusion from the cell. The signal itself is characterized by its resting
level, the rise, the amplitude and the decay time constant. These characteristics of
the signal are changed when one of the three parameters that shape the signal is
altered. A double Ca
2+influx (compared to a putative control) would double the
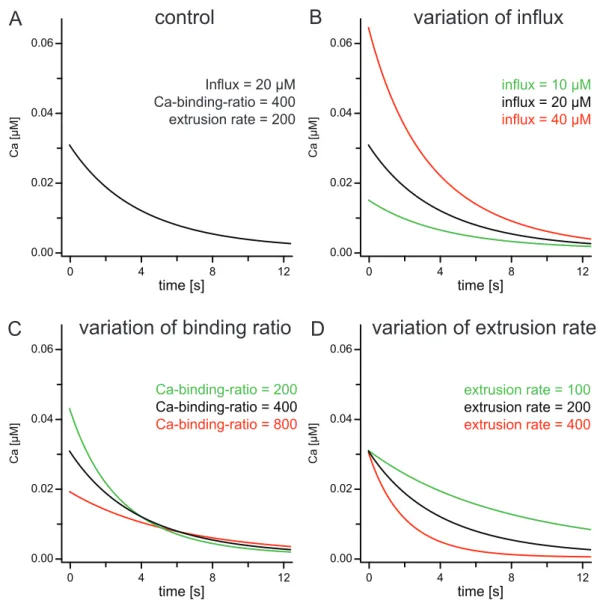
amplitude of the signal. Increasing the calcium binding ratio by a factor of 2 would reduce the amplitude by 50% and double the decay time constant. Reducing the extrusion rate by 50% would double the decay time constant (see Fig. 1). In this study these parameters of intracellular calcium dynamics were quantified in somata of a) isolated olfactory interneurons from the antennal lobe of Periplaneta americana (in vitro) and b) on somata of identified uniglomerular projection neurons and two types of local interneurons in an intact brain preparation (in situ) from adult male P. americana.
Experimentally, these values could be investigated by patch‐clamp recordings combined with simultaneous optical imaging techniques. Electrophysiological data were used to measure absolute voltage induced Ca
2+movements across the cell membrane. Imaging combined with patch‐clamp techniques were used to reveal the following characteristics of the intracellular calcium signal: Ca
2+influx, endogenous Ca
2+binding ratio and Ca
2+extrusion. However, the indicator represented an exogenous (added) buffer, which competed with the endogenous buffers, increasing the actual calcium binding ratio while it diffused into the cell.
Thereby it reduced the amplitude and increased the decay time constant, as obvious in Fig. 1C. The resting level was supposably not affected.
To reveal the values of the endogenous calcium binding ratio (and therefore the amplitude and decay constant of the intracellular signal), the ʹadded buffer approachʹ was applied (Neher and Augustine, 1992). This method uses a single compartment model with the following assumptions: a big patch‐pipette is connected to a tiny cell, the endogenous buffer is immobile, the exogenous buffer diffuses exponentially into the cell and is always in a “well mixed state”, Ca
2+goes into the cell via voltage activated Ca
2+channels, leak currents and the patch‐
pipette, Ca
2+clearance is linear and non‐saturable, the exogenous and endogenous
buffers are always at equilibrium with Ca
2+(Helmchen et al., 1997; Neher and
Augustine, 1992). In other words: 1) Changes in the indicator concentration have a linear effect on the amplitude and the decay constant. 2) When the actual calcium
Figure 1: Single compartment model of calcium buffering
(A) Computer simulations of the decay of Ca2+ in a single compartment model. Transients were numerically computed by integration of the differential equation (Eq. 12) describing the Ca2+ dynamics in a homogeneous compartment. Initial values for the simulations were chosen to be in the range of values determined throughout this study, roughly simulating the decay kinetics of a projection neuron (total dye concentration [BT] = 100 μM, total dye concentration in the pipette [BCap] = 200 μM, loading time constant of the dye τloading = 1000 s, Ca2+‐binding‐ratio of the endogenous buffer κS ≈ [ST] ∙ (Kd.S)‐1 = 400, dissociation constant of the dye Kd,Fura = 0.191 μM, Ca2+‐extrusion‐rate γ = 200 s‐1, resting Ca2+ concentration [Ca2+]i,∞ = 0 μM, Ca2+ influx (see eq. 8) = 20 μM). (B) Computer simulations as in (A), with the same initial values (black), half the Ca2+ influx (green) and double the Ca2+ influx (red). (C) Simulations as in (A), with the same initial values (black), half the Ca2+‐binding‐ratio (green) and double the Ca2+‐binding‐ratio (red). (D) Simulations as in (A), with the same initial values (black), half the Ca2+‐extrusion rate (green) and double the Ca2+‐extrusion rate (red).
A B
C D
0 4 8 12
0.00 0.02 0.04 0.06
extrusion rate = 100 extrusion rate = 200 extrusion rate = 400
time [s]
Ca [μM]
0 4 8 12
0.00 0.02 0.04 0.06
Ca-binding-ratio = 200 Ca-binding-ratio = 400 Ca-binding-ratio = 800
time [s]
Ca [μM]
0 4 8 12
0.00 0.02 0.04 0.06
influx = 10 μM influx = 20 μM influx = 40 μM
time [s]
Ca [μM]
0 4 8 12
0.00 0.02 0.04 0.06
Influx = 20 μM Ca-binding-ratio = 400 extrusion rate = 200
time [s]
Ca [μM]
control variation of influx
variation of binding ratio variation of extrusion rate
binding ratio is plotted over the decay constant of the signal, the data can be fitted by a linear function.
By measuring voltage evoked Ca
2+fluxes in combination with intracellular Ca
2+kinetics, it was possible to determine the decay constants for different, defined dye concentrations. Having determined these dye concentrations, the actual calcium binding ratio (which is computed by the sum of endogenous and exogenous buffers) could be computed. Setting the actual calcium binding ratio for every data point in dependence of the decay constant, the endogenous calcium binding ratio, the amplitude and the decay constant with no exogenous buffer and the extrusion rate could be extrapolated. The total Ca
2+influx was measured with patch‐clamp recordings and the mean resting Ca
2+level was collected from Ca
2+kinetic measurements. Thus, all attributes of an intracellular Ca
2+signal had been determined.
1.2 Calcium imaging of odor evoked responses
Odor discrimination is crucial for the survival of most animals. One experimental system that has very successfully served as a model to understand olfactory information processing is the first synaptic relay (antennal lobe) of the olfactory system of insects (Davis, 2004; Distler and Boeckh, 1998; Fiala, 2007; Hildebrand and Shepherd, 1997; Laurent, 1999; Sakura et al., 2002; Strausfeld and Hildebrand, 1999; Watanabe et al., 2003 ; Wilson and Mainen, 2006).
Olfaction begins with transduction of chemical information into electrical signals
in the olfactory receptor cells (ORCs). Specialized olfactory binding proteins
(OBPs) transport odor molecules through the antennal lymph to receptors in the
membrane of the ORCs. The receptors belong to the G‐Protein coupled receptor
family each of which expresses one receptor type of a multigene family. Upon
binding of the ligand the receptor then transduces the chemical into an electrical signal. The electrical information is projected along the axons of the ORCs into glomeruli in the antennal lobe (AL), areas of high density of synaptic connections.
ORCs expressing the same receptor gene precisely project to the same glomerulus (Buck and Axel, 1991; Gao et al., 2000; Ressler et al., 1994; Wang et al., 2003). The glomeruli are the first synaptic relay in the olfactory pathway and serve as the
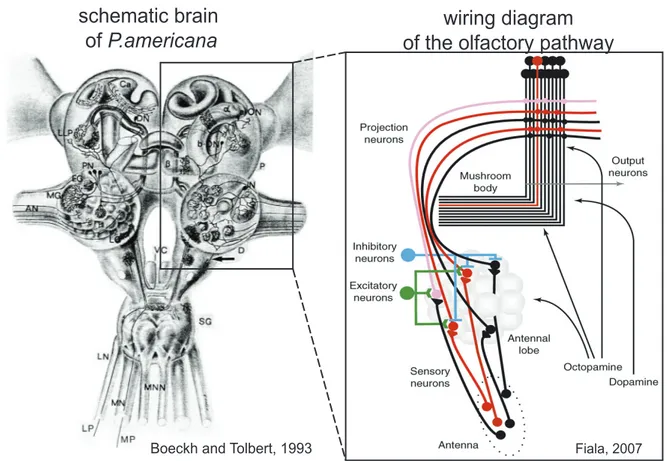
Figure 2: Olfactory pathways in the insect olfactory system
(left side) Chemosensory pathways in the brain and the suboesophageal ganglion of Periplaneta americana taken from (Boeckh and Tolbert, 1993). AN: antennal nerve, D: deutocerebrum, DN:
descending neuron, EG: glomerulus with cineole‐sensitive projection neuron, IN: local interneuron LG:
lobus glorneratus, LLP: lobus lateralis protocerebralis, LN: labial nerve, MG: macroglomerulus, MN:
maxillary nerve; MNN: mandibular nerve, P: protocerebrum, SG: suboesophageal ganglion, T:
tritocerebrum, VC: ventral nerve cord, α: α‐lobe of corpus pedunculatum, β: β‐lobe of corpus pedunculaturn. (right side) Schematic wiring diagram of the olfactory pathway (using the example of Drosophila). Odors are perceived by sensory neurons on the antenna, which project to invariant glomeruli in the antennal lobe. Activated neurons are depicted in red. The antennal lobe network includes local inhibitory and excitatory neurons, which transform olfactroy information so that PNs respond to a broader range of odorants compared to sensory neurons (i.e. the pink PN). Taken from (Fiala, 2007).
Fiala, 2007
schematic brain
of P.americana wiring diagram
of the olfactory pathway
Boeckh and Tolbert, 1993
primary olfactory information processing center (Reviewed in (Hildebrand and Shepherd, 1997)). In Periplaneta americana, there are 100,000 olfactory receptor cells (Boeckh, 1974) whose axons innervate the antennal lobe. This information is processed by about 500 local interneurons (LNs) in the 125 olfactory glomeruli (Boeckh and Ernst, 1987). Arborizations of the local interneurons are confined to the antennal lobe, interconnecting glomeruli (Christensen et al., 1993). The sensory information is then relayed to higher order brain centers by about 150 projection neurons (PNs) projecting through the inner antenno‐cerebral‐tract (iACT) (Boeckh and Ernst, 1987). Most of these projection neurons have arborizations in individual glomeruli of the antennal lobe and send axons to the mushroom body and the lateral lobe of the protocerebrum (Malun et al., 1993). Fig. 2 illustrates these chemosensory pathways in general and the wiring of the main neuron types in detail.
How is olfactory information processed in the antennal lobe? Several authors propose that a certain odor evokes a topographic map in the antennal lobe and in higher brain centers, meaning that the recognition of an odor was coded in spatial patterns (Galizia et al., 1999; Wong et al., 2002; Wang et al., 2003). According to this view a certain odor elicits activity in specific ORCs, each of which converges to one specific glomerulus. A topographic map of receptor activity in the periphery is therefore represented in the antennal lobe (Wang et al., 2003) and is passed on to higher brain centers (labeled‐line) (Wong et al., 2002), with little interactions between glomeruli (Ng et al., 2002; Root et al., 2007).
Recent physiological studies show that the LNs significantly contribute to
information processing by forming a complex network of inhibitory (Distler et al.,
1998; Wilson and Laurent, 2005; Silbering and Galizia, 2007) and excitatory (Olsen
et al., 2007; Shang et al., 2007; Wilson et al., 2004) interactions on the glomerular
level. More and more authors suggest that intereactions between glomeruli are
essential in olfactory processing. Recent studies in honey bees and fruit flies propose two independent inhibitory networks: one is PTX‐sensitive (and therefore GABAergic) and modulates overall AL activity, the other is PTX‐insensitive and glomerulus‐specific (Sachse and Galizia, 2002; Silbering and Galizia, 2007).
Inhibitory connections of the latter network selectively inhibit glomeruli with overlapping response profiles. These selectively inhibited glomeruli donʹt have to be spatial neighbors. The net result is a globally modulated, contrast enhanced and predictable representation of odors in the olfactory output neurons (Sachse and Galizia, 2002; Silbering and Galizia, 2007). Other authors propose that LNs form more heterogeneous interactions by releasing various peptides, biogenic amines or acetylcholine and can also be excitatory (Wilson et al., 2004; Shang et al., 2007;
Olsen et al., 2007). Excitatory interneurons have been found to broaden the response spectra of individual PNs. According to this view, the input to PNs does not come from olfactory sensory neurons alone. Excitatory LNs significantly contribute to broaden PN output compared to the direct sensory input. A complex network of lateral interactions redistributes oder‐evoked activity over a larger ensemble of PNs to broaden their tuning range (Wilson et al., 2004; Bhandawat et al., 2007).
Silbering and Galizia (2007) propose an interaction of excitatory and inhibitory networks, parts of which must be glomerulus specific (Silbering and Galizia, 2007) (for illustration see also Fig. 2). This means, that there have to be LNs capable of preferentially interconnecting a subset of the glomeruli.
While the important role of the LNs for modulating PN output becomes more and
more apparent, still little is known about odor evoked activities in LNs on the
glomerular level. However, this could resolve some of the questions about the
character of glomerular interactions. Therefore, this study looked at odor evoked
activity in individual glomeruli of previously identified LNs of the antennal lobe
of Periplaneta americana. Calcium imaging in combination with patch‐clamp
recordings and physiological odor stimulation were used to monitor glomerular
activity in single LNs.
2 Materials & Methods
2.1 Animals and materials
P. americana were reared in crowded colonies at 27°C under a 13:11 h light/dark photoperiod regimen and reared on a diet of dry dog food, oatmeal and water. The in vitro experiments were performed on adult animals of both sexes, the in situ recordings were performed with adult males. Before dissection the animals were anesthetized by CO
2or cooling (4 °C) for several minutes. For cell culture they where then adhered in a plastic tube with adhesive tape and the heads were immobilized using dental modelling wax (S‐U Modellierwachs, Schuler‐Dental, Ulm, Germany) with a low solidification point (57 °C). For in situ experiments the animals were placed in a custom built holder, and the head was immobilised with dental wax. The antennae were placed in small tubes on a plastic ring that was later used to transfer the preparation to the recording chamber.
All chemicals, unless stated otherwise, were obtained from Aplichem (Darmstadt,
Germany) or Sigma‐Aldrich (Taufkirchen, Germany) with a purity grade of ʹper
analysisʹ.
2.2 Cell culture
To examine the electrophysiological properties of isolated antennal lobe neurons, cells were dissociated and cultured using modified protocols reported previously (Grolleau and Lapied, 1996; Hayashi and Hildebrand, 1990; Kirchhof and Mercer, 1997). The head capsule of anesthetized animals was opened and the antennal lobes were dissected with fine forceps. Typically, ALs from eight animals were pooled in sterile ʹcultureʹ saline (kept on ice) containing (in mM): 185 NaCl, 4 KCl, 6 CaCl
2, 2 MgCl
2, 35 D‐glucose, 10 HEPES and 5% fetal bovine serum (S‐10, c.c.pro, Neustadt, Germany), adjusted to pH 7.2 (with NaOH), which resulted in an osmolarity of ~420 mOsm. For dissociation the ALs were transferred for 2 min at 37 °C into 500 μl Hanks Ca
2+‐ and Mg
2+‐free buffered salt solution (14170, GIBCO, Invitrogen, Karlsruhe, Germany) containing (in mM): 10 HEPES, 130 sucrose, 8 units ml
‐1collagenase (LS004194, Worthington, Lakewood, New Jersey, USA) and 0.7 units ml
‐1dispase (LS02100, Worthington), adjusted to pH 7.2 (with NaOH)
and to 450 mOsm (with sucrose). Dissociation of neurons was aided by careful
titruation with a fire‐polished Pasteur pipette for 3 ‐ 5 min. Enzyme treatment was terminated by cooling and centrifuging the cells twice through 6 ml of culture medium (4 °C, 480 g, 5 min). The culture medium consisted of five parts Schneider’s Drosophila medium (21720, GIBCO) and four parts Minimum Essential Medium (21575, GIBCO) to which was added (in mM): 10 HEPES, 15 glucose, 10 fructose, 60 sucrose, 5% fetal bovine serum adjusted to pH 7.5 (with NaOH) and 430 mOsm (with sucrose). After centrifugation, the cells were resuspended in a small volume of culture medium (100 μl per dish, eight ALs were plated in five to six dishes), and allowed to settle for 2 h to adhere to the surface of the culture dishes coated with concanavalin A (C‐2010, Sigma, 0.7 mg ml
‐1dissolved in H
2O).
The cultures were placed in an incubator at 26°C, and then used for
electrophysiological experiments on the same day. For recordings the cells were visualized with an inverted microscope (IX71, Olympus, Hamburg, Germany) using a 40x water objective (UAPO 40x, 1.15 NA, 0.25 mm WD, Olympus) and phase contrast optics.
2.3 Intact brain preparation
The intact brain preparation was based on an approach described previously
(Kloppenburg et al., 1999a; Kloppenburg et al., 1999b), in which the entire
olfactory network was left intact. The animals were anesthetized by CO
2, placed in
a custom build holder and the head with antennae was immobilized with tape
(tesa ExtraPower Gewebeband, Tesa , Hamburg, Germany). The head capsule was
opened by cutting a window between the two compound eyes and the bases of the
antennae. The brain with antennal nerves and antennae attached was dissected
from the head capsule in ʹnormal salineʹ (see following text) and pinned in a
Sylgard‐coated (Dow Corning Corp., Midland, Michigan, USA) recording
chamber. To gain access to the recording site and facilitate the penetration of
pharmacological agents into the tissue, we desheated parts of the AL using fine
forceps. Some preparations were also enzyme treated with a mixture of papain
(0.3 mg ml
‐1, P4762, Sigma) and L‐cysteine (1 mg ml
‐1, 30090, Fluka/Sigma,)
dissolved in ‘normalʹ saline (~ 3 min, RT). The AL neurons were visualized with a
fixed stage upright microscope (BX51WI, Olympus, Hamburg, Germany) using a
20x water‐immersion objective (XLUMPLFL 20x / 0.95 NA / 2 mm WD, Olympus)
with a 4x magnification changer (U‐TVAC, Olympus) and IR‐DIC optics (Dodt
and Zieglgansberger, 1994).
2.4 Whole cell recordings
Whole‐cell recordings were performed at 24 °C following the methods described by (Hamill et al., 1981). Electrodes with tip resistance between 3‐5 MΩ were fashioned from borosilicate glass (0.86 mm ID, 1.5 mm OD, GB150‐8P, Science Products, Hofheim, Germany) with a temperature controlled pipette puller (PIP5, HEKA‐Elektronik, Lambrecht, Germany). For current clamp recordings and imaging the pipettes were filled with ʹnormal intracellular salineʹ containing (in mM): 220 K‐aspartate, 10 NaCl, 2 MgCl
2, 10 HEPES and 600 μM OGB‐1 (O6806, Molecular Probes, Oregon, USA) adjusted to pH 7.2 (with KOH), resulting in an osmolarity of ~ 415 mOsm. For voltage clamp recordings of Ca
2+currents the pipettes were filled with ʹintracellular calcium salineʹ containing (in mM): 210 CsCl, 10 NaCl, 2 MgCl
2, 10 Hepes and 200 μM fura‐2 (F1200, Molecular Probes) adjusted to pH 7.2 (with CsOH), resulting in an osmolarity of ~420 mOsm. During the experiments, if not stated otherwise, the cells were superfused constantly with ʹnormalʹ saline solution containing (in mM): 185 NaCl, 4 KCl, 6 CaCl
2, 2 MgCl
2, 10 HEPES, 35 D‐glucose. The solution was adjusted to pH 7.2 (with NaOH) and to 430 mOsm (with glucose).
To isolate the Ca
2+currents a combination of pharmacological blockers and ion substitution was used that has been shown to be effective in central olfactory neurons of the cockroach (Husch et al., 2008) and in other insect preparations (Kloppenburg et al., 1999b; Kloppenburg and Hörner, 1998; Schafer et al., 1994).
Transient voltage‐gated sodium currents were blocked by tetrodotoxin (TTX, 10
‐7M, T‐550, Alomone, Jerusalem, Israel). 4‐aminopyridine (4 x 10
‐3M, 4‐AP, A78403,
Sigma) was used to block transient K
+currents (I
A) and tetraethylammonium (20 x
10
‐3M, TEA, T2265, Sigma‐Aldrich) blocked sustained K
+currents (I
K(V)) as well as
Ca
2+activated K
+currents (I
K(Ca)). To further reduce outward currents the pipette solution contained cesium instead of potassium.
Whole‐cell voltage‐ and current‐clamp recordings were made with an EPC9 patch‐
clamp amplifier (HEKA‐Elektronik) that was controlled by the program Pulse (version 8.63, HEKA‐Elektronik) running under Windows. The electrophysiological data were sampled at intervals of 100 μs (10 kHz). The recordings were low pass filtered at 2 kHz with a 4‐pole Bessel‐Filter.
Compensation of the offset potential and capacitive currents was performed using the ‘automatic mode’ of the EPC9 amplifier. Whole cell capacitance was determined by using the capacitance compensation (C‐sow) of the EPC9. The calculated liquid junction potential between intracellular and extracellular solution (see Neher, 1992) of 17 mV for ʹnormal intracellular salineʹ and of 4.8 mV for
ʹintracellular calcium salineʹ (calculated with Patcherʹs‐Power‐Tools plug‐in from
http://
www.mpibpc.gwdg.de/ abteilungen/ 140/software/index.html for Igor Pro
(Wavemetrics, Portland, Oregon, USA)) was also compensated. To remove uncompensated leakage and capacitive currents, a p/6 protocol was used (see Armstrong and Bezanilla, 1974). Voltage errors due to series resistance (R
S) were minimized using the RS‐compensation of the EPC9. R
Swas compensated between 30% and 70% with a time constant (t) of 2 μs. Stimulus protocols used for each set of experiments are provided in the results.
2.5 Fluorimetric calcium measurements
2.5.1 Imaging setup
The imaging setup for fluorimetric measurements consisted of an
Imago/SensiCam CCD camera with a 640x480 chip (Till Photonics, Planegg,
Germany) and a Polychromator IV (Till Photonics) that was coupled via an optical fibre into an IX71 inverted microscope or a fixed stage BX51 WI upright microscope (both from Olympus, for details see above). The camera and the polychromator were controlled by the software Vision (version 4.0, Till Photonics) run on a Windows PC.
2.5.2 Imaging with fura‐2
For the analysis of Ca
2+dynamics (fist part of this study, see chapter 3.2) intracellular Ca
2+concentrations were measured using the Ca
2+indicator fura‐2 which is suitable for calibrated, ratiometric measurements to determine absolute Ca
2+concentrations (Grynkiewicz et al., 1985; Poenie, 1990). The neurons were loaded with fura‐2 via the patch pipette (200 μM in the pipette) and illuminated during data collection with 340nm, 360nm or 380nm light from the polychromator that was reflected onto cells with a 410 nm dichroic mirror (DCLP410, Chroma, Gräfeling, Germany). Emitted fluorescence was detected through a 440 nm long‐
pass filter (LP440). Data were acquired as 40x30 frames using 8x8 on‐chip binning for fast kinetic measurements and 80x60 frames using 4x4 binning for slow loading measurements. Images were recorded in analog‐to‐digital units (adu) and stored and analyzed as 12 bit grayscale images. For all calculations of kinetics, the mean value of adu within regions of interest (ROI) from the center of the cell bodies were used.
Calibration
Absolute Ca
2+concentrations were determined from the raw fluorescence data
according to the approach from (Grynkiewicz et al., 1985), where the intracellular
Ca
2+concentration is described as:
[Ca2+]i=Kd , Fura⋅F380min
F380max⋅R−Rmin
Rmax−R
(1)
[Ca
2+]
iis the intracellular Ca
2+concentration for the fluorescence ratio R measured at 340 nm and 380 nm excitation. R
minis the ratio at a Ca
2+concentration of virtually
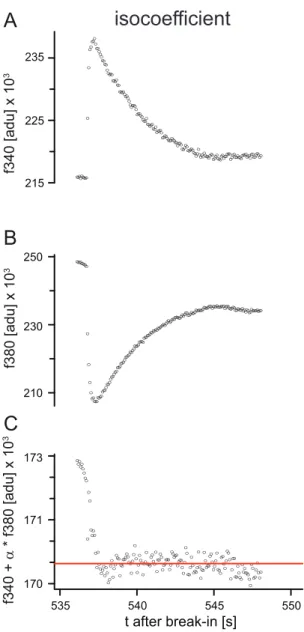
Figure 3: Determination of isocoefficient
To determine the actual dissociation constant of the Ca2+ indicator fura‐2, the isocoefficient α needs to be known. The isocoefficient is found by eliciting a Ca2+ transient, which is monitored at 340 nm excitation (A) (fluorescence rises upon Ca2+ influx) and 380 nm excitation (B) (fluorescence decreases upon Ca2+
influx). The isocoefficient is then the factor that makes the sum Fi = F340 + α F380 independent of Ca2+
(C). In this study I found that Fi becomes independent of Ca2+ (horizontal line in (C)) when the transient is analyzed after the peak.
f340 [adu] x 103f380 [adu] x 103f340 + α * f380 [adu] x 103
t after break-in [s]
A
B
C
●●●●●●●●●
●
●
●●●●●
●
●●●●●
●●
●●
●●●●●
●●●●
●●
●●●●●●●●●●●●●●●
●●●●●●●●●
●●●●●
●●●
●●●●●
●●●●●●●●●●●●●●●●●
●●●●●
●●●●●●●●●●
●●●●●●●●●●●●
●●●●●●●●●●●●●●●
●●●●●●●●●●●●●●●●●●●●●●●●●●●
215 225 235
●●●●●●●●●
●
●
●
●
●●●●●●●●●●●●●●●●●●●●●●●●●●●●●●●●●●●●●●●●●●●●●●●●●●●●●●●●●●●●●●●●●●●●●●●●●●●●●●●●●●●●●●●●●●●●●●●●●●●●●●●●●●●●●●●●●●●●●●●●●●●●●●●●●●●●●●●●●●●●●●●●●●●
210 230 250
●●●
●●
●●
●●
●
●
●
●
●●
●
●
●
●
●●
●●●
●
●
●
●●
●●
●
●●
●●●
●
●●
●●●●●
●●
●
●
●
●
●
●
●
●
●●
●
●●
●
●●●
●●
●●
●
●
●●
●●
●●●●●●
●●
●●●●●
●●●●
●
●
●
●
●
●●
●
●
●
●●●●
●
●
●
●●
●
●
●●●
●●
●
●●●
●
●●●
●●
●●
●
●●
●
●
●
●●
●●
●
●
●●
●
●●
●●●
●
●
●●
●●
●
●
●
●
●
535 540 545 550
170 171 173
isocoefficient
0 M (i.e. ideally no fura‐2 molecules are bound to Ca
2+). R
maxis the value at saturating Ca
2+concentrations (i.e. ideally all fura‐2 molecules are saturated with Ca
2+). K
d,Furais the dissociation constant of fura‐2 for the given experimental conditions. F380
min/F380
maxis the ratio between the emitted fluorescence of Ca
2+free dye and the emitted fluorescence of Ca
2+saturated dye at 380 nm excitation, reflecting the dynamic range of the indicator.
We used two methods for calibration: a) in vivo (in living cells) and b) in vitro (in solution). For in vivo calibration the effective dissociation constant K
d,Fura,effwas introduced (Neher, 1989) :
[Ca2+]i=Kd , Fura , eff⋅R−Rmin
Rmax−R
(2)
and accordingly:
Kd , Fura , eff=[Ca2+]i⋅Rmax−R
R−Rmin
(3)
For in vitro calibration a correction factor (R
d) for R
maxand R
minhas been suggested to account for environmental differences between the cytoplasmic milieu and in vitro conditions (Poenie, 1990):
Kd , Fura , eff=[Ca2+]i⋅Rmax⋅Rd−R
R−Rmin⋅Rd
(4)
R
dwas determined as described in (Poenie, 1990)
To determine the endogeneous Ca
2+binding ratio the actual dissociation constant (K
d,Fura) has to be known. The relationship between the effective dissociation constant (K
d,Fura,eff) and K
d,Furais given by (Zhou and Neher, 1993):
Kd , Fura=Kd , Fura ,eff
Rmin
Rmax
(5)
α is the isocoefficient, for which the sum
Fit=F340tF380t
(6) is independent of calcium. F340 and F380 are the fluorescence traces measured during a brief Ca
2+excursion. The correct isocoefficient can be chosen as that value of α which minimizes this excursion (Fig. 3). Once the isocoefficient has been determined, the actual K
d,Furacan be calculated from equation 5.
Calibration Solutions
The free Ca
2+concentrations of the calibration solutions were adjusted by using appropriate proportions of Ca
2+and the Ca
2+chelator EGTA. The ability of EGTA to bind calcium is highly dependent on parameters such as ionic strength, temperature, pH and the concentrations of other metals that compete for binding (Harrison and Bers, 1987; Harrison and Bers, 1989). To account for these parameters we calculated the appropriate concentrations by using the program MaxChelator (WinMaxc32 version 2.50, http://www.stanford.edu/~cpatton/
maxc.html), which is based on work of (Bers et al., 1994; Brooks and Storey, 1992;
Patton et al., 2004; Schoenmakers et al., 1992). The necessary amount of Ca
2+, Mg
2+and EGTA was computed to set the free Ca
2+and Mg
2+concentration for the
experimental conditions (22 °C; pH 7.2; ionic strength [without divalent ions and
Ca
2+chelator]: 219 mM for R
minand R
max, 214 mM for R
def). Calibration solutions
were prepared as follows (in mM): R
max:
205 CsCl, 10 NaCl, 2 MgCl
2, 10 HEPES, 10
CaCl
2and 0.2 fura‐2; R
min: 205 CsCl, 10 NaCl, 2.7 MgCl
2, 10 HEPES, 10 EGTA and
0.2 fura‐2; R
def: 200 CsCl, 10 NaCl, 2.4 MgCl
2, 4.1 CaCl
2, 10 HEPES, 10 EGTA and 0.2
fura‐2, yielding a free Ca
2+concentration of 140 nm. All solutions were adjusted to
pH 7.2 with CsOH resulting in an osmolarity of ~430 mOsm (R
max) and ~440 mOsm
(R
min, R
def), respectively.
2.5.3 Imaging with OGB‐1
For the analysis of odor evoked Ca
2+signals in glomeruli of individual local interneurons (second part of this thesis, see chapter 3.3) intracellular Ca
2+signals were measured using the Ca
2+indicator Oregon‐Green‐Bapta‐1 (OGB‐1), which is a single wavelength, high affinity indicator suitable to measure Ca
2+changes. The
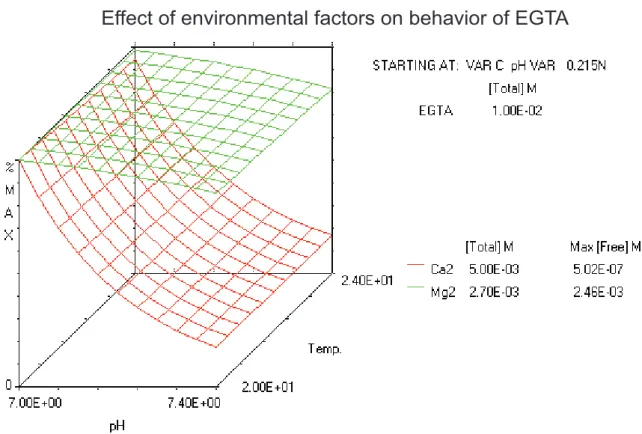
Figure 4: Behavior of EGTA when temperature or pH are changed
The Ca2+ chelator EGTA is used to buffer solutions to a given free Ca2+ concentration, which then are used to calibrate the Ca2+ indicator fura‐2. The Ca2+ chelator EGTA is strongly dependent of environmental changes like pH, temperature and ionic strenght of the buffered solution. 3D‐
calculations of free metal concentrations (Mg2+ and Ca2+) in dependence of variable temperature and pH, while the amount of EGTA, Ca2+, Mg2+ and ionic strength are held constant were done with the MaxChelator program (http://www.stanford.edu/~cpatton/maxc.html). X‐axis shows variable pH from 7 to 7.4, z‐axis shows variable temperature from 20 °C to 24 °C. Ionic strenght was set to 0.215 N.
Added amount of EGTA (10 mM), Ca2+ (5 mM) and Mg2+ (2.7 mM) have also been set constant.
Percent of maximum free metal ion concentration is shown in dependance of variables pH and temperature. Note that small changes in pH lead to dramatic changes in free calcium concentration of the solution. The MaxChelator program has been used to prepare buffered solutions for Ca2+ calibration experiments.