Cellular and molecular mechanisms of sebaceous gland morphogenesis and sebaceous tumour
formation
Inaugural Dissertation zur
Erlangung des Doktorgrades
der Mathematisch-Naturwissenschaftlichen Fakultät der Universität zu Köln
vorgelegt von Daniela Frances
aus Kassel
Köln 2013
Berichterstatter
Prof. Dr. Matthias Hammerschmidt Prof. Dr. Carien Niessen
Tag der mündlichen Prüfung: 14.06.2012
Table of Contents
1) Introduction
... 11.1) The structure of the skin ... 1
1.2) The interfollicular epidermis ... 2
1.3) The hair follicle ... 3
1.3.1) Morphogenesis of the HF ... 4
1.3.2) Cyclic regeneration of the HF ... 7
1.3.3) Stem cells of the HF bulge region ... 8
1.3.3.1) Lineage tracing of HF bulge stem cells (in K15CreER(G)T2 mice) ... 9
1.3.3.2) Expression of bulge stem cell marker Keratin 15 in the skin ... 10
1.3.4) Non-bulge stem and progenitor cell populations of the HF ... 12
1.4) The sebaceous gland ... 12
1.4.1) Morphogenesis of the SG ... 14
1.4.2) Homeostasis and regeneration of the SG ... 15
1.5) Impaired Wnt / β-Catenin signalling leads to skin tumour formation ... 16
1.5.1) Canonical Wnt signalling ... 16
1.5.2) Impact of Wnt / β-Catenin signalling in skin ... 18
1.5.3) K14∆NLef1 mouse model ... 18
1.5.4) K14∆NLef1/L61Rac1 double transgenic mice ... 19
1.6) Aims ... 20
2) Material and Methods
... 212.1) Chemicals and reagents ... 21
2.1.1) Chemicals ... 21
2.1.2) Solutions and buffers ... 22
2.1.3) Antibodies ... 23
2.1.4) Kits ... 23
2.2) Mouse experiments ... 24
2.2.1) Mouse models ... 24
2.2.2) Activation of Cre recombinase ... 24
2.2.3) BrdU / EdU injections ... 25
2.2.4) Tissue preparation ... 25
2.2.4.1) Tissue preparation for paraffin and cryo embedding ... 25
2.2.4.2) Preparation of epidermal whole mounts ... 26
2.3) Tissue analysis and histology... 26
2.3.1) Deparaffinisation ... 26
2.3.2) Haematoxylin and eosin staining ... 26
2.3.3) Immunofluorescence stainings ... 27
2.3.3.1) Immunofluorescence stainings of epidermal whole mounts ... 27
2.3.3.2) Immunofluorescence stainings of paraffin sections ... 27
2.3.3.3) Immunofluorescence stainings of cryo sections ... 28
2.3.3.4) Immunofluorescence staining of cells ... 28
2.3.4) Immunohistochemistry (IHC) ... 29
2.3.5) Alkaline Phosphatase reaction (AP) ... 29
2.3.6) OilRedO staining ... 30
2.4) Micro dissection ... 30
2.5) Molecular Biology ... 32
2.5.1) Genotyping of experimental mice ... 32
2.5.1.1) Isolation of genomic DNA (gDNA) ... 32
2.5.2) Polymerase Chain Reaction (PCR) ... 32
2.5.3) Agarose gel electrophoresis ... 34
2.5.4) Quantitative real-time-PCR ... 34
2.5.5) mRNA isolation and cDNA synthesis ... 35
2.5.6) cDNA-library-generation ... 35
2.5.7) Oligonucleotid array analysis ... 39
2.6) Cell biology ... 40
2.6.1) Isolation of primary keratinocytes ... 40
2.6.2) Cultivation of J2-3T3 fibroblasts and primary keratinocytes... 40
2.6.3) Fluorescence activated cell sorting ... 41
2.6.4) Colony forming assay ... 42
3) Results
... 433.1) Analysis of SG and HF morphogenesis in mouse tail skin ... 43
3.1.1) HFs in mouse tail skin develop in two waves ... 43
3.1.2) HF morphogenesis in tail skin is delayed compared to back skin ... 45
3.1.3) Different HF patterning in back and tail skin ... 46
3.1.4) Two SGs emerge from one cluster of sebocytes ... 48
3.1.5) Proliferation during HF morphogenesis is not confined to a distinct region of the HF ... 49
3.1.6) Spatio-temporal analysis of stem and progenitor cell populations during HF morphogenesis ... 50
3.1.7) Dynamic expression of stem cell markers Lrig1 and Sox9 during HF and SG morphogenesis ... 52
3.2) Cellular mechanisms of SG morphogenesis ... 54
3.2.1) Sebocytes emerge adjacent to Lrig1 expressing cells ... 54
3.2.2) Lrig1 positive stem cells generate sebocytes by asymmetric cell fate decision ... 56
3.2.3) Proliferating Lrig1 positive cells give rise to sebocytes ... 58
3.3) Origin of cells forming HF and SG ... 61
3.3.1) Individual cells are labelled in tail IFE upon embryonic Tam treatment ... 62
3.3.2) Cells originating in the IFE contribute to HF and SG formation ... 63
3.3.3) K15 derived progeny display high proliferative capacity in vitro ... 66
3.4) Influence of Rac1 on sebocyte differentiation in skin tumours ... 69
3.4.1) L61Rac1 alters proliferation and sebocyte differentiation in skin tumours ... 70
3.4.2) Isolation and transcriptional profiling of distinct cell populations from sebaceous tumours ... 72
3.4.3) Verification of selected candidate genes ... 75
3.4.3.1) Down regulation of Scd1, Elov3 and Elovl4 in cells of
K14ΔNLef1/L61Rac1 carcinoma ... 76
3.4.3.2) Decreased expression of 24-Dehydrocholesterol-reductase in K14ΔNLef1/L61Rac1 tumours... 77
3.4.3.3) Reduced Nuclear protein1 expression in cells of K14ΔNLef1/L61Rac1 carcinoma ... 78
4. Discussion
... 804.1) Differences in HF morphogenesis in mouse back and tail skin ... 80
4.2) Formation of HF progenitor compartments ... 82
4.3) Cellular and molecular mechanisms of SG morphogenesis ... 84
4.3.1) A cluster of sebocytes generates two SGs in mouse tail skin ... 86
4.3.2) Lrig1 positive stem cells generate sebocytes ... 88
4.4) Origin of cells forming HF and SG ... 89
4.4.1) Specific targeting of individual IFE cells during skin morphogenesis 90 4.4.2) Progeny of K15 positive IFE cells contribute to HF and SG morphogenesis ... 91
4.4.3) Test for proliferative capacity of K15 derived progeny ... 93
4.5) Role of Rac1 in tumour formation ... 93
4.5.1) Activation of Rac1 leads to decreased sebocyte differentiation in skin tumours ... 94
4.5.2) Gene expression profile is altered in cells of K14ΔNLef1/L61Rac1 carcinomas ... 95
4.6) Perspectives... 98
5) Summary
... 1006) Zusammenfassung
... 1027) References
... 1048) Figure index
... 1189) Table index
... 12010) List of abbreviations
... 12111) Annex
... 12312) Curriculum vitae
... 127
1) Introduction
1.1) The structure of the skin
The skin constitutes the largest organ of the body and protects the organism against environmental assaults such as UV irradiation, pathogens and mechanical stress. Balancing water and electrolyte influx and efflux, the skin prevents the body from dehydration. In addition, the skin has thermoregulatory and sensory function (Lüllmann-Rauch, 2003).
Mammalian skin is a complex organ consisting of several layers (Fig. 1). The epidermis is the outermost layer creating a barrier against the environment. It comprises interfollicular epidermis (IFE) with associated hair follicles (HFs) and sebaceous glands (SGs). The underlying dermis provides nutrients to the epidermis and stimulates proliferation. The subcutis contains adipocytes and serves as nutrient storage for epidermis and dermis (Montagna, 1974b).
Fig. 1) The structure of the skin. Epidermis, dermis and subcutis are the three main layers of the skin. IFE = interfollilcular epidermis, SG = sebaceous gland, HF = hair follicle. Arrowheads point to sebaceous glands. Scale bar = 50 µm.
1.2) The interfollicular epidermis
The IFE renews constantly throughout life. Cells originating from the basal layer transit the different layers of the epithelium. A tight balance has to be maintained between proliferation in the basal layer and cell death in the cornified layer.
The multilayered stratified epithelium of the IFE is separated from the dermis by a basement membrane (Fig. 2). The basement membrane consists of proteins secreted by epidermal keratinocytes and dermal fibroblasts (Burgeson and Christiano, 1997; McMillan et al., 2003). Undifferentiated, proliferatively active keratinocytes are attached to the basement membrane constituting the stratum basale (Simpson et al., 2011). Basal keratinocytes express the intermediate filaments Keratin (K) 5 and K14. During early postnatal development also K15 expression can be detected (Liu et al., 2003; Nelson and Sun, 1983). Upon terminal differentiation, keratinocytes stop proliferation and detach from the basement membrane and are moved into the stratum spinosum (Fig. 2). Keratin expression switches from K5 and K14 to K1 and K10 forming a stronger intermediate filament network (Fuchs and Green, 1980). Cells of the stratum granulosum express further structural proteins like filaggrin and loricrin. These are deposited beneath the plasma membrane functioning as scaffold for lipid bilayers important for maintaining the barrier function of the IFE (Blanpain and Fuchs, 2009; Candi et al., 2005). Finally, cells of the stratum granulosum form the outermost layer of the IFE, the stratum corneum (cornified layer). These cornified dead cells are eventually shed off.
Fig. 2) The interfollicular epidermis. The IFE comprises four different cell layers (stratum basale, stratum spinosum, stratum granulosum, stratum corneum).
1.3) The hair follicle
The HF (Fig. 3 A) is an appendage of the IFE. In general, it comprises a hair shaft and one or two SGs, depending on the type of HF. HFs comprise their own stem cell population localised in the permanent part of the follicle in a region called bulge.
The non-permanent part of the HF undergoes cycles of growth (anagen), regression (catagen) and rest (telogen) (Lavker et al., 2003; Muller-Rover et al., 2001) (see 1.3.2 and Fig. 3) and regenerates in a cyclic manner throughout adult life (Hardy, 1992).
Like the IFE, the HF consists of different cellular layers (Fig. 3 B). The outer root sheath (ORS) contains proliferating basal keratinocytes. In the so called bulb at the lower part of the HF, proliferating transit amplifying cells are localised giving rise to cells of the 4 layers of the inner root sheath (IRS) and the 3 layers of the hair shaft (Krause and Foitzik, 2006; Rogers, 2004; Schneider et al., 2009). Cell type specification of the different cell layers of the IRS and the hair shaft occurs at the basis of the HF.
In mouse pelage fur, four types of HFs exist (Sundberg, 1994). Guard HF make up 1-3 % of the mouse fur and produce long tylotrich hairs that have also sensory function. Awl hairs constitute about 30 % of the mouse coat and are approximately half as long as the guard hairs. The most abundant hair type in the mouse coat are zigzag hairs (65 -70%). Zigzag hairs are as long as awl hairs but contain up to four bends. Auchene hairs are present at a very low frequency in mouse fur (0.1 %). They contain two to four medulla columns (innermost layer of the hair shaft) like awl hairs and are bended once resembling zigzag hairs (Duverger and Morasso, 2009).
The HF is formed during embryogenesis and early postnatal development in mice (Hardy, 1992).
Fig. 3) The hair follicle. A) epidermal whole mount preparation stained with haematoxylin and OilRedO; different compartments are shown: B = bulge, HF = hair follicle, HS = hair shaft, JZ = junctional zone, SG = sebaceous gland, UI = upper isthmus. B) Different cell layers of the HF, IRS = inner root sheath, ORS = outer root sheath, CTS = connective tissue sheath. From Schneider et al, 2009.
1.3.1) Morphogenesis of the HF
Morphogenesis of the HF starts during embryonic development around embryonic day (E) 14.5 (Duverger and Morasso, 2009). A series of signals exchanged between the epidermis and the underlying mesenchyme is preceding the formation of HFs (Fuchs, 2007; Hardy, 1992; Millar, 2002). A first mesenchymal signals including FGFs and BMP inhibitory factors (Botchkarev et al., 1999; Petiot et al., 2003) defines were epidermal thickenings, so called placodes are formed. The epidermis emits Wnt signals back to the mesenchyme inducing the assembly of dermal cells (dermal condensate) beneath the placode (DasGupta and Fuchs, 1999; Gat et al., 1998). The dermal condensate sends a second dermal signal to the placode initiating down growth of the epithelium into the dermis to form a HF.
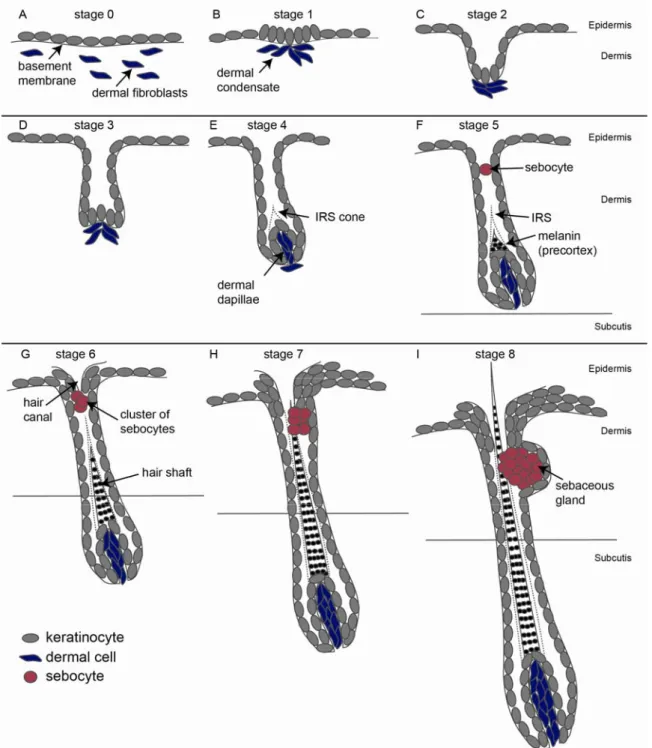
HF morphogenesis can be sub divided into distinct stages. Each stage describes morphological and histological events (Hardy, 1951; Hardy, 1992; Paus et al., 1999). At stage 0 of HF morphogenesis, no thickening can be seen in the epidermis (Fig. 4 A). However, expression of TGFβRII at future sites of HF formation can be visualized by immunohistochemistry (Paus et al., 1999). Stage 1 of HF morphogenesis is marked by condensation of epidermal keratinocytes forming a placode (Fig. 4 B). The dermal condensate can be visualized below the placode by alkaline phosphatase reaction (see 2.3.5). HFs at stage 2 of morphogenesis are clearly distinguishable as an elongation of the epithelium into the mesenchyme forming the hair germ (Fig. 4 C). The dermal condensate forms a cap like structure below the hair germ. When the HF enters stage 3 of morphogenesis, keratinocytes of the lower part enclose the dermal condensate forming the dermal papillae (DP) (Fig. 4 D). At stage 4 of HF morphogenesis the DP is longer than wide (Fig. 4 E). Above the DP, formation of the IRS starts (IRS cone, Fig. 4 E). HFs at stage 5 of morphogenesis display an elongated IRS and melanin granules are visible at the precortex (Fig. 4 F). The DP is almost completely enclosed by keratinocytes of the HF. First lipid producing sebocytes of the future SG can be visualised by staining with OilRedO. At stage 6 of HF morphogenesis, a cluster of sebocytes can be seen at the upper part of the HF (Fig. 4 G). The hair canal becomes visible at the transition of the HF and the IFE (infundibulum) and a hair shaft is formed within the IRS. In HFs at stage 7 of morphogenesis the tip of the hair shaft reaches the hair canal (Fig. 4 H). At the last stage of HF morphogenesis (stage 8), the hair shaft emerges through the IFE and the HF attains its maximal length.
In murine back skin, four different types of HFs (1.3) are formed in three distinct waves of HF morphogenesis (Duverger and Morasso, 2009). Placodes forming guard hairs are first detected at E14.5. Awl and Auchene HFs are induced at E16.5 and zigzag HFs are the last to be formed at E18.5. Thus, back skin of mice at postnatal (P) 0.5 or P1.5 displays a mixture of HFs at different stages of development.
Once HF morphogenesis is completed, the lower part of the HF enters the cyclic renewal and undergoes phases of regression (catagen), rest (telogen) and growth (anagen). These phases are tightly controlled by diverse signalling events.
Fig. 4) Morphogenesis of the HF. (modified from Paus, 1999). A-I) Stage 0 to stage 8 of HF morphogenesis. Keratinocytes are marked in grey, dermal fibroblasts are shown in blue and sebocytes are depicted in red. IRS = inner root sheath.
1.3.2) Cyclic regeneration of the HF
Following morphogenesis, the HF enters the regression phase (catagen) (Fig. 5).
Cells of the lower portion of the HF undergo apoptosis; the HF shortens aand becomes reduced to an epithelial strand. Due to degeneration of the HF, the DP is brought in close proximity to the HF bulge. At the end of catagen, a cell population called the secondary hair germ (sHG) becomes visible between the bulge and the DP (Lyle et al., 1999; Muller-Rover et al., 2001; Panteleyev et al., 2001).
Once catagen is completed, the HF remains in a resting phase (telogen) where HF stem cells are thought to be quiescent. By the end of telogen, HF stem cells become activated by mesenchymal Wnt- and TGFβ-signals from the DP (Enshell-Seijffers et al., 2010; Greco et al., 2009; Oshimori and Fuchs, 2012;
Rendl et al., 2008). It has been shown that cells of the sHG respond faster to mesenchymal signals and start proliferation to generate cells for the formation of a new HF. With a delay of several days, cells of the bulge become eventually activated at the beginning of a new growth phase (anagen) (Greco et al., 2009;
Hsu et al., 2011; Jaks et al., 2008). During anagen, HF stem cells give rise to transit-amplifying cells possessing the ability to undergo a limited number of cell divisions. SC progeny moves to the matrix at the basis of the HF to provide cells of the different layers of the HF (Fig. 3). Once matrix cells cease to proliferate, a new catagen phase starts followed by telogen. With the next anagen phase, the hair cycle starts again.
Clearly, BMP- and Wnt- signalling regulate quiescence and activation of HF stem cells. During telogen, active BMP signalling keeps the HF stem cells in a quiescent state. The repression of BMP signalling and active Wnt signalling leads to activation of HF stem cells (Blanpain et al., 2004; Horsley et al., 2008;
Kobielak et al., 2007; Rendl et al., 2008). More recently, it has been proposed that cells of the DP emit TGFβ2 repressing active BMP signalling and thus, leading to activation of sHG cells (Oshimori and Fuchs, 2012). For induction of catagen, FGF5 was shown to play a key role (Hebert et al., 1994; Paus and Foitzik, 2004; Stenn and Paus, 2001).
Fig. 5) The hair cycle. Adult HFs undergo cycles of growth (anagen), regression (catagen) and rest (telogen). From Fuchs, 2007.
1.3.3) Stem cells of the HF bulge region
The best characterised HF stem cell compartment is the bulge region located in the upper non cycling part of the HF. Bulge stem cells have the ability to retain a BrdU label over a long period of time, indicating their slow cycling character (label retaining cells, LRC) (Cotsarelis et al., 1990; Lavker et al., 2003; Tumbar et al., 2004). Furthermore, several molecules including K15 (Keratin 15), CD34, Lhx2 (LIM/homeobox protein2), Sox9 (SRY box9), Tcf3 (T-cell factor3) and NFATc1 (Nuclear factor of activated T-cells, cytoplasmic1), have been described to be expressed by cells in the bulge region of HFs (Fig. 7) (Horsley et al., 2008;
Liu et al., 2003; Lyle et al., 1998; Merrill et al., 2001; Nguyen et al., 2006; Nowak et al., 2008; Rhee et al., 2006; Trempus et al., 2003; Vidal et al., 2005). A sub population of the telogen bulge and the sHG expresses Lgr5 (leucine-rich repeat- containing G-protein coupled receptor) (Jaks et al., 2008).
Bulge stem cells have been isolated by FAC-sorting via CD34+/Igtα6high expression. In transplantation assays, the isolated HF stem cells were able to regenerate all epidermal lineages, including HF, SG and IFE (Blanpain et al., 2004). Moreover, it could be demonstrated that HF stem cells contribute to IFE in wounding experiments (Ito et al., 2005; Levy et al., 2007).
Altogether, these studies demonstrate that the bulge region of the HF contains multipotent stem cells able to reconstitute all lineages of the epidermis.
1.3.3.1) Lineage tracing of HF bulge stem cells (in K15CreER(G)T2 mice)
Lineage tracing provides a powerful tool to study the progeny of stem cells within a tissue. Therefore, stem cells are labelled with a stable marker that is transmitted to the progeny of the originally labelled cell (Kretzschmar and Watt, 2012).
During the past years, it was demonstrated by several lineage tracing approaches that stem cells of the HF are able to reconstitute HF and the SG (Morris et al., 2004; Panteleyev et al., 2000; Petersson et al., 2011; Snippert et al., 2010b; Taylor et al., 2000).
Previously, it had been demonstrated that cells in the HF bulge express K15 protein (Lloyd et al., 1995; Lyle et al., 1998; Lyle et al., 1999). Moreover, expression of the K15 regulatory promoter sequence could be specifically localised to the bulge region in adult mice (Liu et al., 2003; Morris et al., 2004).
To perform lineage tracing of HF bulge stem cells, this promoter region was used to drive an inducible Cre recombinase, fused to a modified ligand binding domain of the human oestrogen receptor carrying a triple mutation in G400V/M543A/L544A (CreER(G)T2) (Forde et al., 2002; Indra et al., 1999;
Petersson et al., 2011). Upon application of the oestrogen analogue Tamoxifen (Tam) cytoplasmic Cre recombinase in K15 positive cells translocates to the nucleus and becomes active.
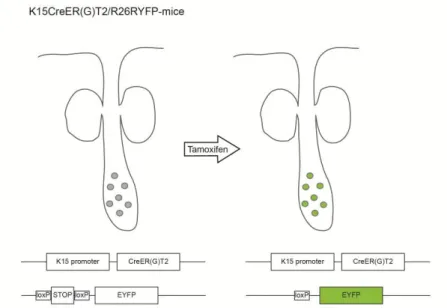
K15CreER(G)T2 mice were crossed to R26REYFP-reporter mice (Srinivas et al., 2001). In these mice, a floxed STOP-cassette is localised ahead of the EYFP- (enhanced yellow fluorescent protein) gene within the Rosa26 locus. Cre recombinase activity deletes the STOP-cassette leading to constitutive expression of EYFP in cells expressing Cre (Fig. 6). As the deletion is irreversible, not only the K15 positive cells but also all daughter cells constitutively express EYFP. Upon treatment of K15CreER(G)T2/R26REYFP mice with a low dose of Tam, individual YFP positive cells can be detected in the bulge region of the HF (Petersson et al., 2011). By performing lineage tracing for different periods of time, it was demonstrated that cells originating in the HF bulge contributed to regeneration of the SG. This occurred independently from hair cycling (Petersson et al., 2011).
Thus, this mouse model constitutes a useful tool to study HF stem cell dynamics in adult mouse skin.
Fig. 6) K15CreER(G)T2 mouse model. Cre recombinase can be activated in individual bulge stem cells upon treatment with Tamoxifen.
1.3.3.2) Expression of bulge stem cell marker Keratin 15 in the skin
K15 expression is not confined to the bulge at all time points during skin morphogenesis and homeostasis. It was shown that the K15 promoter fragment used for the generation of K15CreER(G)T2/R26REYFP mice was also
expressed in cells of the epidermis during neonatal development (Liu et al., 2003). Expression of LacZ, driven by the K15 promoter, could be detected at P2.5 and 3.5 within the epidermis. At P5.5, LacZ expression diminished and was no longer detectable in the epidermis by P16.5. However, LacZ expression was specifically localised in the bulge region by P16.5 (Liu et al., 2003).
Interestingly, K15 protein could first be detected at E15.5 in mouse back skin (Nöbel, 2009). Detection of K15 protein during embryogenesis indicates that the K15 promoter is already active as early as E15.5 and potentially even before in mouse back skin. Therefore, K15CreER(G)T2/R26REYFP mice could be used for lineage tracing analyses during HF and SG morphogenesis.
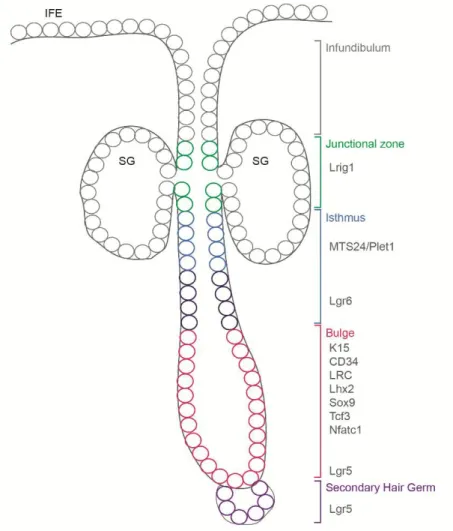
Fig. 7) Stem and progenitor cell populations of the adult HF. The junctional zone (green), the isthmus (blue/dark blue), the bulge region (red) and the secondary hair germ (violet) contain stem and progenitor cells implicated in regeneration of the HF and the SG
1.3.4) Non-bulge stem and progenitor cell populations of the HF
Besides the bulge, other progenitor compartments have been described during the past years (Fig. 7). The HF region above the bulge and below the SG is termed upper isthmus. Cells located in this area are recognised by the MTS24- antibody (mouse thymic stroma24) (Nijhof et al., 2006). Recently, the corresponding antigen, Plet1 (placenta-expressed transcript 1 protein), has been discovered (Depreter et al., 2008). Cells of the upper isthmus were clonogenic in culture and their gene expression profile showed overlap with bulge stem cells (Jensen et al., 2008b). Another stem cell population, marked by the expression of Lgr6 (leucine-rich repeat-containing G protein-coupled receptor 6) also locates to the isthmus region. Lineage tracing showed that these cells were capable of regenerating IFE and SG (Snippert et al., 2010b).
A further stem cell population was described residing in the region next to the SG, the so called junctional zone. Cells in this area of the HF express Lrig1. It was suggested that Lrig1 positive cells were able to reconstitute IFE and SG (Jensen et al., 2009).
1.4) The sebaceous gland
The SG is a holocrine gland mostly attached to HFs (Montagna, 1974a). In skin, SGs are generally associated with HFs and localise to the upper, permanent part (Schneider et al., 2009). In mouse skin, HFs of different regions of the body contain either one or two SGs. In mouse tail skin, two large SGs are attached to each HF, whereas most back skin HFs harbour one SG (Duverger and Morasso, 2009).
Furthermore, specialised SGs, not associated with HFs, exist. For example Meibomian glands in the eyelid have been described (Knop et al., 2009; Knop and Knop, 2009; Thody and Shuster, 1989).
To date, the function of the SG is not completely understood. It is known that SGs produce lipids preventing the skin from dehydration and to maintain an intact epidermal barrier (Schneider and Paus, 2009; Thody and Shuster, 1989).
Moreover, analyses of SG deficient (asebia) mouse models have demonstrated
that HFs are destroyed in absence of functional SGs (Josefowicz and Hardy, 1978; Sundberg et al., 2000). This is also observed in human patients with scarring alopecia which characteristically start with SG ablation (Sundberg et al., 2000). These observations suggest that SGs have important function in maintenance of the pilosebaceous unit consisting of HF and SG.
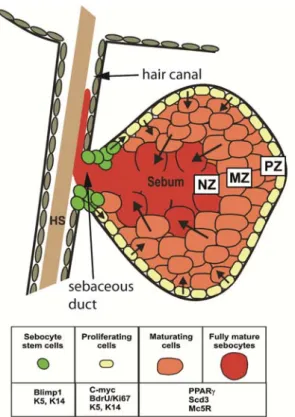
SGs consist of three distinct cellular regions, the peripheral, the maturation and the necrosis zone (Fig. 8). Small, proliferatively active cells are located In the peripheral zone of the gland (PZ, Fig. 8). These are attached to a basement membrane. Constantly, cells from the periphery of the gland are being displaced towards the centre of the gland, thereby starting differentiation. Sebocytes of the maturation zone (MZ, Fig. 8) produce lipids being stored in the cytoplasm.
Consequently, the cells increase in size. Once the size reaches a maximum, cells of the necrosis zone disintegrate and release their cytoplasmic content (NZ, Fig. 8) (Niemann, 2009; Schneider and Paus, 2009; Thiboutot, 2004). The mixture of lipids and cellular debris, termed sebum, is transported via the sebaceous duct (SD) into the hair canal and to the skin surface (Fig. 8). Sebum serves as protection against dehydration and pathogens (Schneider and Paus, 2009; Thody and Shuster, 1989).
Several components have been described to play a role in regulating the function of the SG. For instance Stearoyl CoA Desaturase 1 (Scd1), an enzyme of the fatty acid metabolism, has key functions in maintenance and proper development of the gland (Binczek et al., 2007; Miyazaki et al., 2001; Sampath et al., 2009;
Sundberg et al., 2000; Zheng et al., 1999). Moreover, Scd1 is already expressed during early SG development and constitutes a reliable marker for sebocytes (Fehrenschild et al., 2012; Frances and Niemann, 2012). Besides Scd1, mature sebocytes express MC5R (Melanocortin 5 Receptor) and PPARγ (Peroxisome proliferator activator-receptor γ) (Zhang et al., 2006). MC5R influences the production and secretion of lipids by sebocytes. Depletion of MCR5 resulted in skin barrier defects (Chen et al., 1997). PPARγ stimulates lipid production of sebocytes (Rosenfield et al., 1998; Rosenfield et al., 1999). Gene knock-out studies suggested that PPARγ is necessary for sebocyte differentiation (Rosen et al., 1999).
The lipids produced by mature sebocytes can be visualised by staining with lipophilic dyes such as OilRedO and Nile Red.
Fig. 8) The Sebaceous gland (SG). The SG contains a proliferative basal layer (PZ), more mature sebocytes in the maturation zone (MZ) and degenerating cells in the necrotic zone (NZ).
HS = hair shaft. (modified from Schneider and Paus, 2009).
1.4.1) Morphogenesis of the SG
SG morphogenesis occurs in association with HF development. The SG develops around P0 as an outgrowth of the ORS of the HF. It has been described that first sebocytes are visible at stage 5 of mouse pelage HF morphogenesis (Paus et al., 1999). During the first postnatal days, a cluster of sebocytes is formed. Around P3 - P4, the glandular structure of the SG, including proliferating basal cells surrounding more differentiated cells becomes visible.
Upon completion of HF morphogenesis, the SG attains its maximal size.
To date, the molecular mechanisms regulating SG morphogenesis are not clear.
It has been demonstrated that Sox9 which is necessary for the specification of early HF stem cells is also required for SG formation. In absence of Sox9 during HF morphogenesis, neither the HF stem cell region nor SGs were formed (Nowak et al., 2008). In addition, it was shown in a lineage tracing approach that Lgr6 positive cells labelled in hair pegs during HF morphogenesis gave rise to cells of the SGs (Snippert et al., 2010b). Moreover, it was proposed that
unipotent progenitor cells expressing the transcription factor Blimp1 are located at the SD. It was suggested that this cell population is established prior sebocyte maturation at the upper developing HF during embryogenesis and early postnatal development (Horsley et al., 2006).
In contrast to the regulation of SG morphogenesis, diverse signalling pathways including Wnt and Hedgehog (HH) have been identified playing a crucial role in the maintenance and regeneration of the gland in adult mouse skin (Allen et al., 2003; Merrill et al., 2001; Niemann et al., 2002; Niemann et al., 2003).
1.4.2) Homeostasis and regeneration of the SG
During the past years, several signalling pathways have been shown to be implicated in homeostasis and differentiation of the SG. It was demonstrated that disturbed Wnt / β-Catenin signalling in basal keratinocytes leads to increased differentiation towards the sebocyte lineage (Merrill et al., 2001; Niemann et al., 2002). C-myc was also shown to be important for proper SG differentiation and maintenance. Proliferating cells of normal human skin express c-myc (Gandarillas and Watt, 1995; Hurlin et al., 1995). However, over expression of c- myc in mouse keratinocytes was shown to result in stimulation of sebocyte differentiation (Arnold and Watt, 2001; Waikel et al., 2001). Enhanced sebocyte differentiation resulting in increased size and number of SGs, was also described by over expressing an activated version of the HH receptor smoothened. In contrast, inhibition of HH signalling by expressing a dominant negative form of the transcription factor Gli2, results in suppression of sebocyte development (Allen et al., 2003; Gu and Coulombe, 2008). Furthermore, analyses of the HH ligand Indian Hedgehog (IHH) in human and mouse epidermis and sebaceous tumours suggested that IHH regulates proliferation and differentiation of sebocytes (Niemann et al., 2003).
To preserve the epidermal barrier function, the cells of the SG constantly differentiate and disintegrate generating sebum. To cope with the resulting high cellular turn over in the gland, sebocytes need to be replenished. To date, it is not fully understood how SGs are regenerated and which cellular compartments of the epidermis play a role in this process. Two hypotheses are currently
discussed. One assumption is that progenitor cells reside in the gland itself to assure the replenishment of cells (Ghazizadeh and Taichman, 2001; Horsley et al., 2006). It was proposed that unipotent progenitor cells marked by the expression of Blimp1 reside at the sebaceous duct (Horsley et al., 2006).
However, analyses in human SGs showed that Blimp1 was expressed by more mature cells of the SG. Therefore, it is debated if Blimp1 marks SG progenitor cells, at least in the human system (Sellheyer and Krahl, 2009).
Another hypothesis describes multipotent HF stem or progenitor cells that migrate upwards and repopulate the SG (Blanpain et al., 2004; Jensen et al., 2009; Morris et al., 2004; Snippert et al., 2010b; Taylor et al., 2000). Indeed it was elegantly shown by lineage tracing analysis following the fate of bulge stem cell progeny. It was demonstrated that cells of the bulge region were able to regenerate the SG (Petersson et al., 2011) (see 1.3.3.1).
1.5) Impaired Wnt / β-Catenin signalling leads to skin tumour formation
1.5.1) Canonical Wnt signalling
A central component of the canonical Wnt / β-Catenin signalling pathway is β- Catenin. Within the cell, β-Catenin is either localised in the cytoplasm or associated with the members of the cadherin family in the adherens junctions of the cell membrane (Huber et al., 1997; Huelsken et al., 1994). Nuclear localisation of β-Catenin is a sign of active Wnt-signalling (Nusse, 2005).
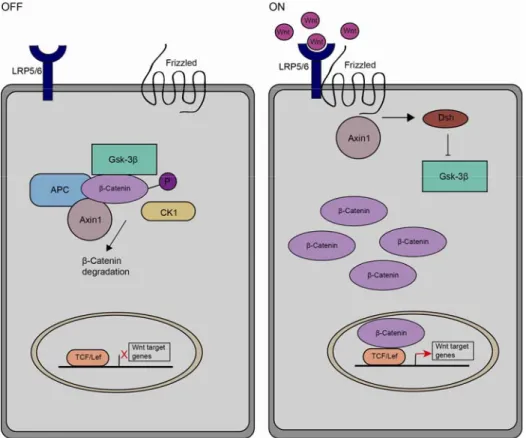
In the absence of the Wnt ligand, cytoplasmic β-Catenin is phosphorylated and targeted for proteasomal degradation by a protein complex comprising Axin1, APC, CK1-α and GSK3β (Fig. 9). If a Wnt ligand is present and binds to the receptor frizzled and its coreceptor LRP, dishevelled gets activated and recruits the degradation complex to the membrane by interacting with Axin1. As a consequence, β-Catenin cannot be phosphorylated and is not targeted for proteasomal degradation. Stabilised β-Catenin accumulates in the cytoplasm and eventually translocates into the nucleus. Here, β-Catenin can bind to members of the transcription factor family TCF/Lef, displacing transcriptional repressors like Groucho or CBP. The β-Catenin-TCF/Lef complex acts as a
transcriptional activator. Upon binding of β-Catenin to TCF/Lef transcription factors, target genes like c-Myc, Cyclin-D1 and E-Cadherin are expressed (Clevers, 2006; Nusse, 2005).
Besides Wnt-ligands, other molecules can activate the pathway. For example R- spondin was shown to potentiate Wnt-signalling (Kazanskaya et al., 2004; Kim et al., 2008). However, it remained unclear which receptor was implicated in active Wnt signalling mediated by R-spondin. Recently, it was shown that R-spondin can bind to Lgr5, Lgr6 and Lgr4 (Carmon et al., 2012; de Lau et al., 2011; Glinka et al., 2011). This family of molecules marks stem cells in different tissues including skin (Barker et al., 2007; Barker et al., 2010; Jaks et al., 2008; Snippert et al., 2010b). Lgr4 and Lgr5 associate with frizzled/LRP receptor complexes, upon binding of R-spondin, Wnt signalling is enhanced.
Fig. 9) The canonical Wnt-signalling pathway. Upon binding of Wnt-ligand to the receptor complex formed by frizzled and LRP, cytoplasmic β-Catenin is stabilized, translocates to the nucleus and can activate target gene transcription (ON). In absence of Wnt, β-Catenin is phosphorylated and targeted for degradation (OFF).
1.5.2) Impact of Wnt / β-Catenin signalling in skin
Wnt / β-Catenin signalling in the skin has been shown to have crucial functions in morphogenesis of the HF (Andl et al., 2002). In absence of canonical Wnt signalling, placode formation is blocked (Huelsken et al., 2001). In contrast, forced expression of stabilized β-Catenin, resulting in enhanced Wnt signalling, leads to precocious and increased HF placode formation (Narhi et al., 2008;
Zhang et al., 2008).
In adult skin, Wnt / β-Catenin signalling is needed to activate stem cells of the HF bulge region to start a new anagen phase after telogen (Lowry et al., 2005;
Stenn and Paus, 2001). Moreover, forced expression of β-Catenin in the epidermis resulted in de novo HF formation (Gat et al., 1998; Lo Celso et al., 2004). Also, canonical Wnt signalling is required for proper hair cycling.
Inactivation of β-Catenin in the DP resulted in premature catagen and disturbed HF regeneration (Enshell-Seijffers et al., 2010). Expression of stabilised β- Catenin in the epidermis leads to precocious induction of anagen (Lo Celso et al., 2004; Lowry et al., 2005; Van Mater et al., 2003).
Furthermore, aberrant Wnt signalling is associated with skin cancer development. Activating mutations of β-Catenin lead to formation of HF tumours (Gat et al., 1998; Lo Celso et al., 2004). Blocking of Wnt / β-Catenin signalling in epidermal cells promotes sebaceous cell fate and squamous differentiation (Merrill et al., 2001; Niemann et al., 2002). Moreover, activating mutations in the β-Catenin gene and inactivating mutations of the transcription factor Lef1 (lymphoid enhancer factor1) are present in human skin tumours (Chan et al., 1999; Takeda et al., 2006)
1.5.3) K14∆NLef1 mouse model
To analyse the function of Wnt / β-Catenin signalling in the skin in more detail, a transgenic mouse model displaying inhibited Lef1 mediated β-Catenin signalling in the epidermis was generated (K14∆NLef1 mice) (Niemann et al., 2002). In these mice, an N-terminally truncated version of the transcription factor Lef1 is expressed in the epidermis. The N-terminus of the Lef1 transcription factor
contains the binding site for β-Catenin. As the binding domain is lacking in K14∆NLef1 mice, β-Catenin can no longer bind to Lef1 and fails to form a transcriptional activator. Target gene expression is therefore repressed. The mutated transcription factor Lef1 is expressed under the control of the K14 promoter. Thus, all basal cells of the IFE, HF and SG express mutant Lef1 and display inhibited Wnt signalling.
K14∆NLef1 mice show severe hair loss starting by the age of six weeks.
Moreover, epithelial cysts derived from HFs are formed and ectopic SG formation along the HF is detected. At about three months of age, K14∆NLef1 mice developed spontaneous benign sebaceous adenomas and sebeomas (Niemann et al., 2002). Sebaceous tumour formation can also be induced by performing a chemical carcinogenesis experiment with K14∆NLef1 mice. It was demonstrated that mutated Lef1 acted as a tumour promoter and specified the type of the developing tumours (Niemann et al., 2007).
1.5.4) K14∆NLef1/L61Rac1 double transgenic mice
Previously, it had been reported that the small GTPase Rac1 plays an important role in maintaining stem cells properties in epidermal cells. Upon deletion of Rac1, epidermal stem cells divided more frequently and underwent terminal differentiation. Activation of Rac1 lead to an expansion of the cell population capable of clonal growth (Benitah et al., 2005).
By crossing L61Rac1 into the background of K14∆NLef1-mice, the effect of active Rac1 on tumour growth, histology and invasiveness in benign tumours should be addressed. Another important aspect to analyse was the potential expansion of progenitor compartments as described by Benitah and colleagues (Benitah et al, 2005).
K14∆NLef1 mice were crossed to mice expressing constitutively active Rac1 (L61Rac1 transgenic mice (Behrendt et al., 2012; Stachelscheid et al., 2008;
Tscharntke, 2006). Double transgenic mice (K14∆NLef1/L61Rac1-mice) did not show obvious histological differences to K14∆NLef1 mice regarding normal skin.
Mice that were subjected to a one-step carcinogenesis experiment developed a comparable number of tumours as K14∆NLef1 control mice (Tscharntke, 2006).
1.6) Aims
HF and SG are two integral parts of the pilosebaceous unit of mammalian epidermis and contribute to formation of an intact epidermal barrier. Progress has been made in our understanding of HF morphogenesis and regeneration. In addition to the stem cells of the HF bulge region, other stem and progenitor compartments have been identified within the HF. However, it is not known when these stem and progenitor cell compartments are established and when they first become activated for tissue formation and regeneration.
Recently, it has been demonstrated that stem cells of the HF bulge region play a role in the process of SG regeneration in adult skin. In contrast, hardly anything is known about the cellular mechanisms involved in SG development.
Therefore, one aim of this thesis is to identify spatio-temporal distribution of HF stem and progenitor cell compartments during SG morphogenesis in neonatal mouse skin. We want to determine the cellular mechanisms of SG morphogenesis in more detail and to identify the stem cell population giving rise to sebocytes. Furthermore, to investigate the origin of cells forming the SG, lineage tracing experiments are performed during morphogenesis.
In addition, during adult skin homeostasis, the small GTPase Rac1 is important for maintenance of the HF stem cell compartment. Activation of Rac1 leads to an expansion of cells capable of clonal growth. To address the role of active Rac1 in SG cell differentiation and skin tumour formation, constitutively active Rac1 was expressed in benign sebaceous skin tumours. From these experiments, we want to get insight into the role of Rac1 in skin tumour formation, differentiation and progression. Therefore, histology and expression of skin stem cell and differentiation markers will be analysed in skin tumours. To understand the potential role of Rac1 in regulating important aspects of progenitor commitment, proliferation and differentiation, gene expression profiles of distinct tumour cell populations will be analysed.
2) Material and Methods
2.1) Chemicals and reagents 2.1.1) Chemicals
Table 1) Chemicals
Reagent Company
Adenine
Sigma, Germany Agarose
Bovine Serum Albumine (BSA) BrdU
Cholera enterotoxin Crystal violet DAPI
DEPC
Dithiothreitol (DTT) EGF
Fish skin gelatine (FSG) Formamid
Glutaraldehyde Hydrocortisone Igepal
Insulin K2HPO4
MgCl2
Mineral oil Mitomycin C
Normal donkey serum (NDS) Nuclear fast red
Normal goat serum (NGS) Propidium iodide (PI) Proteinase K
Rabbit serum (RS) Sunflower oil Tamoxifen Thermolysin Triton X 100 Acetone
Roth, Germany EDTA
Ethanol (EtOH) Formaldehyde HEPES
Methanol (MeOH) NacL
Tris Xylol 2-propanol
DMEM/HAMsF12-medium
Biochrom, Germany PBS (10x)
Penicillin/Streptomycin Glutamine
dNTPs
Roche, Germany NBT/BCIP
tRNA
Mayer’s Heamatoxylin
Merck, Germany Kayser glycerol gelatine
Paraformaldehyde
Eosin AppliChem, Germany
Tween-20
FCS PAA, Germany
FCS Gold mTRAP buffer
Active Motif, Belgium protease
Streptavidin beads PNA
Citrate buffer BioGenex, Germany
OilRedO Amresco
OCT Sakura, Germany
Pertex Leica, Germany
low range marker Fermentas, Germany
EdU Invitrogen, Germany
“Ready to load” enzyme mix BioBudget, Germany
chelex Biorad, Germany
DMEM GIBCO, Germany
Milk powder Heirler
TdT USB
Betaisodona Mundipharma, Germany
2.1.2) Solutions and buffers
Table 2) Solutions and buffers
Solution Composition
10x TAE buffer
0.9 M Tris Ultra 0.89 M Boric acid 20 mM EDTA
1x TAE buffer 100 ml 10x TAE buffer 900 ml dH2O
DMEM / HAMs F12 medium supplemented with
100 IU/ml penicillin 100 µg/ml streptomycin 1.8 x 10⁻⁴ M adenine 0.5 g/ml hydrocortison 10 ng/ml EGF
10-5 M cholera toxin 5 µg/ml insulin
10 % FCS (chelex-100 resin treated)
Lysis buffer
0.2 M NaCl
0.1 M Tris HCl pH 8,5 5 UM EDTA
0.2% SDS 8.4 ml dH2O
add 5 Ul Proteinase K (20mg/ml) before use
Mowiol/DABKO
4.8 g Mowiol 12 g Glycerin 12 ml H2O stirr 3 - 4 h
add 24 ml 0.2 M Tris pH 8 heat to 50 °C and stir overnight add 1.2 g DABKO (2,5%)
2.1.3) Antibodies
The primary antibodies used in this study are listed in Table 3; secondary antibodies are listed in Table 4.
Table 3) Primary antibodies
antigen host dilution reference / company
Adipophilin guinipig 1:3000 Fitzgerald Industries
BrdU mouse 1:10 (sections) BD
BrdU rat 1:500 Oxford Biotech
CD49f-PE
(Itgα6) rat 1:25 BD
GFP chicken 1:3000 / 1:5000 (K14NuMA-GFP
sections) Abcam
GFP-488 goat 1:500 Rockland
K14 rabbit 1:3000 Covance
Laminin rabbit 1:100 Sigma
Lrig1 goat 1:100 / 1:50 (K14NuMA-GFP sections) R&D Systems
MTS24 rat 1:50 (Gill et al., 2002)
P-Cadherin goat 1:250 R&D Systems
Plet1 rat 1:3 (Raymond et al.,
2010)
Scd1 goat 1:150 Santa Cruz
Scd1 rat 1:150 R&D Systems
Sox9 rabbit 1:3000 (Stolt et al., 2003)
Table 4) Secondary antibodies
species conjugate dilution reference / company Anti-chicken Alexa488 1:500 Molecular Probes Anti-goat Alexa488, Alexa594, Cy5 1:500 Molecular Probes
Anti-guinipig Alexa488 1:500 Molecular Probes Anti-mouse (IgG1) Alexa488 1:1000 Molecular Probes
Anti-rat Alexa594, Cy5 1:400 Molecular Probes Anti-rabbit Alexa488, Alexa594, Cy5 1:500 Molecular Probes
Anti-rabbit HRP 1:500 DAKO
HRP = horseradish peroxidase
2.1.4) Kits
Table 5) Kits
Kit Company
Click-It EdU Kit Invitrogen, Germany Expand Long Template Roche, Germany Quanti Tect Reverse Transcriptase Qiagen, Germany RT2RT SYBR Green qPCR Master MIx Super Array
Super Script II First Strand Synthesis Invitrogen, Germany Super Script III First Strand Synthesis
TaqMan gene expression assay Applied Biosystems
2.2) Mouse experiments
All experiments conducted with mice have been performed according to institutional guidelines and animal license given by the State Office of North Rhine-Westphalia, Germany.
The used mouse strains were kept on a C57Bl/6 background.
2.2.1) Mouse models
Table 6 summarises the transgenic mouse models used in this study. In addition, C57Bl/6-mice were applied for most of the experiments.
Table 6) Mouse models applied in this study
Mouse model reference
K15CreER(T2)/R26REYFP (Petersson et al., 2011; Srinivas et al., 2001) K14∆NLef1 (Niemann et al., 2002)
K14L61Rac1 (Behrendt et al., 2012; Stachelscheid et al., 2008; Tscharntke, 2006)
K14NuMAGFP (Poulson and Lechler, 2010)
2.2.2) Activation of Cre recombinase
A single dose of Tamoxifen was injected intraperitoneally (i.p.) into the mice.
Therefore, 1 mg or 2 mg Tamoxifen (Sigma Aldrich) powder was dissolved in 200 µl sun flower oil (Sigma Aldrich) by robust shaking for 1 h at room temperature (Indra et al., 1999). AK15CreER(T2)/R26REYFP-mice received 2 mg of Tamoxifen and mice from the higher expressing CK15CreER(T2)/R26REYFP line were treated with 1 mg Tamoxifen. Tamoxifen is an oestrogen analogue. It is used to activate Cre recombinase fused to a modified oestrogen receptor. Cre normally located in the cytoplasm can translocate into the nucleus and becomes activated. In both mouse lines, activated Cre recombinase leads to the excision of a stop-cassette in front of the EYFP-gene (Fig. 8). Therefore, EYFP can be expressed in all cells with activated
Cre recombinase. As the excision of the stop-cassette is irreversible, all daughter cells also express the EYFP-gene.
2.2.3) BrdU / EdU injections
To mark proliferating cells within the tissue, mice were injected i.p. with 5-bromo- 2'-deoxyuridine (BrdU, Sigma Aldrich, Germany) or 5-ethynyl-2’-deoxyuridine (EdU, Invitrogen, Germany) 1 – 48 h before sacrificing them. BrdU and EdU are base analogues that are incorporated in DNA of dividing cells.
BrdU was used at a concentration of 100 mg/kg bodyweight; EdU was used at a concentration of 40 mg/kg bodyweight.
EdU-incorporation was monitored using the Click-it EdU kit following the manufacturer’s instructions (Invitrogen, Germany). BrdU-incorporation was analysed by antibody staining (see 2.3.3).
2.2.4) Tissue preparation
To analyse HF and SG morphogenesis, skin tissue was prepared from mice between E15.5 and P30. In general, back and tail skin was prepared following the protocols described below.
2.2.4.1) Tissue preparation for paraffin and cryo embedding
Mice were sacrificed and the skin was prepared as described before (Paus et al., 1999). Briefly, back skin was isolated and stretched out on thick paper. Small pieces (about 0.5 cm2) of skin were cut along the longitudinal axis of the HFs.
For tail skin preparation, the tail was cut off the mouse. The tail was sliced open on the ventral side; skin was peeled of the bone and stretched out on thick paper.
Before paraffin embedding, the tissue was fixed for 2h with 4% Formalin/PBS and removed from the paper.
For cryo embedding of skin pieces, the tissue was prepared as described above.
Unfixed tissue was embedded in OCT (Sakura), allowed to freeze slowly in cold isopentane and stored at –80°C.
2.2.4.2) Preparation of epidermal whole mounts
For three-dimensional analysis of the epidermis, whole mounts of mouse epidermis were generated as described before (Braun et al., 2003). Briefly, tail skin was prepared (2.2.4.1) and incubated in 5 mM EDTA at 37°C to allow separation of the epidermis from the underlying dermis. Skin of newborn mice was incubated for 1.5 h whereas skin of adult mice was incubated for up to 3 h.
To prepare epidermal whole mount samples from back skin, the tissue was incubated for 2 h in 20 mM EDTA and separated from the dermis. Epidermal whole mounts were fixed for 1 h in 3.4 % Formaldehyde or 0.2 % glutaraldehyde/
2 % formaldehyde and kept in PBS at 4°C.
2.3) Tissue analysis and histology 2.3.1) Deparaffinisation
Sections of paraffin embedded tissue were deparaffinised before proceeding with stainings. Therefore, sections were incubated two times for 10 min in 100 % Xylol (Roth, Germany). Next, sections were kept two times for 5 min in 100%
EtOH (Roth, Germany) followed by incubation in 95 %, 70 % and 50 % EtOH for 5 min respectively. Before proceeding with the staining protocols, the sections were incubated for 5 min in tab water followed by 5 min in distilled water to wash out residues of EtOH.
2.3.2) Haematoxylin and eosin staining
To visualize the histology of skin sections, deparaffinised sections were stained with haematoxylin and eosin. For nuclear staining, sections were incubated for 1- 3 min in haematoxylin (Merck, Germany) followed by tab water to develop the
staining. After brief washing in distilled water, sections were briefly counter stained with eosin (AppliChem, Germany) to visualise the cytoplasm of the cells.
Next, the sections were incubated shortly in 70 % and 95 % EtOH followed by incubation in 100 % 2-propanol and 100 % xylol. The sections were finally mounted with Pertex (Leica, Germany). Analysis and imaging of the staining was performed with a Leica DM4000B microscope (Leica Mikrosysteme GmbH, Wetzlar) supplied with a KY-F75U digital-camera (JVC Professional Europe Ltd., Frankfurt).
2.3.3) Immunofluorescence stainings
Immunofluorescence stainings were performed on paraffin or cryo sections of mouse skin or on epidermal whole mounts. Nuclear staining was performed for 30 min at room temperature with DAPI (Sigma, Germany) at a concentration of 1µg/ml. Imaging of all immunofluorescence stainings was performed by confocal microscopy (Olympus IX80) supplied with an Olympus LG ESF200 camera unless specified differently.
2.3.3.1) Immunofluorescence stainings of epidermal whole mounts
Epidermal whole mounts were blocked in TB buffer containing 0.5 % milk powder, 0.25 % FSG and 0.5 % TritonX-100 in TBS (20 mM HEPES, pH7.2, 0.9
% NaCl) (Braun et al., 2003). Primary antibodies were diluted in TB buffer and incubated over night at room temperature. Washing steps to remove antibody residues were carried out with 0.02 % Tween (AppliChem, Germany) in PBS.
Secondary antibodies diluted in TB buffer were incubated for 3 h up to overnight.
The dilutions of the antibodies applied are listed in Table 3 and 4.
2.3.3.2) Immunofluorescence stainings of paraffin sections
Paraffin sections were deparaffinised and rehydrated before proceeding with antibody staining (2.3.1). The antibodies used are listed in Table 3 and 4. For staining of tumour tissue, the sections were incubated in citrate buffer
(BioGenex, USA) for 20 min at < 120°C under pressure in the 2100 Retriever (Proteogenix, France) to unmask the antigens. After washing with PBS, sections were incubated in blocking solution (10% RS (Sigma, Germany) in PBS) for 1 h at room temperature. Primary antibodies were incubated over night at 4°C.
Secondary antibodies were incubated for 30 min at room temperature. After each antibody incubation step, washing was performed 3 times for 5 min with PBS.
Sections were mounted with Mowiol/DABKO.
2.3.3.3) Immunofluorescence stainings of cryo sections
Sections of frozen tissue from K14NuMA-GFP mice (7-10 µm) were fixed in 4 % PFA or acetone before proceeding with antibody stainings except for staining with Scd1. Here, fixation was carried out after Scd1 staining was done. Dilutions of the used antibodies are listed in Table 3 and 4; blocking solutions are specified in Table 7. Primary antibodies were incubated over night at 4°C. The primary antibody against GFP was incubated for 15 min at room temperature.
Secondary antibodies were incubated for 30 min at room temperature. Washing was carried out with PBS thrice for 5 min after each antibody incubation step.
Sections were mounted with Mowiol/DABKO.
Table 7) Blocking solutions for immunofluorescence stainings on cryo sections Antibody Blocking solution (in PBS)
GFP (chicken) 3% BSA, 5 % RS, 5 % NDS Laminin 10 % NGS
Lrig1 2.5 % BSA, 0.25 % FSG, 0.1 % TritonX100 Scd1 (goat) 10 % RS
All used ingredients of the blocking solutions were purchased from Sigma, Germany.
2.3.3.4) Immunofluorescence staining of cells
Keratinocytes from K15CreER(T2)/R26EYFP mice were used for colony forming assays (2.6.5). To verify YFP expression after formation of colonies, immunofluorescence staining was performed. PFA-fixed cells (2.6.4) were permeabilised for 10 min with 0.5 TritonX100 in PBS (Sigma, Germany) and
blocked for 1h in 10 % NGS (Sigma, Germany). Antibody against GFP coupled to Alexa488 (1:500, Rockland) was incubated over night and washed off with PBS. Nuclei were stained with DAPI for 10 min at room temperature. After washing with PBS and distilled water, YFP expression was monitored using an Olympus IX80 fluorescence microscope equipped with an IX2-KCB camera.
2.3.4) Immunohistochemistry (IHC)
To visualise the basal layer of the epidermis, K14-IHC was performed on paraffin sections of mouse skin. Sections were deparaffinised and rehydrated. To unmask the antigens, sections were incubated in citrate buffer (Biogenex, USA) at 100°C for 20 min. To inhibit peroxidases within the tissue, the sections were treated for 20 min with 3% H2O2 in MeOH. After blocking with 10 % NGS for 1 h at room temperature, sections were incubated with primary antibody against K14 (1:10000) over night at 4°C. After washing, secondary antibody coupled to horseradish peroxidase (HRP, DAKO Envision) was incubated for 30 min at room temperature followed by detection with AEC substrate (DAKO) for 2-3 min.
To better visualise the histology of the skin sections, brief counter staining with diluted haematoxylin (1:4) was done. Sections were mounted with Kaisers glycerol gelatine. Analyses of the stainings were performed with a Leica DM4000B microscope (Leica Mikrosysteme GmbH, Wetzlar) and pictures were taken with a KY-F75U digital-camera (JVC Professional Europe Ltd., Frankfurt).
2.3.5) Alkaline Phosphatase reaction (AP)
Cells of the dermal papillae and the dermal condensate produce alkaline phosphatase (Handjiski et al., 1994). This enzyme dephosphorylates organic molecules. By adding a substrate for alkaline phosphatase on skin sections, the localisation of the DP or the dermal condensate can be visualised.
Cryo sections (7-10 µm) of mouse tail skin were allowed to dry at room temperature and were fixed in ice cold acetone (-20°C) for 10 min. After washing in 1 x PBS, 20 µl of NBT/BCIP-solution (Roche, Germany) were mixed with 1 ml buffer reaction buffer (0.1 M Tris HCl, pH 9.5, 0.1 M NaCl). Alkaline phosphatase
dephosphorylates BCIP. The resulting product reacts with NBT and forms an insoluble blue dye. After 2-3 min of incubation at room temperature, enzyme activity could be detected as blue precipitation and the reaction was stopped by washing with dH2O. The sections were counter stained with Nuclear Fast Red (Sigma, Germany) and mounted with Kaiser’s glycerol gelatine (Merck, Germany). Images were taken using a Leica DM4000B microscope (Leica Mikrosysteme GmbH, Wetzlar) supplied with a KY-F75U digital-camera (JVC Professional Europe Ltd., Frankfurt).
2.3.6) OilRedO staining
OilRedO staining was used to visualise the lipids produced by mature sebocytes of the SG within the skin. OilRedO (Amresco, Ohio, US) was dissolved in 60 % 2-propoanol by stirring for 1 h at RT to a concentration of 1 %. Before usage, the solution was filtrated. Epidermal whole mounts were equilibrated for 5 min in 60 % 2-propanol and then incubated for 30 min up to 1 h in the OilRedO solution.
After washing in PBS epidermal whole mounts were shortly counterstained with 1:4 diluted haematoxylin (Merck, Germany) and mounted with Mowiol/DABKO.
The stainings were visualised with a Leica DM4000B microscope (Leica Mikrosysteme GmbH, Wetzlar) supplied with a KY-F75U digital-camera (JVC Professional Europe Ltd., Frankfurt).
2.4) Micro dissection
For transcriptional analyses of different tumour cell populations, small pieces of tumour tissue were isolated using laser capture micro dissection. To prepare samples for laser micro dissection, 8 µm cryo sections of tumour tissue were cut with a cryostat (Leica, Germany) and mounted on special slides covered with a membrane facilitating micro dissection (ZEISS, Germany). The sections were kept in 70 % EtOH at -20°C until further usage. To visualise the structure of the tissue, a brief haematoxylin staining was performed. Sections were shortly washed in PBS, followed by distilled water and kept 10 sec in haematoxylin solution. Brief incubation in tap water was performed to develop the staining,
followed by incubation for 1 min in 70 %, 90 % and 100 % EtOH respectively. To avoid RNAse activity, all solutions were prepared with 0.1% DEPC treated water.
Laser micro dissection was performed with a ZEISS Observer.Z1 microscope and a ZEISS PALM MicroBeam laser. Pictures were taken using a Hitachi HV D30 camera Isolated samples were captured in the cap of 0.5 ml micro tube (ZEISS, Germany). The tube cap was coated with 4 µl of mTRAP buffer (Active Motif, Belgium) supplied with 10 ng/µl tRNA (Roche, Germany). The collected tissue samples were directly frozen on dry ice and kept at -80°C until further usage.
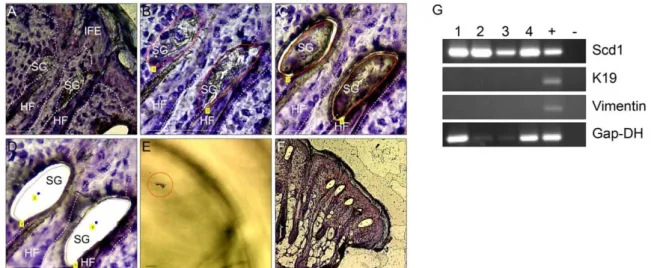
First, the accuracy of the method was tested (Fig. 10). SGs were isolated from cryo sections of mouse back skin. To assure that only SG tissue and no cells of the surrounding HF or dermis were cut out, presence of markers specific for the respective cell population was analysed by PCR (see 2.5.2). As shown in Figure 10, all isolated SG-samples showed strong expression of the sebocyte differentiation marker Scd1. In contrast, the samples were negative for expression of the HF marker K19 and the dermal marker Vimentin. This demonstrates convincingly that laser micro dissection was precise enough to isolate distinct cell populations from skin.
Fig. 10) Isolation of small tissue pieces and RT-PCR. A-F) Microsdissection of SG tissue from wt skin. Area of interest is marked with software (red line in B). Laser cuts along the marked line (C). Area of interest is catapulted away (wholes in D). Piece of tissue is collected in sample tube (red circle in E). Overview of section with area of interest (red circle in F). G) PCR-analysis of four different isolated SGs. IFE = Interfollicular epidermis, HF = hair follicle, SG = sebaceous gland, +
= wt-skin, - = water control. Scale bars: 50 µm.
2.5) Molecular Biology
2.5.1) Genotyping of experimental mice
In order to identify the genotype of mice, tail biopsies were taken from 3 week old animals and proceeded as described below.
2.5.1.1) Isolation of genomic DNA (gDNA)
Tail biopsies were incubated in lysis buffer containing 0.2 M NaCl, 0.1 M Tris / HCl, pH 8.5, 5 μM EDTA, 0.2 % SDS and 100 μg/ml proteinase K (Sigma Aldrich, [39 U/mg]) for 3 h at 55°C and centrifuged for 30 min at 12000 rpm to pellet cellular debris. Supernatant was transferred to a new tube and 2 volumes of 2-propanol were added to precipitate gDNA. After centrifugation at 12000 rpm the gDNA pellet was resuspended in distilled water at 37°C over night and gDNA samples were kept at 4°C.
2.5.2) Polymerase Chain Reaction (PCR)
PCR was used to identify the genotype of mice. Generally, 500 ng gDNA were incubated with 10 pmol of primer pairs (see Table 8), 1U “ready to load enzyme mix” (Bio Budget, Germany) and 1x reaction buffer containing dNTPs (Bio Budget, Germany) in a total volume 25 µl. The PCR program used consisted of an initial denaturation step at 95°C for 5 min, followed by 30-35 cycles of denaturation for 30 sec at 95°C, primer annealing for 60 sec at the appropriate temperature and elongation of the PCR product for 45 sec at 72°C. After a final elongation step for 5 min at 72°C, the samples were kept at 4°C until gel electrophoresis was done to separate the DNA fragments.
Table 8) Genotyping primers
Mouse strain Primer Oligonucleotide 5‘-3‘
R26EYFP (Srinivas et al., 2001)
YFP 1neu CCA AAG TCG CTC TGA GTT GTT ATC YFP 2 GCG AAG AGT TTG TCC TCA ACC YFP 3wt GGA GCG GGA GAA ATG GAT ATG K15CreER(G)T2
(Petersson et al., 2011)
K15 for AGG TGT GCG GGC AGC TGT GTT TGT K15 rev GGA CAT CTT CCC ATT CTA AAC AAC ACC
CTG K14∆NLef1
(Niemann et al., 2002)
dNLef_for_neu TGT CCC TTG TAT CAC CAT GGA CC dNLef_rev CCA AAG ATG ACT TGA TGT CGG CT K14L61Rac1
(Tscharntke, 2006)
SF3 TTG GTT GTG TAA CTG ATC AGT AGG C SF5 TGG AGA GCT AGC AGG AAA CTA GG All primers were purchased from MWG, Germany
Moreover, PCR was used to verify gene expression in cDNA samples from isolated tissue (2.5.5 and 2.5.6). In general, 1 µl of cDNA was used as template and incubated with the same reaction mix as described above. Primers used for detections of cDNA are listed in Table 9. The PCR was carried out applying the program described above.
All PCR reactions were done in TGradient Thermocycler or Personal Thermocycler (Biometra).
Table 9) PCR primers for cDNA samples (conventional and real time PCR) Gene Primer Oligonucleotide 5‘-3‘
GAPDH GAPDH for AAC TTT GGC ATT GTG GAA GG GAPDH rev ACA CAT TGG GGG TAG GAA CA K19 K19 for TGC TGG ATG AGC TGA CTC TG K19 rev AAT CCA CCT CCA CAC TGA CC Scd1 Scd1 for ACA ACT ACC ACA CCT TCC CCT TC
Scd1 rev AGC CCA AAG CTC AGC TAC TCT TGT GAC Vimentin Vimentin for CAG CTC ACC AAC GAC AAG G
Vimentin rev TTC CAC TTT CCG TTC AAG GT Elovl3 Elovl3 for CTG TTG CTC ATC GTT GTT GG
Elovl3 rev GCT TGA GGC CCA CTG TAA AC Elovl4 Elovl4 for GGGATCATACAACGCAGGATA
Elovl4 rev CCA CCA CAG AGT GAA CAT GG 18S rRNA 18S for CCT GCC CTT TGT ACAC
18S rev CGA TCC GAG GGC CTC AC All primers were purchased from MWG, Germany
2.5.3) Agarose gel electrophoresis
To determine the size of PCR amplified DNA fragments, PCR samples were separated on 2 % Agarose (w/v) gels in 1 x TAE electrophoresis buffer at 100 V.
The correct size of the PCR products was identified with the help of a DNA low range marker (Fermentas, Germany).
2.5.4) Quantitative real-time-PCR
Harvested tissue was snap frozen in Trizol (Ambion, Life Technologies, Germany). To isolate RNA, samples were thawed at RT and tissue in Trizol was shred into small pieces using a tissue disintegrator (Janke & Kunkel, Germany).
To purify RNA, the general protocol provided with the Trizol reagent (Ambion, Life Technologies, Germany) was applied according to the manufacturer’s indications. Isolated RNA was dissolved in RNAse free water and kept at -80°C.
To synthesize cDNA, the QuantiTect Reverse Transcriptase Kit (Qiagen, Germany) was used according to the manufacturer’s protocol. CDNA samples were kept at 4°C.
To evaluate the expression levels of various genes, qRTPCR was performed using RT2 RT SYBR Green qPCR Master Mix (SuperArray Bioscience Cooperation, USA) or TaqMan gene expression assays (Applied Biosystems).
For qRTPCR with SYBR green, 5 pmol primer pair was mixed with SYBR green master mix and 1 µl template DNA (cDNA libraries were diluted 1:10) in a total volume of 10 µl (SuperARRAY Biosciences Cooperation, USA). TaqMan gene expression assays were carried out in a total volume of 10 µl per well according to the manufacturer’s instructions (Applied Biosystems).
The real time PCRs were done in 96 well plates and run in a StepOnePlus real time PCR system (Applied Biosystems). The used primers and probes are listed in Table 9 and 10.
The expression levels were calculated relative to expression of 18S rRNA (SYBR green) or GAPDH (TaqMan) using the delta ct method.