Landsat-based lake distribution and changes in western Alaska permafrost regions between the 1970s and 2010s
To cite this article: Prajna R Lindgren et al 2021 Environ. Res. Lett. 16 025006
View the article online for updates and enhancements.
This content was downloaded from IP address 79.140.123.21 on 15/02/2021 at 07:47
OPEN ACCESS
RECEIVED
1 May 2020
REVISED
23 November 2020
ACCEPTED FOR PUBLICATION
10 December 2020
PUBLISHED
29 January 2021
Original content from this work may be used under the terms of the Creative Commons Attribution 4.0 licence.
Any further distribution of this work must maintain attribution to the author(s) and the title of the work, journal citation and DOI.
LETTER
Landsat-based lake distribution and changes in western Alaska permafrost regions between the 1970s and 2010s
Prajna R Lindgren1,∗, Louise M Farquharson1, Vladimir E Romanovsky1and Guido Grosse2,3
1 Geophysical Institute, University of Alaska Fairbanks, Fairbanks, AK, United States of America 2 Alfred Wegener Institute Helmholtz Centre for Polar and Marine Research, Potsdam, Germany 3 University of Potsdam, Institute of Geosciences, Potsdam, Germany
∗ Author to whom any correspondence should be addressed.
E-mail:pregmi@alaska.edu
Keywords:lake change, lake drainage, thermokarst, permafrost, western Alaska, remote sensing, Landsat Supplementary material for this article is availableonline
Abstract
Lakes are an important ecosystem component and geomorphological agent in northern high latitudes and it is important to understand how lake initiation, expansion and drainage may change as high latitudes continue to warm. In this study, we utilized Landsat Multispectral Scanner System images from the 1970s (1972, 1974, and 1975) and Operational Land Imager images from the 2010s (2013, 2014, and 2015) to assess broad-scale distribution and changes of lakes larger than 1 ha across the four permafrost zones (continuous, discontinuous, sporadic, and isolated extent) in western Alaska. Across our 68 000 km
2study area, we saw a decline in overall lake coverage across all permafrost zones with the exception of the sporadic permafrost zone. In the continuous permafrost zone lake area declined by
−6.7% (−65.3 km2), in the discontinuous permafrost zone by
−1.6% (−55.0 km2), in the isolated permafrost zone by
−6.9% (−31.5 km2) while lake cover increased by 2.7% (117.2 km
2) in the sporadic permafrost zone. Overall, we observed a net drainage of lakes larger than 10 ha in the study region. Partial drainage of these medium to large lakes created an increase in the area covered by small water bodies <10 ha, in the form of remnant lakes and ponds by 7.1% (12.6 km
2) in continuous permafrost, 2.5% (15.5 km
2) in discontinuous permafrost, 14.4% (74.6 km
2) in sporadic permafrost, and 10.4% (17.2 km
2) in isolated
permafrost. In general, our observations indicate that lake expansion and drainage in western Alaska are occurring in parallel. As the climate continues to warm and permafrost continues to thaw, we expect an increase in the number of drainage events in this region leading to the formation of higher numbers of small remnant lakes.
1. Introduction
Over a quarter of lakes on Earth are located in north- ern high latitudes (Lehner and Döll2004). This is due in part to the presence of permafrost which forms an aquitard close to the ground surface, inhibiting drainage (Smithet al2007, Grosseet al2013). Ongo- ing warming is currently causing changes in per- mafrost ground temperature and active layer depth (Biskabornet al2019, Romanovskyet al2019a), but how this will influence near surface hydrology in Arc- tic and sub-Arctic is poorly understood.
Climate warming is amplified in the Arctic com- pared to lower latitudes (Serreze and Barry 2011)
and since 1971 mean annual air temperature in the Arctic has increased by 2.7◦C (Boxet al2019). Con- sequently, permafrost temperatures have warmed throughout the region particularly during the last two to three decades and mean annual ground tem- perature has increased by 0.4◦C–0.8◦C per decade within the continuous permafrost zone (Biskaborn et al2019, Romanovskyet al2019a). The subsequent impact of permafrost degradation on lakes is varied and includes instances of initiation, expansion, and both gradual and catastrophic drainage (Yoshikawa and Hinzman2003, Smithet al2005, Roachet al2013, Jones and Arp 2015, Jones et al 2020a). Temporal and spatial heterogeneity in lake area change also is
driven by regional and temporal variations in envir- onmental characteristics such as permafrost extent and thickness, topography, and ground ice content (Smithet al2005, Riordanet al2006, Chenet al2014, Nitzeet al2017). Recent work has also highlighted the potential influence of wildlife ecology in lake dynam- ics as the return of beavers to Arctic Alaska appears to be influencing lake distribution (Joneset al2020b).
In northern high latitudes, lakes play an import- ant role both within the natural environment and socioeconomically. Thaw lake formation exerts an important influence over ecology (Schuur and Mack 2018), and both nutrient and carbon cycling (Walter et al2007, Joneset al2012, Walter Anthonyet al2014, Fuchset al2019). Repeated cycles of lake formation and drainage result in a complex and dynamic topo- graphy across much of the unglaciated Arctic (Frohn et al2005, Jorgenson and Shur2007, Arp and Jones 2009, Swanson2019). Subsequently changes in lake area and distribution across the landscape can drive abrupt and drastic shifts in vegetation (Jorgenson et al2001), hydrology (Rowlandet al2011) and both aquatic and terrestrial habitat distribution (Clarket al 2010, Jorgensonet al2010). Lakes are also important socioeconomically, often providing indigenous com- munities with fresh drinking water sources, as well as facilitating subsistence hunting and fishing (Eisner et al2009). Lakes and ponds have also been used as a source of fresh water for industrial applications, such as ice road construction (Alessaet al2008, Joneset al 2009, Arp et al 2019). Recent work has also high- lighted how lake basins can influence local hydrology post-drainage, through snow dam outburst floods (Arpet al2020).
In this study we used medium resolution (60–30 m) Landsat images to understand lake dis- tribution and change in six lake districts spanning a gradient of continuous to isolated permafrost in western Alaska. The main objectives of this study are to (a) understand broad-scale lake distribution along a permafrost gradient; (b) investigate changes in lake area in the region since the 1970s; and (c) investig- ate how changes in lakes may vary between different permafrost zones of that region.
2. Study area
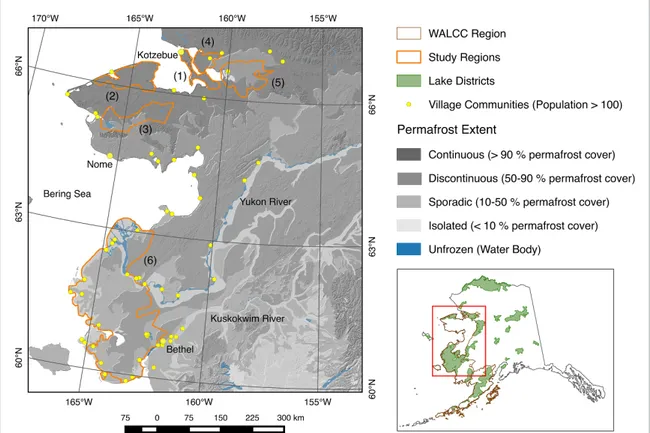
The six study regions cover a total area of 68 830 km2 and represent four permafrost extent zones loc- ated in western Alaska: In the southern fringe of the continuous permafrost zone, (1) the Bald- win Peninsula and (2) Beringia; at the continuous- discontinuous permafrost zone boundary, (3) the Central Seward Peninsula and (4) the Selawik area;
and at the isolated-sporadic permafrost boundary, (5) the Kobuk Delta and (6) Yukon-Kuskokwim Delta (YK Delta) (figure 1). Permafrost character- istics in our study regions were extracted from the digital dataset from Jorgensonet al(2008) based on a
map scale of 1:7200 000. Permafrost type varies from continuous extent in the north to isolated extent in the south (figure1, table S1 which is available online at stacks.iop.org/ERL/16/025006/mmedia). Perma- frost temperatures are coldest in the northern areas with a mean annual ground temperature of−3.3◦C at 20 m depth recorded at the Kotzebue borehole on the Baldwin Peninsula in 2015 (Romanovsky et al 2019b). The study regions contain extensive loess deposits in the uplands and sandy or silty alluvial and fluvial deposits in the river floodplains and delta regions that contain a wide range of ground ice volumes (table S2, figure S1). Other types of geolo- gic deposit found are sand dunes, old glaciolacustrine deposits, glaciofluvial outwash, modified moraine and volcanic deposits (table S3, figure S2). Ground ice content varies between our regions, and is high in Beringia due to the presence of yedoma, moderate in the Kobuk Delta, moderate to high on the Cent- ral Seward Peninsula, the Baldwin Peninsula, and Selawik, and low to high in the YK Delta (Jorgen- son et al 2008) (table S2, figure S1). Mean annual air temperature in the entire region is characterized by a south to north gradient with temperatures ran- ging from 0 ◦C to −6 ◦C (Jorgenson et al 2008).
Between 1950 and 2010 air temperature has warmed with thawing degree day values increasing by approx- imately 200◦C and freezing degree day values increas- ing by approximately 175◦C (figure S3).
The study regions encompass various types of lakes; thermokarst lakes are the most common type (Joneset al2011), while oxbow and delta lakes are also widely distributed in the river floodplains and delta regions. Additional lake types include maar (Beg´et et al1996), tidal, and coastal lakes. Thermokarst lakes are most prevalent in the Beringia and Baldwin Penin- sula study areas. Beringia also has multiple large maar lakes of an average size of ~1000 ha. Maar lakes form due to explosive volcanic eruptions that create depres- sions that are subsequently infilled by groundwater and or precipitation. The Kobuk Delta and Selawik study areas have a mix of thermokarst, delta, and oxbow lakes. In the YK Delta, there are many ther- mokarst, delta, oxbow, and tidal flat lakes of all sizes as well as some small maar lakes. All lake types men- tioned above were mapped as part of this study.
3. Data and methods
3.1. Data
We collected Landsat L1T-processed, terrain- corrected images acquired during two different time periods (MSS, 60 m resolution, from 1972, 1974, and 1975; and OLI, 30 m resolution, from 2013, 2014, and 2015) from the USGS Landsat repository (http://earthexplorer.usgs.gov) (table S4). The selec- tion criteria included imagery with less than 10%
cloud cover acquired during the lake ice-free summer periods (July–August with some exceptions in June
Figure 1.Study areas in the northern and central western Alaska LCC Region with permafrost extent types and village locations in the region (with population >100, major villages Kotzebue, Nome and Bethel are shown in large yellow dots): (1) the Baldwin Peninsula, (2) Beringia, (3) the Central Seward Peninsula, (4) Kobuk Delta, (5) Selawik, and (6) Yukon-Kuskokwim Delta.
and September) of the 1970s and 2010s. Altogether, we used 12 Landsat Multispectral Scanner System (MSS) image tiles covering a total land surface area of 377 400 km2 and 14 Landsat Operational Land Imager (OLI) image tiles covering a total land surface area of 435 540 km2to extract lakes for these two time steps. To understand the role of permafrost extent on lake area changes in the study regions we used the digital permafrost map for Alaska by Jorgenson et al(2008).
Due to the time periods that we were focus- ing on the discrepancy in spatial resolution between the satellite datasets used in this study was unavoid- able. Prior studies using MSS data for lake change either relied on its comparability (Pluget al 2008), down-sampled their higher resolution data to MSS (60 m: Karlsson et al 2013) or even lower spa- tial resolutions (150 m: Smith et al 2005), or they only investigated larger lakes in their study areas (⩾1.2 ha: Smithet al 2005, Hinkel et al2007, Plug et al2008, Karlssonet al2013). However, direct com- parison of lake areas derived from same-day MSS and 30 m TM data (Roveret al2012) indicates very high correlation coefficients for lake areas derived from both sensors, carefully indicating their suitabil- ity also for cross-sensor time-series. Others (e.g. Lantz and Turner2015) compared lake areas derived from high-resolution imagery with lake areas based on the same imagery down sampled to TM and MSS spa- tial resolutions. They find deviations in the lower percentage (up to 1.2% for TM resolutions, between
1% and 16% for MSS resolutions, compared to the lake areas from the high-resolution base imagery).
We therefore consider the difference in spatial resol- ution between the MSS and OLI imagery overall as small. For medium, large, and very large lakes the uncertainty is even negligible as the resolution differ- ence is mostly relevant for shoreline (lake perimeter) pixels while the area to perimeter ratio increases sub- stantially with lake size, essentially diluting the effect substantially.
3.2. Lake mapping
We mapped lakes greater than 1 ha in Landsat images by applying a semi-automated lake classifica- tion using object-based image analysis (OBIA) meth- ods in the commercial software package eCognition™ Developer 8. OBIA consists of two steps: (a) image segmentation, i.e. aggregation of homogenous image pixels based on their spatial and spectral homogen- eity into meaningful clusters known as image objects, and (b) classification of image objects (Blaschke and Strobl2001, Navulur2006). Rather than identifying a surface feature simply based on spectral pixel inform- ation in a single step as in a traditional classifica- tion technique, OBIA requires users to decompose an image into meaningful objects, organize them in a conceptual hierarchy based on their relationships and integrate object semantics in classification rule- sets in an iterative fashion until the target objects are identified more accurately (Blaschke and Strobl2001, Navulur2006, Blaschkeet al2008).
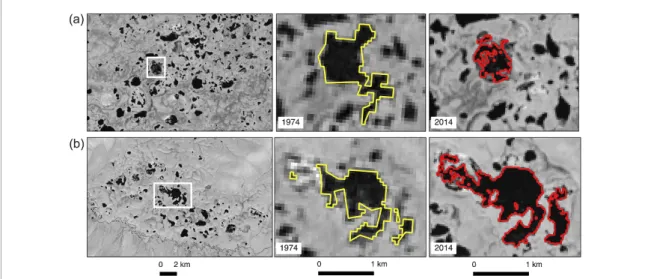
Figure 2.Examples of (a) partial lake drainage in the Selawik region and (b) lake area expansion in the Baldwin Peninsula region.
Prior to image segmentation, we performed spectral transformation on visible and infrared bands utilizing principal component analysis (PCA) on all images for image enhancement and better spectral separation of water bodies from various surface fea- tures (Mather and Koch2011). For further analysis, we only used the first two PC bands that carried the most variance (>99%).
We implemented OBIA techniques that involved segmentation of the original set of image bands and the first two PC components followed by a classi- fication of image objects based on a range of clas- sification rulesets. The Normalized Difference Water Index (NDWI) and Modified Normalized Difference Water Index (MNDWI) guided the waterbody iden- tification on Landsat MSS and OLI images, respect- ively (Mcfeeters1996, Xu2006, Liet al2013). NDWI and MNDWI were calculated using the following equations (for further information see supplement- ary materials):
For Landsat MSS:
NDWI=G−NIR
G+NIR. (1)
For Landsat OLI:
MNDWI=G−SWIR2
G+SWIR1. (2)
(Definitions of bands: G—Green, NIR—Near Infrared, SWIR-2—Short-Wave Infrared 2.)
Since no SWIR bands exist for Landsat MSS it was not possible to calculate a MNDWI for data from this sensor. In general, our Object Based Image Analysis classification for imagery from either sensor did not rely on specific multi-spectral indices such as NDWI or MNDWI but used all available bands plus the first two bands from a PCA transformation based on all bands. NDWI was used as a visual validation tool for Landsat MSS and MNDWI for Landsat OLI to fine- tune the OBIA segmentation to capture lake surfaces.
We used the U.S. Geological Survey National Elev- ation Dataset (NED DEM) and a derived hillshade raster to remove misclassified non-water objects asso- ciated with terrain shadows, which appear dark sim- ilar to water surfaces in imagery. Manual assessment, correction, and removal of rivers, streams and chan- nels were conducted to remove misclassifications of lake water bodies. To visualize changes in lake num- bers and total lake area over the large study domain we calculated and plotted these changes per 100 km2 using a 10×10 km grid across the study domain.
4. Results
The study region as a whole experienced a net loss in lake cover (figures2–5). Between 1970’s and 2010’s the net change in lake cover was−34.6 km2, which equates to−0.05% of the total landscape analyzed and a−0.38% decline in the area covered by lakes compared to the 1970s. Lake area change was found to be variable between study areas with an observed a mix of lake expansion and lake drainage in all study regions (examples of lake drainage and expansion shown in figures2and3). Here we break down these observations by study region and explore the high amount of variability between regions with contrast- ing permafrost extent.
4.1. Regional lake change in four permafrost zones (1970s–2010s)
4.1.1. Continuous permafrost zone: a net decrease in lake area but net increase in lake number
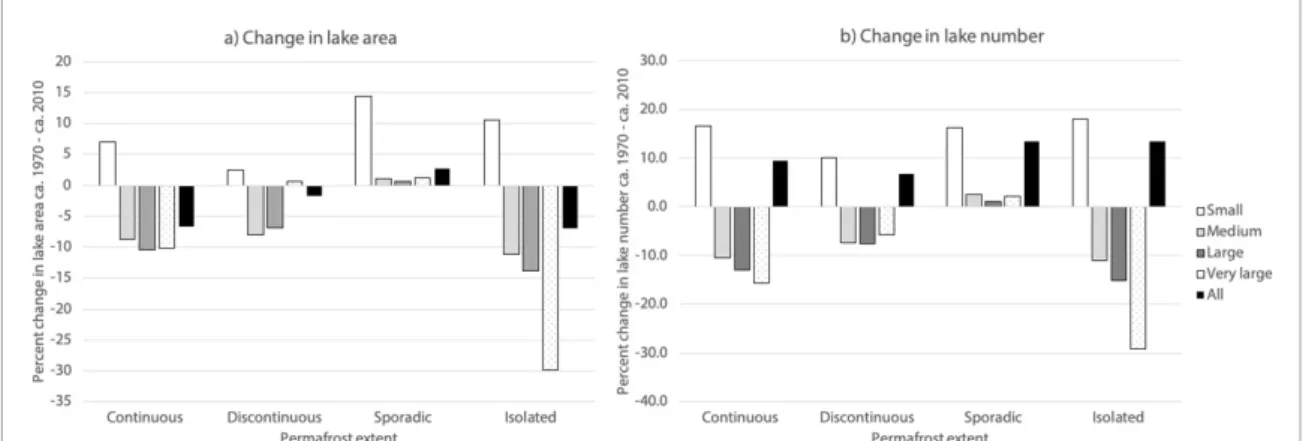
Between 1970s and 2010s, within the continuous per- mafrost zone, the total area covered by lakes declined by −6.7% (−65.3 km2). This is the largest area loss observed among all permafrost zones (figures4 and5, table1). Size class contributions to this value were+7.1%,−8.8%,−10.5%,−10.1% for lakes that were <10 ha (small), 10–50 ha (medium), 50–100 ha (large), and >100 (extra large) respectively, with the
Figure 3.Field photos from the Beringia study region showing lateral drainage of lakes caused by formation of a drainage channel. (a) Photo showing a complete drainage, note the deep drainage channel and (b) showing partial drainage with the formation of remnant ponds (Photo credit G. Grosse).
small lakes being the only class that increased in cover. The number of lakes across all continuous permafrost areas increased in number by 9.4% (615 lakes). This increase was driven by small lakes alone which increased by 804 lakes (16.5%) relative to the 1970s. All other lake classes declined in their num- bers: medium lakes by−139 lakes (−10.5%), large lakes by−26 lakes (−12.9%), and extra large lakes by
−24 lakes (−15.6%) (table1).
4.1.2. Discontinuous permafrost zone: a net decrease in lake area but a net increase in lake number
Overall, the area covered by lakes in the discontinu- ous permafrost zone decreased by−1.6% (−55 km2) between 1970s and 2010s (figures4and5, table 1).
Medium size lakes were responsible for the major- ity of this change. The area covered by medium lakes changed by−8.1%, and large lakes by−6.8%.
Increases in lake area were observed for both the largest and smallest classes with changes of 0.6% and 2.5% respectively (figures4and5, table1). Extra large lake extent probably increased due to lake expansion, while small lake extent primarily increased due to drainage events and remnant pond formation.
The overall number of lakes in the discontinu- ous permafrost zone increased by 6.7% (n=1538) (table1). The number of small lakes increased by 1861 lakes (10%), or 8.2 lakes 100 km−2. The number of
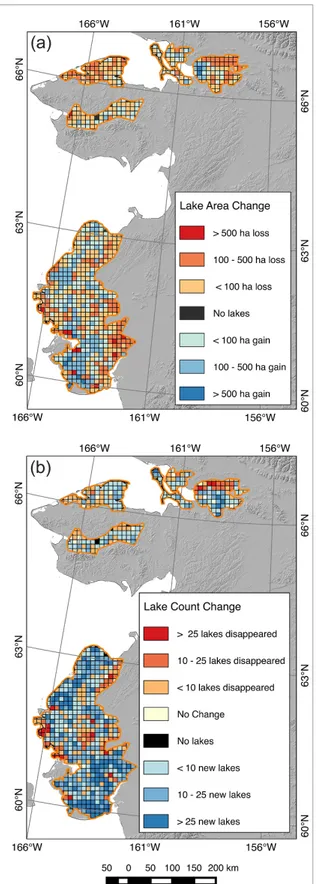
Figure 4.Maps showing gridded (10×10 km=100 km2 grid cells) lake area and lake count change.
lakes in the medium size class decreased by−265 lakes (−7.4%), or −1.2 lakes 100 km−2. The number of large lakes (50–100 ha) and extra large lakes declined by less than −1 lake 100 km−2 with a loss of−35 lakes (−7.6%) and−23 lakes (−5.8%), respectively (figures4and5, table1).
Figure 5.Summary of lake area (a) and number (b) changes across the different permafrost zones in the study domain from ca.
1970s to 2010s.
4.1.3. Sporadic permafrost zone: net increase in lake area and lake number
The sporadic permafrost zone is only present in the YK Delta region and at the start of our study period this landscape had the highest percent lake cover of all permafrost zones of 24%. Between the 1970’s and 2010’s, in contrast to other permafrost zones, there was a net increase in lake abundance and lake sur- face area in the sporadic permafrost zone for all lake size classes (figures 4 and 5, table 2). Within the sporadic permafrost zone, we found a net increase in the total lake surface area of 2.7% (117 km2) (figure4(a), table1). The largest increase in surface area was observed for small lakes, which increased by 14.4% (75 km2) (figures4(a) and5(a), table1). The total area of lakes increased by 1.0%, 0.7%, and 1.2%
for medium, large, and extra large lake classes respect- ively (table1).
Within the sporadic permafrost zone the number of lakes increased by 13.3% (2760 lakes, or 15.2 lakes 100 km−2) (figures 4(b) and 5(b), table 1).
The largest increase in lake number was observed for small lakes, which increased by 2663 lakes (16.2%), or 14.6 lakes/100 km2(figure4(b), table1). The number of lakes for medium, large and extra large size classes increased by 82 (2.5%), 5 (1.0%), and 10 (2.1%), respectively.
4.1.4. Isolated permafrost zone: a net decrease in lake area but a net increase in lake number
The isolated permafrost zone is present only in the YK Delta region and had the lowest lake cover (5%) of all permafrost zones at the start of our study period.
The isolated permafrost zone region of the study area experienced a net loss of lake surface area of−6.9%
(−32 km2) accompanied by a net increase in lake number of 13.4% (829 lakes, or 10.2 lakes 100 km−2) (figures4and5, table1).
Within the isolated permafrost zone, small lakes saw the only net positive change of all size classes with an increase in area of 10.5% (17.2 km2). All other lake size classes saw a decrease in extent: −11.1%,
−13.9% and −29.9% for medium, large and extra large lake classes respectively (figures4and5, table1).
The number of lakes in the isolated permafrost zone increased by 829 (13.4%). As with other permafrost zones, this was driven by an increase in the distribu- tion of small water bodies, probably due to remnant lake formation. Small water bodies increased in num- ber by 942 (17.9%). Larger water bodies decreased in number by−87 (−11%),−12 (−15.2%), and−14 (−29.2%) for medium, large and extra large lake classes respectively (figures4and5, table1).
4.2. Intra-permafrost zone variability: a
comparison between study regions with the same permafrost extent
4.2.1. Study areas characterized by continuous permafrost
Both the Beringia and Baldwin Peninsula study regions are characterized by continuous permafrost and the two regions show very different patterns of lake change (figures4and5, table2). Beringia exhib- ited a large net decrease in lake area (−15.3%) which stands in stark contrast to the Baldwin Peninsula which experienced a small net increase in lake area of 3.9%. Interestingly both regions were characterized by an increase in lake number, 6.4% in Beringia and 27.1% on the Baldwin Peninsula. In Beringia, all lake size classes saw a decrease in area with the exception of lakes less than 10 ha in size: 6.5%,−15.4%,−14.4%, and−23.2% for small, medium, large and extra large lake classes respectively. On the Baldwin Peninsula, we observed an increase in lake area for all lake classes with the exception of large lakes. Changes in lake area on the Baldwin Peninsula were 16.8%, 0.1%,−20.4%, and 15.0% for small, medium, large and extra large lake classes respectively (table2).
4.2.2. Lake change in study areas characterized by a mix of continuous and discontinuous permafrost A mix of continuous and discontinuous permafrost characterizes three of our study regions: the cent- ral Seward Peninsula, the Kobuk Delta, and Selawik.
Table1.Lakechangebypermafrostzone.NotethatLimnicityisalandareaindexnormalizedbydescribingthetotallakeareaforacertainlakesizecategoryperkm2. 1970s2010sChange Permafrost extentSizeclassCountSurfacearea (km2 )Limn-icityCountSurfacearea (km2 )Limn-icity%Count change%Area changeCount changeAreachange(km2 ) Continuous<10ha4879177.0320.85683189.5890.916.57.180412.557 10–50ha1322272.6831.21183248.7291.1−10.5−8.8−139−23.954 50–100ha201135.5340.6175121.3330.5−12.9−10.5−26−14.201 >100ha154393.831.8130354.1551.6−15.6−10.1−24−39.675 Alllakes6556979.0794.47171913.8064.19.4−6.7615−65.273 Discontinuous<10ha18576609.783120437625.261102.5186115.477 10–50ha3572733.1581.23307674.0061.1−7.4−8.1−265−59.152 50–100ha463318.3810.5428296.6460.5−7.6−6.8−35−21.735 >100ha3951683.8672.83721694.3172.8−5.80.6−2310.45 Alllakes230063345.1895.5245443290.2295.46.7−1.61538−54.96 Sporadic<10ha16484518.1971.119147592.8061.316.214.4266374.609 10–50ha3259684.1541.53341691.1481.52.51826.994 50–100ha497347.9750.7502350.4450.810.752.47 >100ha4712862.8176.14812895.9266.22.11.21033.109 Alllakes207114413.1449.5234714530.3259.713.32.72760117.181 Isolated<10ha5251163.5440.46193180.7560.417.910.594217.212 10–50ha791157.590.3704140.1390.3−11−11.1−87−17.451 50–100ha7953.5380.16746.1090.1−15.2−13.9−12−7.429 >100ha4879.7980.23455.960.1−29.2−29.9−14−23.838 Alllakes6169454.4716998422.9640.913.4−6.9829−31.506
Table2.Lakechangeforspecificstudyareas.Regionacronymsareasfollows:BaldwinPeninsula,BAP;Beringia,BER;CentralSewardPeninsula,CSP;KobukDelta,KD;Selawik,SEL;andYukonKuskokwimDelta,YKD. 1970s2000sChangebetween1970sand2000s Focus regionsPfextentSizeclassTotallake count Totallake surfacearea (Ha)Limn-icityTotallake count
Totallake surfacearea (Ha)LimnicityLakearea (%)Area(ha)Lakecount (%)Lakecount BAPC<10ha44715421.186021801.641.01+16.84+259.64+34.68+155 BAP10–50ha1062098.71.371062101.421.37+0.13+2.720.000 BAP50–100ha13868.840.4511691.650.57−20.39−177.19−15.38−2 BAP>100ha3800.70.604920.410.52+14.95+119.71+33.331 BERC<10ha18666771.831.1621447209.961.23+6.47+438.13+14.90+278 BER10–50ha4919914.911.704068389.181.44−15.39−1525.73−17.31−85 BER50–100ha815275.070.90684516.290.77−14.38−758.78−16.05−13 BER>100ha7319294.763.305314823.022.54−23.18−4471.74−27.40−20 CSPC,D<10ha11333873.170.6513184171.040.70+7.69+297.87+16.33+185 CSP10–50ha2374912.670.832344646.810.78−5.41−265.86−1.27−3 CSP50–100ha261943.330.33241760.310.30−9.42−183.02−7.69−2 CSP>100ha1742074.847.091535683.726.01−15.19−6391.12−11.76−2 KDC,D<10ha11524071.052.1211924265.42.22+4.77+194.35+3.47+40 KD10–50ha3738181.224.253638029.034.17−1.86−152.19−2.68−10 KD50–100ha644410.282.29584272.412.22−3.13−137.87−9.38−6 KD>100ha4911189.155.814711668.66.06+4.28+479.45−4.08−2 SELC,D<10ha379314630.072.30414213715.22.16−6.25−914.879.20349 SEL10–50ha109122318.93.5187218212.682.87−18.40−4106.22−20.07−219 SEL50–100ha1318946.521.411137796.421.23−12.86−1150.10−13.74−18 SEL>100ha5940747.756.415843560.026.86+6.90+2812.27−1.69−1 YKDD,S,I<10ha37080117058.152.5142434128965.932.76+10.17+11907.78+14.44+5354 YKD10–50ha6754139691.772.996658136058.662.92−2.60−3633.11−1.42−96 YKD50–100ha93764904.761.3992364196.191.38−1.09−708.57−1.49−14 YKD>100ha886437292.369.37857433648.839.29−0.83−3643.53−3.27−29
A net loss in lake area was observed in both the Selawik and the central Seward Peninsula study areas of −3.9% and −12.4% respectively. In the Kobuk Delta region we observed a net gain in lake area of 1.4%. All areas saw an increase in lake number, the greatest occurring on the central Seward Peninsula with an increase of 12.6% (n=178). The Kobuk Delta and Selawik areas saw an increase of 1.3% (n=22) and 2.2% (n=110) respectively.
Lake size classes responded differently between discontinuous permafrost study areas (table2). In the central Seward Peninsula area, small lakes were the only size class to increase in area, by 7.7%. All other size classes saw a decrease in area of−5.4%,−9.4%, and−15.2% for medium, large and extra large lake classes respectively. In the Kobuk Delta area, both the smallest and extra large lake size classes saw an increase of 4.8% and 4.3% respectively. Medium and large size lakes saw a decrease in area by−1.9% and
−3.1% respectively. In the Selawik area all lake size classes except the extra large lake class saw a decrease in area of−6.3%, −18.4%, and −12.9% for small, medium, and large classes respectively. The largest lake size class (>100 ha) saw an increase in area of 6.9%. Since the YK Delta study area was the only one characterized by isolated and sporadic perma- frost, no comparisons were conducted for these per- mafrost zones.
5. Discussion
Our assessment of lake distribution and changes using Landsat images from the 1970s to 2010s in six major lake-rich regions covering an area of 68 830 km2in western Alaska shows widespread lake area loss. Many large lakes drained and declined in area while the abundance of small lakes increased for all permafrost types most likely due to partial drainage of large lakes creating numerous remnant ponds. Lake area increase was observed in some areas of the continuous permafrost zone but lake area loss was significantly higher in other areas, leading to a regional net lake area loss of−6.7% in the continu- ous permafrost zone. Through our mapping efforts, we observed that partial lake drainage dominated the non-continuous permafrost zones. These trends show that both lake expansion and drainage are phenom- ena taking place in parallel in western Alaska but that drainage is dominating regional net lake area trends.
Our findings on lake area change in the continu- ous permafrost zone differ from trends described in some previous studies. Smithet al (2005) reported an overall lake area increase in the continuous per- mafrost zone and a decrease in the non-continuous permafrost zones across their study region covering an area of 515 000 km2in Siberia for the time period
or negligible change in lake area has been reported from other regions of Alaska and Siberia for smal- ler study regions in the continuous permafrost zone (Riordanet al2006, Labrecqueet al2009, Joneset al 2011, Swanson2019). Recent findings suggest that large numbers of new ponds and lakes on the Baldwin Peninsula have been created in recent years by beavers which ecosystem-engineered drained lake basins and narrow erosional gullies with their dams (Joneset al 2020b). These differences in observations show that the direction of lake area change can be variable from one region to another across same permafrost types due to spatial heterogeneity in lake characteristics and local environmental factors (Riordanet al2006, Karlssonet al2013, Roachet al2013, Chenet al2014, Nitzeet al2017).
Other research efforts have also highlighted a loss in lake area in northwestern Alaska. Our findings of lake area loss in general agree with those of Jones et al(2011) who analyzed lake changes in the continu- ous permafrost zone on the northern Seward Pen- insula. They found that numerous significant lake drainage events have occurred since ca. 1950, primar- ily to lakes over 40 ha in area at an average rate of−2.3 lakes year−1(Joneset al2011). Our findings also agree with Swanson (2019) who documented a significant decline in surface water between 1984 and 2018 in northwestern Alaska, which they attribute to thermo- erosion of lake outlets. Swanson (2019) suggests that the thermoerosion of outlets was driven by a com- bination of warm mean annual air temperature and fluctuations in summer precipitation. Recent work by Nitzeet al(2018) highlights large scale trends across northern and western Alaska and for the continuous permafrost zone found a lake area loss of −0.62%
(a combination of a gross increase of 3.31% and a gross decrease of−3.94%) between 1999 and 2014, although lake change in general was highly diverse across the continuous permafrost zone. In contrast to our study, Nitzeet al(2018) found a greater loss in lake area within discontinuous versus continuous permafrost (−11.39% and−3.45% respectively com- pared to−1.6% and−6.7% respectively in our study region).
We observed a net decrease in lake area in the continuous permafrost zone due to major lake drain- age events in the Beringia (−63 km2) and Selawik (−34 km2) study regions. In the continuous per- mafrost zone, lateral drainage of thermokarst lakes can occur due to bank overflow, subsequent develop- ment of the drainage network by ice wedge degrad- ation, headward erosion, or lake tapping by another water body such as lake, river or sea (Hopkins1949, Mackay 1988, Hinkelet al 2007, Marshet al 2009, Jones et al 2011, 2020a, Grosse et al 2013, Jones and Arp2015). Therefore, it is possible that areas of
relatively stable continuous permafrost show variable lake change patterns depending on the adjacent land- scape features, local geomorphology, stages of thaw, and the timing of the observation.
Observations from this study support previous findings that partial drainage of lakes is becom- ing increasingly common in areas of discontinuous permafrost. In Alaska, declining lake surface area was reported for numerous discontinuous permafrost regions including the southern Seward Peninsula, the Interior, and the Yukon Flats (Yoshikawa and Hinz- man2003, Riordanet al2006, Roveret al2012, Chen et al 2014, Nitze et al 2017). This suggests that as the Arctic warms and the continuous-discontinuous permafrost zone boundary shifts northwards (Jafarov et al2012), lake shrinkage may eventually become a more prominent phenomenon than lake expansion.
We observed an overall increase in lake area for the sporadic permafrost zone in the YK Delta. This stands in contrast to observations from the sporadic permafrost zone in West Siberia where lake area loss was prevalent (Smithet al2005). The overall increase in lake area we observe in the YK Delta could be due to the dominant surficial geology and the distribution and structure of hydrological networks. Lake dynam- ics within low-lying delta regions are influenced by expansive and complicated systems of water channel distributaries both at the surface and in the subsur- face (Burn1995, Stephaniet al2020). In the sporadic permafrost zone, underground connectivity of lakes to the groundwater system may also be enhanced and lakes can be recharged from better-developed ground water aquifers as this can significantly affect lake water levels and lake areas in non-continuous permafrost zones more so than in continuous permafrost regions (Chenet al2014). For the YK Delta, permafrost dis- tribution beneath lakes and the hydraulic head gradi- ent of lakes relative to the groundwater table may be a potential driver for heterogeneous, though clustered, spatial patterns of lake changes.
In the isolated permafrost zone of the study region lake area drainage is again greater than lake expan- sion. We suggest that this may be due to large lakes located close to larger water channels drained by stream or river tapping. Using our Landsat data set, we observed that the formation of new drainage channels or expansion of pre-existing water chan- nels promoted lake area loss. In addition, headward erosion of stream channels and erosion of narrow land between coastal lakes and the sea caused nearby lakes to drain. Similar patterns of lake drainage due to coastal erosion have been reported earlier for the Alaska North Slope (Hinkel et al 2007, Jones and Arp2015).
6. Conclusions
We combined Landsat MSS and OLI images from the 1970s and 2010s with OBIA to assess broad-scale
distribution and changes of lakes larger than 1 ha across the four permafrost zones (continuous, dis- continuous, sporadic, and isolated extent). Overall, we observed a net drainage of lakes larger than 10 ha across the western Alaska study region. Partial drain- age of these medium to large lakes created an increase in small water bodies <10 ha, in the form of remnant lakes and ponds, leading to an increase of up to 27%
in the total number of lakes in all regions. We found this trend to be most pronounced in areas of con- tinuous permafrost with regional variations between study sites with similar permafrost extent.
Lake area change varied between areas of differ- ent permafrost extent. Areas of continuous and isol- ated permafrost experienced the greatest loss in lake area (−6.7% and −6.9% respectively). In contrast areas of sporadic permafrost were characterized by a net increase in lake area (2.7%). While this variability could be attributed in part to permafrost extent it is likely that other factors such as local geomorphology, ground ice content and surficial geology (tables S2, S3, figures S1 and S2) play a critical role in drainage dynamics.
Our results demonstrate that the selection of a specific study region can have an impact on observed patterns of lake change. Fine-scale observations from small study regions may show clear lake area loss or gain trends but only a broad-scale observation of a larger study regions is likely to show regional trends that exceed localized noise from environ- mental variables. Our findings highlight the dramatic and important changes in hydrology and habitat that are already occurring across permafrost-affected landscapes due to changes in lake dynamics and per- mafrost extent.
Data availability
Data that support the findings of this study can be accessed at https://doi.pangaea.de/10.1594/
PANGAEA.847703.
Acknowledgments
This research was supported by the Western Alaska Landscape Conservation Cooperative pro- ject WA2011-02, NASA NNX11AH20G, NASA NNX15AU49A, and ERC #338335. Louise Farquhar- son was supported by Grant Nos.: NSF # 1806213 and # 1832238. We would like to thank Joel Reynolds and Karen Murphy for their continuous support and feedback.
Author contributions
Prajna R. Lindgren developed the method, performed analysis and co-lead manuscript writing. Louise M.
Grosse and Vladimir Romanovsky conceived this study. Guido Grosse provided significant input dur- ing the development of the method, data analysis and result interpretation. All the coauthors contributed to writing and editing of the manuscript.
References
Alessa L, Kliskey A, Lammers R, Arp C, White D, Hinzman L and Busey R 2008 The Arctic Water Resource Vulnerability Index: an integrated assessment tool for community resilience and vulnerability with respect to freshwater Environ. Manage.42523
Arp C Det al2019 Ice roads through lake-rich Arctic watersheds:
integrating climate uncertainty and freshwater habitat responses into adaptive managementArct. Antarct. Alp. Res.
519–23
Arp C D and Jones B M 2009 Geography of Alaska lake districts:
identification, description, and analysis of lake-rich regions of a diverse and dynamic stateU.S. Geol. Surv. Sci. Invest.
Rep.402008–5215
Arp C D, Jones B M, Hinkel K M, Kane D L, Whitman M S and Kemnitz R 2020 Recurring outburst floods from drained lakes: an emerging Arctic hazardFront. Ecol. Environ.
18384–90
Beg´et J E, Hopkins D M and Charron S D 1996 The largest known maars on Earth, Seward Peninsula, northwest AlaskaArctic 4962–9
Biskaborn B Ket al2019 Permafrost is warming at a global scale Nat. Commun.101–11
Blaschke T, Lang S and Hay G J 2008Object-Based Image Analysis:
Spatial Concepts for Knowledge-Driven Remote Sensing Applications(Berlin: Springer) pp 817
Blaschke T and Strobl J 2001 What’s wrong with pixels? Some recent developments interfacing remote sensing and GIS Geo Inf. Syst.1412–7
Box J Eet al2019 Key indicators of Arctic climate change:
1971–2017Environ. Res. Lett.14045010
Burn C R 1995 The hydrologic regime of Mackenzie River and connection of ‘no-closure’ lakes to distributary channels in the Mackenzie Delta, Northwest TerritoriesCan. J. Earth Sci.
32926–37
Chen M, Rowland J C, Wilson C J, Altmann G L and Brumby S P 2014 Temporal and spatial pattern of thermokarst lake area changes at Yukon Flats, AlaskaHydrol. Process.
28837–52
Clark R, Ott A, Rabe M, Vincent-Lang D and Woodby D 2010The Effects of a Changing Climate On Key Habitats in Alaska (Alaska Department of Fish and Game, Division of Sport Fish, Research and Technical Services) p 102
Eisner W R, Cuomo C J, Hinkel K M, Jones B M and Brower R H 2009 Advancing landscape change research through the incorporation of Iñupiaq knowledgeArctic62429–42 Frohn R C, Hinkel K M and Eisner W R 2005 Satellite remote
sensing classification of thaw lakes and drained thaw lake basins on the North Slope of AlaskaRemote Sens. Environ.
97116–26
Fuchs M, Lenz J, Jock S, Nitze I, Jones B M, Strauss J, Günther F and Grosse G 2019 Organic carbon and nitrogen stocks along a thermokarst lake sequence in Arctic AlaskaJ.
Geophys. Res.: Biogeosci.1241230–47
Grosse G, Jones B and Arp C 2013 Thermokarst lakes, drainage, and drained basinsTreatise on Geomorphologyvol 8, ed J F Shroder, R Giardino and J Harbor (New York: Academic) pp 325–53
Hinkel K M, Jones B M, Eisner W R, Cuomo C J, Beck R A and Frohn R 2007 Methods to assess natural and anthropogenic
Jafarov E E, Marchenko S S and Romanovsky V E 2012 Numerical modeling of permafrost dynamics in Alaska using a high spatial resolution datasetCryosphere6613–24
Jones B Met al2020a Identifying historical and future potential lake drainage events on the western Arctic coastal plain of AlaskaPermafrost Periglacial Process.31110–27 Jones B M and Arp C D 2015 Observing a catastrophic
thermokarst lake drainage in northern AlaskaPermafrost Periglacial Process.26119–28
Jones B M, Arp C D, Hinkel K M, Beck R A, Schmutz J A and Winston B 2009 Arctic lake physical processes and regimes with implications for winter water availability and management in the national petroleum reserve alaska Environ. Manage.431071–84
Jones B M, Grosse G, Arp C D, Jones M C, Walter Anthony K M and Romanovsky V E 2011 Modern thermokarst lake dynamics in the continuous permafrost zone, northern Seward Peninsula, AlaskaJ. Geophys. Res.1162005–12 Jones B M, Tape K D, Clark J, Nitze I, Grosse G and Disbrow J
2020b Increase in beaver dams controls surface water and thermokarst dynamics in an Arctic tundra region, Baldwin Peninsula, northwestern AlaskaEnviron. Res. Lett.15075005 Jones M, Grosse G, Jones B M and Walter Anthony K M 2012 Peat
accumulation in a thermokarst-affected landscape in continuous ice-rich permafrost, Seward Peninsula, AlaskaJ.
Geophys. Res.: Biogeosci.117G00M07
Jorgenson M T, Racine C H, Walters J C and Osterkamp T E 2001 Permafrost degradation and ecological changes associated with a warmingclimate in central AlaskaClim. Change 48551–79
Jorgenson M T, Romanovsky V, Harden J, Schur Y, O’Donnell J, Schuur E A, Kanevskiy M and Marchenko S 2010 Resilience and vulnerability of permafrost to climate changeCan. J.
For. Res.401219–36
Jorgenson M T and Shur Y 2007 Evolution of lakes and basins in northern Alaska and discussion of the thaw lake cycleJ.
Geophys. Res. Earth Surf.112F02S17 Jorgenson M T, Yoshikawa K, Kanevskiy M, Shur Y,
Romanovsky V E, Marchenko S, Grosse G, Brown J and Jones B 2008 Permafrost characteristics of Alaska—a new permafrost map of Alaska9th Int. Conf. on Permafrosted D L Kane and K M Hinkel (Fairbanks, AK: Institute of Northern Engineering, University of Alaska Fairbanks) Karlsson J M, Lyon S W and Destouni G 2013 Temporal behavior
of lake size-distribution in a thawing permafrost landscape in northwestern SiberiaRemote Sens.6621–36
Labrecque S, Lacelle D, Duguay C C R, Lauriol B and Hawkings J 2009 Contemporary (1951–2001) evolution of lakes in the Old Crow Basin, northern Yukon, Canada: remote sensing, numerical modeling, and stable isotope analysisArctic 62225–38
Lantz T C and Turner K W 2015 Changes in lake area in response to thermokarst processes and climate in Old Crow Flats, YukonJ. Geophys. Res.: Biogeosci.120513–24
Lehner B and Döll P 2004 Development and validation of a global database of lakes, reservoirs and wetlandsJ. Hydrol.2961–22 Li W, Du Z, Ling F, Zhou D, Wang H, Gui Y, Sun B and Zhang X
2013 A comparison of land surface water mapping using the normalized difference water index from TM, ETM+and ALIRemote Sens.55530–49
Mackay J R 1988 Catastrophic lake drainage, Tuktoyaktuk Peninsula area, District of MackenzieCurr. Res. D: Geol.
Surv. Can.83–90
Marsh P, Russell M, Pohl S, Haywood H and Onclin C 2009 Changes in thaw lake drainage in the Western Canadian Arctic from 1950 to 2000Hydrol. Process.23145–58 Mather P M and Koch M 2011Computer Processing of
Remotely-Sensed Images: An Introduction(New York: Wiley)
Mcfeeters S K 1996 The use of the Normalized Difference Water Index (NDWI) in the delineation of open water featuresInt.
J. Remote Sens.171425–32
Navulur K 2006Multispectral Image Analysis Using the Object-Oriented Paradigm(Boca Raton, FL: CRC Press) pp 204
Nitze I, Grosse G, Jones B M, Arp C D, Ulrich M, Fedorov A and Veremeeva A 2017 Landsat-based trend analysis of lake dynamics across northern permafrost regionsRemote Sens.
9640
Nitze I, Grosse G, Jones B M, Romanovsky V E and Boike J 2018 Remote sensing quantifies widespread abundance of permafrost region disturbances across the Arctic and subarcticNat. Commun.91–11
Plug L J, Walls C and Scott B M 2008 Tundra lake changes from 1978 to 2001 on the Tuktoyaktuk Peninsula, western Canadian ArcticGeophys. Res. Lett.35L03502
Riordan B, Verbyla D and Mcguire D A 2006 Shrinking ponds in suxbarctic Alaska based on 1950–2002 remotely sensed imagesJ. Geophys. Res.: Biogeosci.111G04002
Roach J K, Griffith B and Verbyla D 2013 Landscape influences on climate-related lake shrinkage at high latitudesGlob. Change Biol.192276–84
Romanovsky V E, Smith S L, Isaksen K, Shiklomanov N I, Streletskiy D A, Kholodov A L, Christiansen H H, Drozdov D S, Malkova G V and Marchenko S S 2019a Arctic: terrestrial permafrostState of the Climate in 2018.
Bulletin of the American Meteorological Societyed J Blunden and D S Arndt (Boston, MA: Bulletin of the American Meteorological Society)Si–S306
Romanovsky V, Kholodov A, Dolgikh K, Hasson N and Lane T 2019b Thermal state of permafrost in North America—
continuously observed ground temperatures, 2017–2018 Arct. Data Cent.
Rover J, Ji L, Wylie B K and Tieszen L L 2012 Establishing water body areal extent trends in interior Alaska from multitemporal Landsat dataRemote Sens. Lett.3595–604
Rowland J C, Travis B J and Wilson C J 2011 The role of advective heat transport in talik development beneath lakes and ponds in discontinuous permafrostGeophys. Res. Lett.38L17504 Schuur E A G and Mack M C 2018 Ecological response to
permafrost thaw and consequences for local and global ecosystem servicesAnnu. Rev. Ecol. Evol. Syst.49279–301 Serreze M C and Barry R G 2011 Processes and impacts of Arctic
amplification: a research synthesisGlob. Planet. Change 7785–96
Smith L C, Sheng Y and Macdonald G M 2007 A first pan-Arctic assessment of the influence of glaciation, permafrost, topography and peatlands on northern hemisphere lake distributionPermafrost Periglacial Process.18201–8 Smith L C, Sheng Y, Macdonald G M and Hinzman L D 2005
Disappearing Arctic lakesScience3081429
Stephani E, Drage J, Miller D, Jones B M and Kanevskiy M 2020 Taliks, cryopegs, and permafrost dynamics related to channel migration, Colville River Delta, AlaskaPermafrost Periglacial Process.31239–54
Swanson D K 2019 Thermokarst and precipitation drive changes in the area of lakes and ponds in the National Parks of northwestern Alaska, 1984–2018Arct. Antarct. Alp. Res.
51265–79
Walter Anthony K Met al2014 A shift of thermokarst lakes from carbon sources to sinks during the Holocene epochNature 511452–6
Walter K M, Smith L C and Chapin F S 2007 Methane bubbling from northern lakes: present and future contributions to the global methane budgetPhil. Trans. R. Soc.A 3651657–76
Xu H 2006 Modification of Normalised Difference Water Index (NDWI) to enhance open water features in remotely sensed imageryInt. J. Remote Sens.273025–33
Yoshikawa K and Hinzman L D 2003 Shrinking thermokarst ponds and groundwater dynamics in discontinuous permafrost near council, AlaskaPermafrost Periglacial Process.14151–60