O R I G I N A L R E S E A R C H
Which proportion of SR investments is enough?
A survey-based approach
Gregor Dorfleitner1•Mai Nguyen1
Received: 29 October 2014 / Accepted: 28 January 2016 / Published online: 20 February 2016 ÓThe Author(s) 2016. This article is published with open access at Springerlink.com
Abstract This article examines the determinants of the optimal percentage that private investors seek to invest in a socially responsible (SR) way when forming their portfolio. By conducting a global online survey in English, German and French, we find indications that it is sufficient for the majority of investors to have a certain amount of their budget invested sustainably. Accordingly, the optimal proportion tends to be lower the higher the available investment volume is. In addition, the non-financial utility derived from SR investments appears to be independent of the form of financing the investor provides. Moreover, the results show that well-educated women and slightly younger persons seek to invest a higher percentage of their portfolio socially responsibly.
Keywords Socially responsible investingSRIInvestment decision Investment choiceInvestment behaviorNon-financial utilitySocially responsible investmentEthical investment
JEL Classification G11
& Gregor Dorfleitner
gregor.dorfleitner@ur.de Mai Nguyen
Mai.Nguyen@ur.de
1 Department of Finance, University of Regensburg, Universita¨tsstra?Cˇ e 31, 93053 Regensburg, Germany
DOI 10.1007/s40685-016-0030-y
1 Introduction
This paper addresses the question of the optimal proportion of socially responsible (SR) investments investors wish to hold in their portfolio. SR investments are not only chosen on the basis of financial considerations but also due to personal values and ethics. While several studies attempt to explain by socio-demographic characteristics why some investors care more about non-financial issues in their asset allocation decision (e.g., Rosen et al. 1991; Haigh 2008; Berry and Junkus 2013), to our knowledge, no study examines the determinants of the desired percentage to be invested socially responsibly. To this end, we conduct a global online survey in English, German and French among private investors. The results reveal that the majority of investors is satisfied, if a certain amount of capital is invested sustainably. Hence, the optimal proportion of SR investments is not only influenced by the available investment volume, but also linked to the perception of benefits that individuals derive from the socially responsible attribute.
In traditional finance, it is assumed that individuals make their investment decisions only on the basis of financial considerations such as return, risk and liquidity (e.g., Markowitz1952; Tobin 1958; Sharpe 1964; Lintner1965). During the last decades, a new investment behavior, known as sustainable, ethical or socially responsible investing (SRI), has emerged and increasingly attracts attention both in the practitioner and academic literature. In this article, the terms sustainable, ethical and socially responsible are used as synonyms. SRI is generally considered as the inclusion of personal values and other non-financial concerns—often structured into social, environmental, ethical and corporate governance issues—in the investment process. While ethical investing has ancient origins in Jewish, Christian, and Islamic traditions, the roots of the modern SRI development can be found in the political climate of the 1960s (Renneboog et al. 2008). A compre- hensive overview of the existing literature on SRI is provided by von Wallis and Klein (2014).
Research in terms of individuals who adopt SRI—generally referred to as socially responsible (SR) investors or ethical investors—attempts to profile them by socio-demographic characteristics. The generally accepted view is that well- educated and less wealthy women or young adults are concerned about SR issues in the investment decision to a higher degree. Several studies such as Beal and Goyen (1998), Rosen et al. (1991), Tippet and Leung (2001), Beal et al. (2005), Schueth (2003), Haigh (2008), Nilsson (2008), Nilsson (2009), Junkus and Berry (2010), Cheah et al. (2011) and Pe´rez-Gladish et al. (2012) confirm this point of view. On the contrary, McLachlan and Gardner (2004) and Williams (2007) find little evidence that ethical investors differ in demographics compared to their conven- tional counterparts.
Since investment decisions are driven by individual attitudes, beliefs and preferences, it is not easy to explain investor behavior. It is generally assumed that individuals seek to optimize their welfare by choosing a portfolio which balances return and risk according to individual preferences (e.g., Friedman and Savage 1948; Sharpe1964). However, the practice of SRI shows that a growing number of
investors not only takes financial considerations into account but also cares about non-financial impacts of their investments. While Nilsson (2008) and Brimble et al.
(2013) conclude that financial performance and risk are the most influential factors in any investment choice for both conventional and SR investors, several studies indicate that investment decisions appear to be influenced by non-monetary or ethical objectives as well. In a controlled experimental setting, Pasewark and Riley (2010) find that investors appear to be sensitive equally to financial and to non- financial factors in the investment decision process. This implies that the investment decision is significantly driven by both the interaction between differences in financial performance and the investors’ personal values. This finding is also supported by Pe´rez-Gladish et al. (2012) who show that ethical investors are financially aware even if they also seek non-financial benefits.
The psychological study by Mackenzie and Lewis (1999) reveals that SR investors pursue mixed motives and neither attempt to maximize their wealth nor their moral commitment. Webley et al. (2001) report that ethical investors have the need to invest their money in ways that are consistent with their personal values.
This also implies that they are generally committed to their SR investments, even if they perform poorly or are ethically ineffective. However, the questionnaire survey of 1146 SR investors in the UK, conducted by Lewis and Mackenzie (2000a), reveals that these preferences are unrelated to the proportion which is invested socially responsibly. Thus, they suggest that there is no straightforward trade-off between a person’s values and their desired expected financial return.
Furthermore, several studies show that many SR investors mix their portfolio with SR and conventional investments (Mackenzie and Lewis 1999; Lewis and Mackenzie 2000a; Webley et al. 2001; Lewis 2001). This result implies that it appears to be sufficient to invest a certain amount to achieve social or ethical objectives which are pursued by implementing SRI. While some literature examines the determinants for the probability of investing socially responsibly (e.g., Junkus and Berry 2010; Dorfleitner and Utz 2014) and for the amount that is invested socially responsibly (e.g., Nilsson2008; Bauer and Smeets2015), to date, no study exists which addresses the issue of the optimal percentage of SR investments in a portfolio. Beal et al. (2005) provide evidence that SR investors gain non-financial benefits from the social attribute of their investments. Similarly, Bollen (2007) comes to the conclusion that SR investors derive utility from owning securities of sustainably managed companies. Hence, the question arises whether SR investors would invest their whole portfolio in a socially responsible way due to the additional sustainable benefits, if appropriate investment possibilities existed. In this regard, another question that has not yet been addressed by the literature is whether the non- financial utility increases proportionally with the amount invested socially responsibly. In addition, it is of interest, whether investors perceive benefits from the socially responsible attribute irrespective of the form of financing through which they participate in the firm.
The core aim of this study is to examine the influential factors that determine the investors’ desired optimal percentage of SR investments, which we synonymously also call the optimal SR level or proportion in this article. To this end, we conducted an online survey. Our results provide empirical evidence that the majority of
investors is satisfied regarding their non-financial or ethical ambitions if a certain amount of their budget is invested sustainably. Hence, the main determinant of the proportion invested socially responsibly is the individual perception regarding the benefits through SRI which is also related to, among other variables, the available investment volume. Therefore, individuals with higher investment volume seek to invest a lower optimal percentage in their portfolio ethically.
The remainder of this paper is structured as follows: The research questions of this study are developed in Sect.2. Next, we describe the sample collection strategy and the questionnaire design. Section4 contains the sample description and the preliminary data analysis. The empirical methodology and the results are presented in Sect.5, which is followed by a conclusion in Sect.6.
2 Research questions
This section develops hypotheses on the preferences and the behavior of investors in the context of SRI. The main purpose of this study is to determine the influential factors for the optimal proportion of SR investments. In this regard, a related issue is the non-financial utility that investors derive from SR investments. Another aspect concerns the investors’ perception of the allocation of corporate social performance (CSP) to a firm’s financial structure. While corporate social responsibility (CSR) is generally defined as corporate commitments and decisions relating to environmen- tal, social, ethical and corporate governance considerations, CSP denotes the evaluation of a company in this field.
2.1 The non-financial utility and the optimal proportion
The classical portfolio theory incorporates the three investment objectives return, risk and liquidity (e.g., Markowitz1952; Tobin1958; Acharya and Pedersen2005).
However, several studies suggests that investment decisions appear to be not only determined by these financial considerations, but also by non-financial aims (e.g., Pasewark and Riley2010; Pe´rez-Gladish et al.2012). Lewis and Mackenzie (2000a) report that the preferences for ethical investments are price inelastic with respect to losses and elastic with respect to gains. By analyzing the dynamics of cash flows in SR mutual funds, Bollen (2007) finds evidence that cash flows into the funds are more sensitive to lagged positive returns than the cash flows into conventional funds. On the contrary, lagged negative returns have a weaker influence on cash outflows from SR funds compared to the conventional counterpart. Similar results are supported by Benson and Humphrey (2008), who show that SRI fund flows are less sensitive to financial returns than those of conventional funds.
While financial utility is obtained by high financial performance and low variation in returns, these results indicate that investors derive non-financial utility from investing socially responsibly. In order to measure the non-financial benefits, Bollen (2007) suggests a bi-attributive utility function in which both financial and non-financial utility can be obtained. This model predicts that investors are more likely to keep poorly performing SR mutual funds than conventional funds, as they
get non-financial benefits. In this context, the question arises whether non-financial utility increases linearly with the amount that is invested in a socially responsible way. As shown by Lewis and Mackenzie (2000a), most SR investors do not have their entire portfolio invested socially responsibly, but only to an average share of 31 %. Hence, we assume that investors consider their non-monetary ambitions to be satisfied if a certain amount is invested socially responsibly. This leads to the following hypothesis concerning the non-financial utility.
Hypothesis H1 A certain amount of capital invested socially responsibly is sufficient to achieve the non-monetary or ethical objectives that an investor pursues by adopting SRI.
The hypothesis implies that the non-financial or ethical ambitions are satisfied, if a definite sum of their available budget is invested sustainably. This indicates the existence of a saturation point of the non-financial utility that would lead to a lower optimal proportion of SR investments if the available investment volume was higher. If this is the case, the probability of doubling the amount that is invested in SR products, if the investment volume is doubled, would be higher the lower the investment volume is. The reason is, that the required amount that is desired to be invested sustainably has not been reached yet. Hence, investors who seek a higher optimal level, are more willing to double the amount invested socially responsibly under the assumption that their budget is double the amount. In addition, we check hypothesis H1 directly by asking the investors whether their non-financial or ethical ambitions are satisfied, if a certain amount of their budget is invested socially responsibly. We assume that a perception of saturation in terms of the non-monetary benefits influences the optimal proportion of SR investments negatively. Thus, under the assumption of the validity of hypothesis H1, the available investment volume and the perception of a saturation in terms of the non-financial utility are assumed to influence the optimal SR level negatively, while the willingness to double the sustainable invested amount has a positive impact.
2.2 Other influential factors on the optimal SR level
Additionally to hypothesis H1, we propose the following hypotheses regarding other possible determinants of the proportion of SR investments that investors seek, as this is the main purpose of this study:
Hypothesis H2a A positive perception with regard to risk and return of SR investments has a positive impact on the optimal SR level.
Hypothesis H2b The more important financial considerations are, the lower the optimal SR level is.
Hypothesis H2c Implementing non-monetary or ethical objectives by SRI affects the optimal SR level positively.
Hypotheses H2a and H2b refer to financial considerations. These hypotheses are motivated in several ways. As noted by Brimble et al. (2013), financial performance is the most influential factor in the investment decision-making process. The authors
analyze the actual factors that drive investment decisions by surveying 322 individuals regarding their investment attitudes and an asset allocation experiment.
The results indicate that both ethical and conventional investors regard financial criteria as more important than SR issues. Similarly, McLachlan and Gardner (2004) find no significant differences between the two investor groups in terms of the importance of financial returns. Beyond that, Dorfleitner and Utz (2014) report a large interest in high financial returns among SR investors. In fact, some studies indicate that SR investors are not willing to waive a considerable amount of financial return in favor for non-financial benefits (Rosen et al.1991; Sandberg and Nilsson2011).
Nilsson (2008) concludes that the subjective perception of financial return and risk are the core decision-making determinants in any investment choice. This is also supported by Jansson and Biel (2011b) who suggest that private investors are influenced by beliefs concerning returns in the long run. Furthermore, Jansson and Biel (2011a) report that conventional and ethical investors have similar beliefs about the financial performance of SR investments which perform worse in the short term but slightly better than conventional investments in the long run. Nilsson (2008) finds that about 25 % of the 563 respondents perceive a worse performance of SR products compared to conventional investments, whereas more than half of the respondents believe in similar returns and 20 % suppose that sustainable invest- ments outperform their conventional counterparts. However, these results are different from those of Lewis and Mackenzie (2000a) who report a greater percentage of ethical investors assuming that SR investments have a lower return.
Thus, investors who do not belief in a superior financial performance of SR investments and regard financial issues to be more important than non-monetary aspects at the same time, are supposed to have a smaller optimal level of SR investments. In contrast, we assume that investors who perceive SR products to be less risky and, respectively, having higher returns compared to conventional investments in the long run seek for a higher optimal SR level. Hypothesis H2c implies that individuals who implement their non-financial or ethical ambitions by SRI would aim for a higher proportion of SR products in their entire portfolio compared to those who choose other options such as donations for this purpose.
2.3 The allocation of CSP
Another interesting issue is whether investors derive non-monetary benefits from a firm’s CSP irrespective of the sort of financing (equity, debt) with which they are involved in a sustainable company or project. From a business ethics perspective, one can argue that being the owners, the shareholders of a company are indeed in charge of the social responsibility of the firm (Schaefer 2008). Following this argument, one can attribute the social responsibility of a company rather to its shareholders than to its bondholders. If investors follow this view, they should not be indifferent between debt or equity investments concerning the CSP. However, from the viewpoint of an entity approach, the value of a company’s assets is attributed partly to debt and partly to equity capital. The CSP can be seen as an additional non-monetary asset, which is appreciated by the investors through lower
cost of capital (Goss and Roberts2011; Ghoul et al.2011). However, since debt as well as equity costs of capital are lowered by a strong CSP, one can argue that both forms of capital share a part of the non-monetary asset. This second argument suggests that individuals assess their participation in a company’s CSP indepen- dently of the form of financing. Summarizing, there is no clear prior concerning this question. Nevertheless, we propose the following hypothesis, without a clear expectation of confirming it.
Hypothesis H3 Investors do not perceive a difference in their participation of a company’s CSP if they compare equity and debt financing.
3 Research design 3.1 Sample collection
In addressing the issue of this study, we conducted an open online-survey for private investors that was available in English, German and French. Before the question- naire was released, a pre-test on a small number of experimentees was carried out.
The questionnaire was presented as a survey about sustainability in the investment context. It took on average 10 min to complete the survey. As an incentive in order to recruit respondents we offered awards for participating in terms of the realization of social projects that are linked to a certain amount of completed questionnaires.
We gathered our sample by placing the link to our survey on capital-market and SRI related websites or message boards and in newsletters for SRI. Furthermore, we also asked asset managers and investment advisors to make their customers aware of the survey. The survey was online during the period from February 2013 to early 2014.
3.2 Questionnaire development
The questionnaire is designed to capture an individual’s perception regarding the non-financial benefits derived from investing socially responsibly and possible influential factors on the desired optimal proportion of SR investments.
Some former studies (e.g., Lewis and Mackenzie 2000a; Webley et al. 2001) differentiate SR and conventional investors ex ante by asking the participants of their questionnaire whether they have already invested in SR products. Generally, there is no valid approach on how to differentiate between SR and conventional investors. Since SR investments may also attract conventional investors, it does not mean that the involvement of SR investment products in one’s individual portfolio signalizes an SR investor (Cheah et al.2011). Different from Wins and Zwergel (2014), who compare ethical investors, conventional investors and those who are generally interested in SRI, we are primarily interested in whether the respondents are driven by social, ecological or ethical principles in their decision-making process. In the spirit of Williams (2007) we identify SR investors by asking the participants whether sustainable and social responsible considerations ever had an influence on their investment decision. Respondents who stated that a company’s or
a project’s demonstrated social responsibility has had an influence at least once or that they have considered it and will buy or sell as a result in the near future are indicated as SR investors. The remaining participants, who stated that their investment decision has never been driven by social or ethical issues, are referred to as non-SR investors in this study. These participants are generally denoted as conventional investors, even though (a large) part of them can be assumed to be interested in SR investments as the survey was presented to raise questions about sustainability aspects in the investment choice.
The survey contains further 21 questions which are categorized as follows: (1) attitudes, beliefs and estimations of investors with regard to SRI; (2) investment behavior and preferences towards SRI; (3) socio-demographic information.
3.3 Attitudes, beliefs and estimations of investors towards SRI
The first part comprises eight questions related to the participants’ attitudes to, motives to and estimations of SRI. To begin with, we asked the respondents which notion of sustainability in an investment context they have and why it matters to them. Since non-monetary or ethical aims can be implemented in several ways, we also asked the participants in which way they implement their personal values. This question is, in particular, relevant to hypothesis H2c.
With regard to hypothesis H2a, we were interested in whether a positive notion regarding financial aspects of SR investments is also an incentive, besides non- monetary motivations, to invest in a socially responsible way. We therefore asked the participants about the reasons why sustainability matters to them in their investment decision.
While Haigh (2008) and Pe´rez-Gladish et al. (2012) show that social aspects are most important to investors, Rosen et al. (1991) and Berry and Junkus (2013) find that environmental considerations are the main indicators for both SR and non-SR investors in order to identify SR corporate behavior. Following these studies we asked the participants to indicate three of the most important factors referring to social, environmental, ethical and corporate governance issues to determine corporate social responsibility. In order to check hypothesis H2b, the respondents also had the option of financial considerations in terms of sustaining returns in the long run (in the sense of purely financial sustainability) among ten possible answer choices.
According to Berry and Junkus (2013), investors prefer the inclusion strategy by rewarding companies who feature positive SR policies to the exclusionary screen.
Since the estimation of firms according to certain SR criteria would probably be both intricate and time-consuming, several institutions specialized in sustainability research and analysis have emerged, who offer measures and indicators on CSP which are often referred to as environmental, social and corporate governance (ESG) scores. We asked therefore the investors whether these standardized sustainability ratings are sufficient to make a decision. Furthermore, the necessary information depth to form an assessment of a firm’s sustainability and the time horizon for an information update was relevant. Finally, it was of interest whether individuals believe that SRI actually has an effect. Hence, we asked the respondents
if ethics and sustainability standards could have prevented or at least reduced the financial crises of the previous years (e.g., U.S. housing crisis, euro crisis, European sovereign debt crisis).
3.4 Behavior and preferences in terms of SRI
The second part, which contains five questions, targets different aspects concerning the investment behavior and preferences towards SRI. These questions particularly address the hypotheses H1 and H3.
Since the main aim of this study is to examine the factors that affect the desired proportion of SR investments, we asked the participants which percentage of their available investment volume they would like to invest sustainably. As a gap between supply and demand may exist (e.g., Bollen2007; Dorfleitner and Utz2014) and some investors may not know the composition of their portfolio precisely, we do not ask for the actual percentage that is invested socially responsibly but for the optimal proportion.
As SR investors appear to derive non-financial utility from SR investments (Lewis and Mackenzie2000a; Bollen2007), we check hypothesis H1 indirectly as described in Sect.2 by posing the hypothetical question whether the respondents would double the amount that is invested sustainably according to the preferred optimal SR proportion if their investment volume was double the amount. We also asked the investors directly whether they would consider their non-monetary or ethical ambitions to be satisfied if a certain amount was invested sustainably.
To clarify hypothesis H3 we asked whether the participants would estimate their non-monetary or ethical motivations to be satisfied regardless of the form of financing they provided for a certain company. We asked the participants to answer this question by disregarding risk and return preferences. In addition, we posed the question of which asset class the respondents prefer as SR investments.
3.5 Socio-demographic profile
The last part is concerned with socio-demographic characteristics. There are some studies attempting to explain differences in the SR invested amount (Nilsson2008), differences in investors’ attitudes (Nilsson2009), the determinants for SRI (Junkus and Berry 2010) and the willingness to sacrifice financial returns in favor of satisfying SR objectives (Dorfleitner and Utz2014) by socio-demographic factors.
Following these studies we wish to explore whether differences in investment behavior and in investors’ preferences as described above are driven by demographic factors such as gender, age, education and investment volume.
Moreover, some researchers such as Eriksen and Kvaløy (2010), Chakravarty et al.
(2011), Andersson et al. (2013) and Pollmann et al. (2014) find that the risk-taking behavior of individuals differs between investment decisions made with their own money and with other people’s money. Thus, we are interested in whether the participants make their decisions only on behalf of themselves or also on behalf of others. Under the assumption that an individual whose investment choice affects other persons (i.e., family members, as only private investors were questioned) decide differently, we also asked for the number of persons living in the household.
4 Data and preliminary analysis 4.1 Sample description
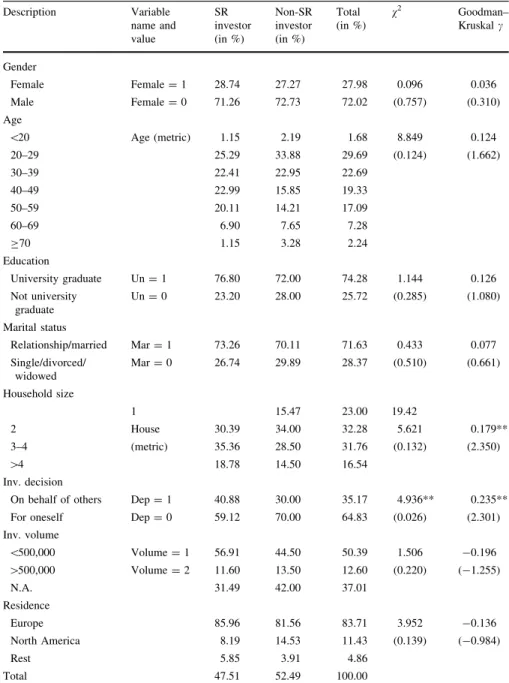
After filtering out questionnaires with a too short process time or with inconsistent answers, the data sample includes 381 respondents in total. 70.08 % of them have completed the German-language questionnaire, 21 % the English-language and 8.92 % the French-language ones. The survey was conducted in cooperation with an asset manager based in the German-speaking region with a large number of clients with above-average wealth. Thus, the fact that the majority of participants opted for the German-language version is an indication that the survey has attracted many of these. The French-speaking participants have been acquired mostly through French and Canadian message boards whereas a greater part of the English-speaking respondents were gathered through capital-market and SRI related websites, newsletters and message boards. We identified 181 of the respondents as actual SR investors while 200 are either only interested in SRI or conventional investors. As participants may not be able to answer all the questions of the survey, some values are missing in the data set. The descriptive statistics in terms of the demographic features of our sample are shown in Table1, which outlines nine of 22 survey questions. The results of further eight questions are presented in Sect.4.2and the remaining five can be found in the appendix.
The respondents of the complete sample are predominantly male and well educated.
The average age is 39.68. The majority are in a relationship or married and do not have to take family members into account in their investment decision. Furthermore, most of the participants live in Europe and have an available investment volume below 500,000 Euro. In order to consider any demographic differences between actual SR investors and non-SR investors in the data set, we perform a v2 test and a rank correlation Goodman–Kruskalctest for both investor groups. The results show no significant differences in most demographic characteristics. SR investors tend to make investment decisions not only for themselves, but also on behalf of others to a higher degree compared to non-SR investors. In addition, a higher percentage of non-SR investors live in small households. In terms of demographic characteristics, the data samples of the two investor groups are therefore largely comparable.
The main purpose of this study is to examine empirically influential factors for the optimal level of SR investments. Before presenting the main results in Sect.5, we commence with the descriptive results of the survey and the variables that are relevant to the main regression analysis.
4.2 Descriptive data analysis
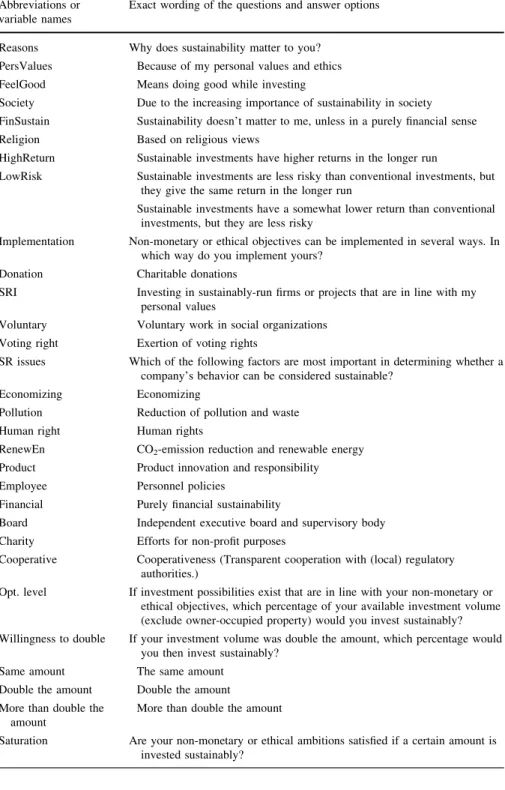
This section presents the descriptive results of the remaining relevant questions that are used in this paper. All important variables or abbreviations and the corresponding questions of the survey are shown in Table2.
Table3reports the descriptive results regarding the ways respondents implement their non-monetary or ethical objectives and the motivation for using SR criteria in
Table 1 Demographic characteristics of the survey sample
Description Variable
name and value
SR investor (in %)
Non-SR investor (in %)
Total (in %)
v2 Goodman–
Kruskalc
Gender
Female Female=1 28.74 27.27 27.98 0.096 0.036
Male Female=0 71.26 72.73 72.02 (0.757) (0.310)
Age
\20 Age (metric) 1.15 2.19 1.68 8.849 0.124
20–29 25.29 33.88 29.69 (0.124) (1.662)
30–39 22.41 22.95 22.69
40–49 22.99 15.85 19.33
50–59 20.11 14.21 17.09
60–69 6.90 7.65 7.28
C70 1.15 3.28 2.24
Education
University graduate Un=1 76.80 72.00 74.28 1.144 0.126
Not university graduate
Un=0 23.20 28.00 25.72 (0.285) (1.080)
Marital status
Relationship/married Mar=1 73.26 70.11 71.63 0.433 0.077
Single/divorced/
widowed
Mar=0 26.74 29.89 28.37 (0.510) (0.661)
Household size
1 15.47 23.00 19.42
2 House 30.39 34.00 32.28 5.621 0.179**
3–4 (metric) 35.36 28.50 31.76 (0.132) (2.350)
[4 18.78 14.50 16.54
Inv. decision
On behalf of others Dep=1 40.88 30.00 35.17 4.936** 0.235**
For oneself Dep=0 59.12 70.00 64.83 (0.026) (2.301)
Inv. volume
\500,000 Volume=1 56.91 44.50 50.39 1.506 -0.196 [500,000 Volume=2 11.60 13.50 12.60 (0.220) (-1.255)
N.A. 31.49 42.00 37.01
Residence
Europe 85.96 81.56 83.71 3.952 -0.136
North America 8.19 14.53 11.43 (0.139) (-0.984)
Rest 5.85 3.91 4.86
Total 47.51 52.49 100.00
This table presents the demographic characteristics of the survey sample divided by SR investors and non-SR investors. Thev2test and the Goodman–Kruskalctest are based on the two investor groups. Thepvalues and, respectively,zstatistics are in parentheses
** indicates a significance level of 5 %
Table 2 Variable overview Abbreviations or
variable names
Exact wording of the questions and answer options
Reasons Why does sustainability matter to you?
PersValues Because of my personal values and ethics FeelGood Means doing good while investing
Society Due to the increasing importance of sustainability in society FinSustain Sustainability doesn’t matter to me, unless in a purely financial sense
Religion Based on religious views
HighReturn Sustainable investments have higher returns in the longer run
LowRisk Sustainable investments are less risky than conventional investments, but they give the same return in the longer run
Sustainable investments have a somewhat lower return than conventional investments, but they are less risky
Implementation Non-monetary or ethical objectives can be implemented in several ways. In which way do you implement yours?
Donation Charitable donations
SRI Investing in sustainably-run firms or projects that are in line with my personal values
Voluntary Voluntary work in social organizations Voting right Exertion of voting rights
SR issues Which of the following factors are most important in determining whether a company’s behavior can be considered sustainable?
Economizing Economizing
Pollution Reduction of pollution and waste
Human right Human rights
RenewEn CO2-emission reduction and renewable energy Product Product innovation and responsibility
Employee Personnel policies
Financial Purely financial sustainability
Board Independent executive board and supervisory body Charity Efforts for non-profit purposes
Cooperative Cooperativeness (Transparent cooperation with (local) regulatory authorities.)
Opt. level If investment possibilities exist that are in line with your non-monetary or ethical objectives, which percentage of your available investment volume (exclude owner-occupied property) would you invest sustainably?
Willingness to double If your investment volume was double the amount, which percentage would you then invest sustainably?
Same amount The same amount
Double the amount Double the amount More than double the
amount
More than double the amount
Saturation Are your non-monetary or ethical ambitions satisfied if a certain amount is invested sustainably?
Table 2 continued Abbreviations or variable names
Exact wording of the questions and answer options
Yes Yes, if the investment perfectly fits my notion of sustainability No, linear utility No, double the amount invested sustainably is twice as satisfying No, declining benefits No, the more the better, but the additional benefit declines
Possible category You have found a sustainably managed company whose objectives are in line with your non-monetary or ethical objectives. How do you assess your share of this company’s sustainability with respect to the financing form (stock, bond, mutual fund)?
All categories All investment categories are possible Stocks I would only choose stocks of this company Bonds I would only choose bonds of this company
Funds I would invest indirectly in this company through SR mutual funds Preferred category Which asset class do you prefer if you focus on your sustainable investments?
This table presents all survey items that are used in this paper with the exception of questions regarding socio-demographic characteristics
Table 3 Implementation of non-monetary objectives and reasons for SRI
N % Gender Age Education
v2 Goodman–
Kruskalc
v2 Goodman–
Kruskalc
v2 Goodman–
Kruskalc Implementation
Donation 204 53.54 7.831*** 0.327*** 6.212 0.118 0.012 0.013
SRI 163 42.78 3.270* 0.209* 9.096 0.097 0.865 0.111
Voluntary 121 31.76 0.211 0.057 7.721 0.038 0.618 0.101
VotingRight 58 15.22 3.728* -0.351* 19.707*** 0.412*** 1.011 -0.155 Reasons
PersValues 173 45.41 7.761*** 0.317*** 11.104* -0.019 2.340 0.180 FeelGood 147 38.58 7.864*** 0.319*** 10.120 -0.157** 0.038 0.024
Society 98 25.72 0.367 0.080 6.867 -0.038 0.003 0.007
FinSustain 64 16.80 11.542*** -0.612*** 16.710** 0.291*** 0.633 -0.120
HighReturn 62 16.27 0.026 -0.026 11.312* -0.163 0.091 0.049
LowRisk 61 16.01 0.224 0.073 6.006 -0.027 0.292 0.089
Religion 11 2.89 0.396 0.197 5.829 -0.035 1.640 0.561
OtherReason 10 2.62 0.021 0.050 7.849 0.205 1.096 -0.325
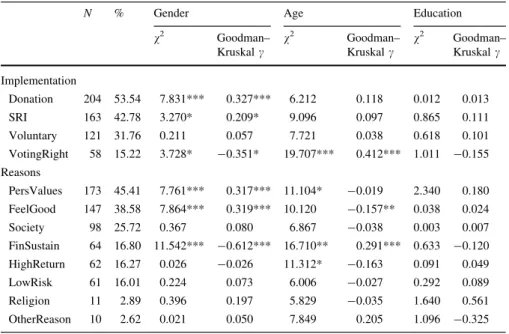
This table shows the total number and the percentage of responses regarding the implementation of non- monetary and ethical objectives (Implementation) and the reasons for investing socially responsibly (Reasons). Due to multiple answers, the percentage of the responses does not sum up to 100 %. The influence of gender, age and education in a bivariate analysis is presented by thev2 statistics and the Goodman–Kruskalc
***, ** and * indicate a significance level of 1, 5 and 10 %
Table4ThemostimportantissuesinSRI N%Orderin%GenderAgeEducation 123v2cv2cv2c SRissues Economizing19751.7121.5218.1112.074.872-0.09723.707-0.0142.329-0.123 Pollution19450.9212.6022.8315.491.315-0.02623.2360.0331.5420.068 HumanRight16342.7824.938.149.7128.529***0.440***24.317-0.235***3.0490.086 RenewEn14638.3214.4411.2912.609.212**0.258***16.926-0.0167.140*0.243** Product11329.664.7211.8113.1212.914***-0.415***20.8750.129*2.3070.009 Employee11129.132.3612.6014.172.2430.11516.286-0.0502.6290.035 Financial7319.1612.342.624.2013.038***-0.453***22.1690.228***3.480-0.178 Board4912.862.104.726.040.331-0.04723.3890.213**4.461-0.285** Charity174.5950.521.572.364.460-0.07221.4570.2624.352-0.088 Cooperative153.940.520.522.891.191-0.12910.659-0.357*1.980-0.185 ThistablepresentsthetotalnumberandthepercentageofresponsesintermsofthemostimportantissuesinSRI.Thefourth,fifthandsixthcolumnreportsthepercentage ofresponsesaccordingtothefirst,secondandthirdmostimportantfactors.Duetomultipleanswers,thepercentageoftheresponsesdoesnotsumupto100%.The influenceofgender,ageandeducationinabivariateanalysisispresentedbythev2statisticsandtheGoodman–Kruskalc ***indicatesasignificancelevelof1%
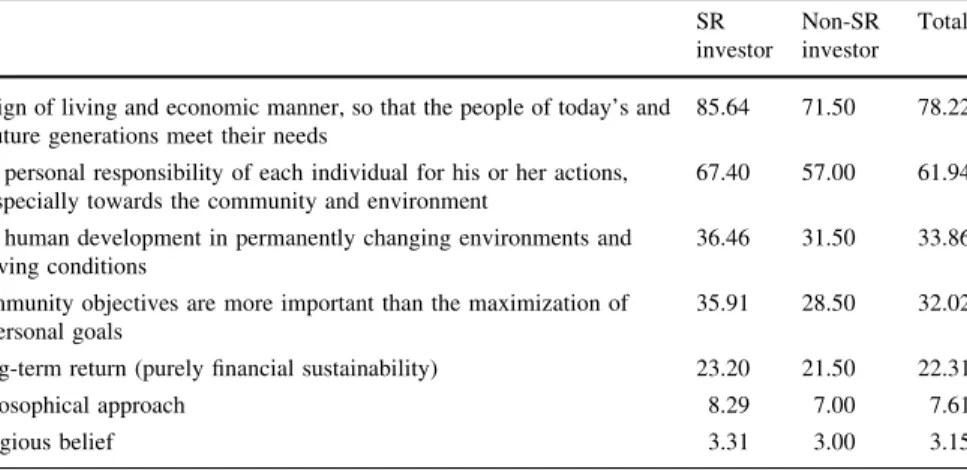
the investment decision. As the participants were allowed to choose more than one possible answer, the percentages of the responses does not sum up to 100 %. The majority tends to donate and to invest their money socially responsibly. The reasons for SRI are mainly personal values and ethics as well as the feeling of doing good while investing. In order to consider the influence of demographics such as gender, age and education we apply the v2 test and the Goodman–Kruskal c test in a bivariate analysis. The results show that providing donations and SRI are preferred by women while men and older investors prefer to choose active engagement [as denoted by Lewis and Mackenzie (2000b)] by exercising their voting right. The belief in high financial performance or low risk of SR investments is for about 24 % of the participants an incentive to invest sustainably. About one-sixth of all participants, who tend to be men and older, state that sustainability only matters in the purely financial sense. Religious reasons are of subordinate importance.
With respect to the most important issues in terms of SRI, as shown in Table4, environmental aspects such as economizing in the sense of the economical use of resources and the reduction of pollution and waste are most frequently chosen. This is in line with the survey results of Rosen et al. (1991) who asked participants about the essential factors to determine SR corporate behavior. Similarly, Berry and Junkus (2013) show that both SR investors and non-SR investors consider environmental issues to be most important. While women and younger investors care more about human rights, product innovation and responsibility is taken seriously by men and older persons. The issue of renewable energy is relevant for women and the better educated. Comparable to the results of Table3, the notion of purely financial sustainability is associated with SRI mostly by men and older investors in our data sample.
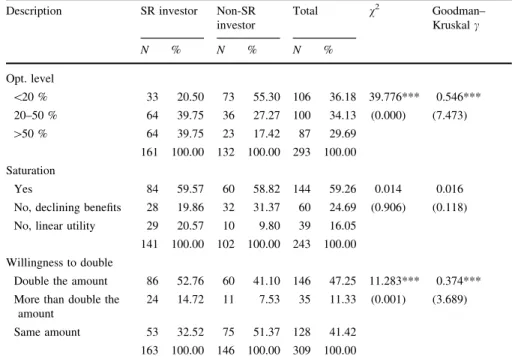
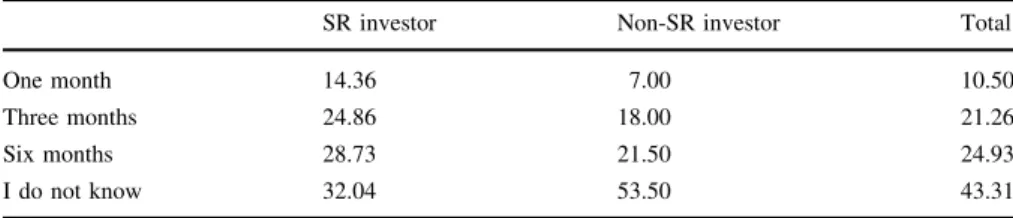
When considering the questions about preferences and perceptions towards SRI, significant differences between SR investors and non-SR investors are revealed in the bivariate analysis as reported in Table5. At first glance, a substantial proportion of the non-SR investors have not answered the corresponding questions due to a possible lack of interest in investing socially responsibly. However, account should also be taken that respondents who were not sure about the questions are also not included in the evaluation. While most respondents in both investor groups perceive a satisfaction of their non-monetary or ethical objectives if a certain amount is invested sustainably, the high ambition of the SR investor subset to invest socially responsibly is characterized by a higher optimal proportion of SR investments. On this account, the participants were offered possible answers regarding the desired SR level in ten percentage steps up to more than 60 %. The last choice is selected by only 31.06 % of the SR investors and 15.91 % of the non-SR investors. For the sake of clarity and an easier statistical treatment, we aggregate the options in three categories as reported in Table5. The large majority of SR investors would invest at least 20 % of their available volume in a socially responsible way, whereas more than half of the non-SR investors prefer to have less than 20 % of SR investments in their portfolio. Similarly, about two thirds of the SR investors, compared to less than half of non-SR investors, are willing to invest at least double the amount socially responsibly if their investment volume is double the amount.
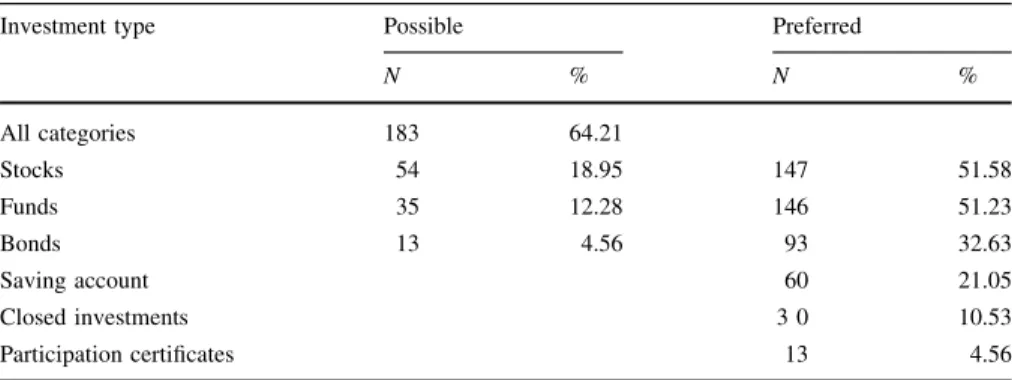
Concerning the question of the dependence of non-financial benefits on the form of financing, the descriptive results as shown in Table6reveal that more than half of the investors estimate their participation in a firm’s CSR as independent if risk and return preferences are disregarded. Almost a fifth of the participants obtain non- financial utility only through stocks of a certain sustainable company and a minority has the opinion that this is only possible by investing in funds or bonds. With regard to the preferred form of SR investments, stocks and funds are the securities favored by over half of the participants in each case.
5 Results
This section presents the regression results which are utilized to research the hypotheses. The main aim of this study is to determine empirically the variables that influence the optimal proportion of SR investments. It also involves the matter of the marginal non-monetary utility that individuals derive from the additional
Table 5 The optimal SR level, the perception of a saturation and the willingness to double
Description SR investor Non-SR
investor
Total v2 Goodman–
Kruskalc
N % N % N %
Opt. level
\20 % 33 20.50 73 55.30 106 36.18 39.776*** 0.546***
20–50 % 64 39.75 36 27.27 100 34.13 (0.000) (7.473)
[50 % 64 39.75 23 17.42 87 29.69
161 100.00 132 100.00 293 100.00 Saturation
Yes 84 59.57 60 58.82 144 59.26 0.014 0.016
No, declining benefits 28 19.86 32 31.37 60 24.69 (0.906) (0.118) No, linear utility 29 20.57 10 9.80 39 16.05
141 100.00 102 100.00 243 100.00 Willingness to double
Double the amount 86 52.76 60 41.10 146 47.25 11.283*** 0.374***
More than double the amount
24 14.72 11 7.53 35 11.33 (0.001) (3.689)
Same amount 53 32.52 75 51.37 128 41.42
163 100.00 146 100.00 309 100.00
This table presents the total number and the percentage of responses regarding the optimal proportion of SR investments the participants seek, the perception of a saturation towards the non-monetary utility and the willingness to double the amount that is invested socially responsibly if the investment volume was double the amount. The columns SR investor and non-SR investor report the absolute amount and percentage of responses in each subgroup. Thev2test and the Goodman–Kruskalctest are based on the two investor groups. Thepvalues and, respectively,zstatistics are in parentheses
*** indicates a significance level of 5 %
sustainably invested amount. For this purpose, we conduct multivariate analyzes on the data sample.
In order to test hypothesis H1 and the hypotheses H2a–H2c as described in Sect.2, we use different sets of variables to estimate a series of ordered logit models. The dependent variable is the desired proportion of SR investments. The ordered categorical variableLevel here represents three groups of optimal SR level as reported in Table5:
Leveli¼
1:\20% of SR investments;
2:2050% of SR investments;
3: [50% of SR investments:
8<
:
We received a total of 293 answers regarding the desired optimal proportion of SR investments. None of the participants who would not adopt SRI or cannot answer this question are included in the evaluation. Due to missing values in the inde- pendent variables, the highest number of observations is 275 in the ordered logit regression analysis.
As several studies (e.g., Sutter2009; Eriksen and Kvaløy2010; Andersson et al.
2013) provide evidence of the fact that investment decisions made on behalf of others differ from choices that individuals make for themselves, it is also interesting to investigate whether such a difference also occurs in the choice of the optimal SR proportion. Thus, we add the number of persons that are affected by the investment decision, and demographic information such as gender, age, education and marital status (see Table1), to the set of controls in all regression models. The variable is defined as Decisioni¼Depi ðHouse1Þ þ1, whereby Depi¼1 denotes the case if investment decisions are also made on behalf of others and House expresses the household size. To reflect the significant differences in the optimal proportion of SR investments between the two investor groups as reported in Table5, we also include the dummy SRinv as a control variable, whereby SRinvi¼1 defines an SR investor.
All variables are defined as dummies with the exception ofAge(metric) and the two ordered categorical variables Volume(see Table 1) as well as Financial (see Table4) of which the latter reflects the importance of securing financial return in the long run and is defined in the following way.
Financiali¼
0:respondents who did not choose this option;
1:respondents who chose this option in the 3rd position;
2:respondents who chose this option in the 2nd position;
3:respondents who chose this option in the 1st position:
8>
><
>>
:
The required variables to represent the perceived saturation of ethical goals through SRI (Sat) and the willingness to double the amount of SR investments (Double) to check hypothesis H1 are also defined as dummies. Although both variables origi- nally comprise three categories, we summarize two similar response possibilities.
This means that participants who are at least willing to double the amount of SR investments, if the available capital is doubled, are covered by Doublei¼1, which consequently also includes those who would invest more than double the amount.
Analogously, if no saturation of the non-financial utility is perceived (no matter whether the utility is linearly or declines), the variable is defined as Sat ¼0,
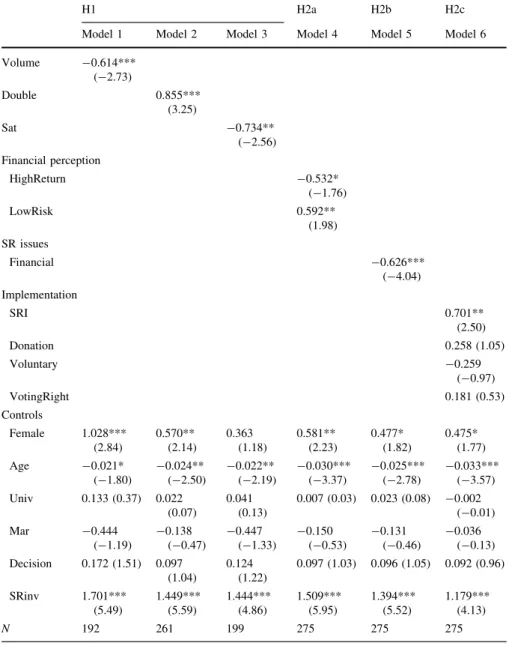
otherwise Sati¼1 holds. The results of the ordered logistic regression analysis are presented in Table7.
5.1 The non-financial utility and the optimal level of SR investments
We check hypothesis H1 both indirectly by model 1 and model 2, and directly by model 3 as described in Sect.2. Model 1 includes besides all control variables the demographic information about the available investment volume. Since this information is not provided by almost 40 % of our survey sample, the inclusion of Volume would lead to a notable reduction of the number of observations. Thus, it is omitted in the remaining regressions.
The negative coefficient of Volume indicates that the desired optimal proportion of SR investments tends to be lower for investors with high investment volumes.
Moreover, the positive coefficient of the Double dummy in model 2 reveals that the willingness to invest at least double the amount if the investment volume was double the amount is positively related to the optimal SR level. The results affirm indirectly the assumption that the non-financial utility derived from investing socially responsibly does not increase linearly with the invested amount. This is also supported by model 3 which shows that investors who perceive a satisfaction regarding their sustainable and ethical objectives, if a specific sum of their available volume is invested socially responsibly, target a lower level of SR investments.
Hence, based on our survey data, hypothesis H1 can be confirmed.
In order to investigate further drivers of the optimal proportion of SR investments that investors seek, we create the models 4–6, besides the regression models 1–3, to check the hypotheses H2a, H2b, and H2c. While the coefficient of LowRisk is positive, the variable HighReturn is negatively related to the optimal SR level in model 4. Investors who believe that SR investments are not as risky as conventional investments tend to seek a higher SR level in their portfolio. However, the same connection does not apply to a positive perception regarding the financial return of
Table 6 Possible and preferred form of SR investments
Investment type Possible Preferred
N % N %
All categories 183 64.21
Stocks 54 18.95 147 51.58
Funds 35 12.28 146 51.23
Bonds 13 4.56 93 32.63
Saving account 60 21.05
Closed investments 3 0 10.53
Participation certificates 13 4.56
This table presents the total number and the percentage of responses regarding the investment type which are considerable for SRI and, respectively, which are actually preferred by the participants. The numbers in the third column are based on the responses of the 285 participants who had answered the question on the possible SR investment type. Due to multiple answers in terms of the preferred form of SR invest- ments, the percentage of responses does not sum up to 100 %
Table 7 Regression results on the optimal level of SR investments
H1 H2a H2b H2c
Model 1 Model 2 Model 3 Model 4 Model 5 Model 6
Volume -0.614***
(-2.73)
Double 0.855***
(3.25)
Sat -0.734**
(-2.56) Financial perception
HighReturn -0.532*
(-1.76)
LowRisk 0.592**
(1.98) SR issues
Financial -0.626***
(-4.04) Implementation
SRI 0.701**
(2.50)
Donation 0.258 (1.05)
Voluntary -0.259
(-0.97)
VotingRight 0.181 (0.53)
Controls
Female 1.028***
(2.84)
0.570**
(2.14)
0.363 (1.18)
0.581**
(2.23)
0.477*
(1.82)
0.475*
(1.77) Age -0.021*
(-1.80)
-0.024**
(-2.50)
-0.022**
(-2.19)
-0.030***
(-3.37)
-0.025***
(-2.78)
-0.033***
(-3.57) Univ 0.133 (0.37) 0.022
(0.07)
0.041 (0.13)
0.007 (0.03) 0.023 (0.08) -0.002 (-0.01) Mar -0.444
(-1.19)
-0.138 (-0.47)
-0.447 (-1.33)
-0.150 (-0.53)
-0.131 (-0.46)
-0.036 (-0.13) Decision 0.172 (1.51) 0.097
(1.04)
0.124 (1.22)
0.097 (1.03) 0.096 (1.05) 0.092 (0.96)
SRinv 1.701***
(5.49)
1.449***
(5.59)
1.444***
(4.86)
1.509***
(5.95)
1.394***
(5.52)
1.179***
(4.13)
N 192 261 199 275 275 275
This table presents the results of the ordered logit analysis. The dependent variable is the ordered categorical variable Level that reflects the optimal proportion of SR investments: Leveli¼1 for those who would invest less than 20 % of their volume socially responsibly; Leveli¼2 for those who would invest 20–50 % of their volume socially responsibly and Leveli¼3 for those who would invest more than 50 % of their volume socially responsibly. The definitions of the independent variables in the first column are provided in Tables1,2,3,4and5. Thetstatistics are in parentheses
***, ** and * indicate a significance level of 1, 5 and 10 %
SR investments. Therefore hypothesis H2a is only partially supported. It should be noted that only SR investors believe in a superior financial performance of SR investments. Model 5 provides evidence that investors who regard a sustainable yield retention to be more important than SR considerations, which however cannot be achieved by SR investments, are more likely to seek for a lower optimal socially responsible invested percentage. Furthermore, the positive coefficient of the SRI dummy shows that individuals who claim to implement their non-monetary or ethical objectives by SRI would also choose a higher proportion of SR investments.
Hence, both hypothesis H2b and H2c are confirmed.
In view of the influence of demographic variables, women and slightly younger persons are in most regression models more likely to seek a higher optimal proportion of SR investments. The Female variable is not significant in model 3 since more women than men perceive a satisfaction of their non-monetary objectives by investing a certain amount socially responsibly. Due to significant differences between the two investor groups in terms of the desired optimal proportion of SR investments, as reported in Table5, the SRinv dummy strongly influences the dependent variable positively in all regression models. The control variable Decision representing the number of persons who are affected by the investment decision of the respondent has a positive, but not significant coefficient, which may be explained by the fact that more SR investors make investment decisions on behalf of others compared to the subset of non-SR investors, as discussed in Sect.4.
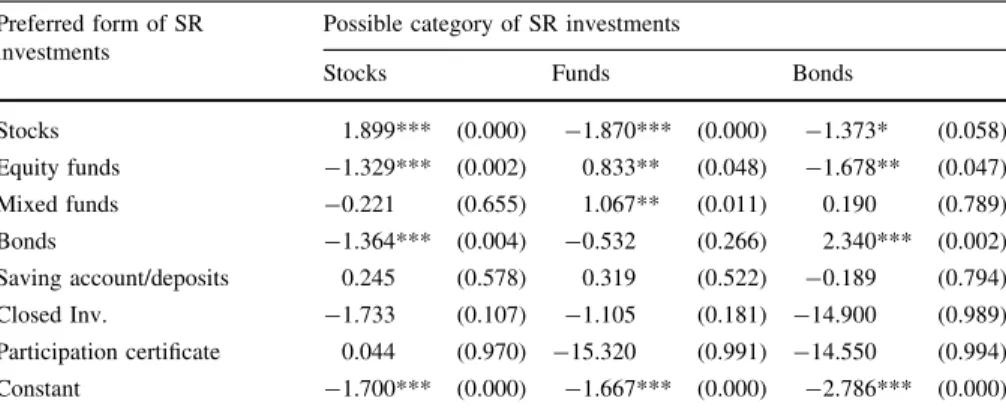
5.2 The allocation of CSP
As described in Sect.4.2, irrespective of the method of financing, the majority of the respondents perceives the participation in a firm’s CSP in the same way for debt
Table 8 Multinominal logistic regression on the possible category of SR investments Preferred form of SR
investments
Possible category of SR investments
Stocks Funds Bonds
Stocks 1.899*** (0.000) -1.870*** (0.000) -1.373* (0.058)
Equity funds -1.329*** (0.002) 0.833** (0.048) -1.678** (0.047)
Mixed funds -0.221 (0.655) 1.067** (0.011) 0.190 (0.789)
Bonds -1.364*** (0.004) -0.532 (0.266) 2.340*** (0.002)
Saving account/deposits 0.245 (0.578) 0.319 (0.522) -0.189 (0.794)
Closed Inv. -1.733 (0.107) -1.105 (0.181) -14.900 (0.989)
Participation certificate 0.044 (0.970) -15.320 (0.991) -14.550 (0.994)
Constant -1.700*** (0.000) -1.667*** (0.000) -2.786*** (0.000)
This table presents the results of the multinominal logistic regression analysis on the possible category of SR investments. The comparison group consists of the 183 respondents who would assess their contri- bution to a socially responsible company in the same way for equity or debt investments, as reported in Table6. The columns two till four contain the group of investors who perceive their non-financial or ethical objectives to be satisfied only by investing in stocks, funds or bonds. The rows list the preferred form of SR investments. The total number of observations is 285. The p values are in parentheses
***, ** and * indicate a significance level of 1, 5 and 10 %