Geocryological and Hydrogeological Conditions of the Western Part of Nordenskiold Land (Spitsbergen Archipelago)
N. E. Demidova, *, A. L. Borisika, S. R. Verkulicha, S. Wetterichb, A. Yu. Gunarc, V. E. Demidova, N. V. Zheltenkovac, A. V. Koshurnikovc, V. M. Mikhailovaa, A. L. Nikulinaa, A. L. Novikova, L. M. Savatyugina, A. N. Sirotkind, A. V. Terekhova, Yu. V. Ugrumova, and L. Schirrmeisterb
aState Research Center “Arctic and Antarctic Research Institute”, St. Petersburg, 199397 Russia
bHelmholtz Center for Polar and Marine Research, Alfred Wegener Institute, Potsdam, 14473 Germany
cFaculty of Geology, Moscow State University, Moscow, 19991 Russia
dPolar Marine Geological Exploration Expedition, Lomonosov, 198412 Russia
*e-mail: nikdemidov@mail.ru
Received August 31, 2020; revised September 15, 2020; accepted September 16, 2020
Abstract—This work summarizes the archived data of geocryological and hydrogeological conditions in the west of Nordenskiold Land on the Spitsbergen Archipelago. The historical data obtained in the Soviet period during coal exploration are reviewed together with the results of our own studies performed as part of the Rus- sian Scientific Arctic Expedition on Spitsbergen (RAE-S) in 2016–2020. With respect to geocryology, the region is assigned to the zone of continuous permafrost. The thickness of rocks and sediments with tempera- tures below zero is about 100 m near the coast and increases to 540 m on watersheds. The mean annual ground temperature near the zero-amplitude depth varies from –3.6 to –2.2°C. Below this layer, the temperature curve in the top part of the section tends to deviate toward positive temperatures, ref lecting the modern cycle of climate warming. From the hydrogeological point of view, the area belongs to the marginal zone of the West Spitsbergen cryoadartesian basin. Seawater intrusions near the coast form saline subpermafrost aqui- fers, including those with temperatures below zero, ref lecting the seawater (sodium chloride) composition and hydraulic heads close to sea level. Fresh and slightly saline (sodium bicarbonate on the east coast of Grønfjorden and magnesium–calcium sulfate in gypsum-bearing deposits on the west coast) subpermafrost water with hydraulic heads reaching 100 m above sea level is fed by water-saturated ice in the deep layers of large glaciers.
Keywords: Spitsbergen, permafrost, temperature monitoring borehole, EM sounding, GPR, cryogenic struc- ture, pingo, subpermafrost water, warm-based glaciers, West Spitsbergen cryoadartesian basin
DOI: 10.1134/S000143382011002X
INTRODUCTION
The Spitsbergen Archipelago is the first of the Arc- tic archipelagos of Eurasia located in the way of west- ern air masses and is characterized by intensively developing processes of cryosphere degradation due to climate warming. Like other areas of the cryolitho- zone, the study of the dynamics of permafrost on Spitsbergen is not only a scientific task related to its impact on landscapes, hydrosphere, and biogeochem- ical cycles of greenhouse gases; it is also an applied problem, because permafrost affects the stability of the foundations of constructions, water f lows to mines, water supply aspects, etc. This article is devoted to the main features of the permafrost–hydrogeological conditions in the west of the Nordenskiold Land, where Russian (formerly Soviet) mines and the settle- ments of Barentsburg, Kolsbey, and Grumant are located. In recent years, the Russian Scientific Center
on Spitsbergen has been comprehensively monitoring the archipelago cryosphere.
This research area is one of the most interesting regions of the high-latitude Arctic, and its perma- frost–hydrogeological conditions are the most com- prehensively studied. In 1912, a Russian expedition under the leadership by V.A. Rusanov revealed a vast coal-bearing area and installed pegs on the Grumant field, where coal mining began the next year. In 1932, the Arktikugol enterprise was founded and began per- forming all works related to the study and exploitation of coal deposits belonging to the USSR by the order of the Soviet Government. The Barentsburg field was purchased from a Dutch mining company Nederland- sche Spitsbergen Compagnie (NESPICO). Since that time, the Soviet Union performed large-scale pros- pecting and exploration work for coal there, including exploratory drilling and drilling of specialized hydro- geological wells to assess water f lows to mines (Rossi-
iskie…, 1998). By 1976, the drilling volume reached 80 400 lineal meters, and the contract areas were cov- ered by a network of wells with a distance between them of at least 250 m. In 1975, the Grumant para- metric well of a depth of 3173 m was drilled in the set- tlement of Kolsbey, using the Leonid Krasin icebreaker as a residential and energy base. Its aim was to assess the oil and gas potential and obtain reference data on the geology, hydrogeology, and geophysics of the West Spitsbergen trough and the surrounding shelf (Gram- berg et al., 1985). Frozen rocks and groundwater were also studied as a part of engineering–geological sur- veys for the construction of mine infrastructure and settlements and for revealing sources of water supply (Kasatkin and Neizvestnov, 1983; Kurkov and Neiz- vestnov, 1983; Misnik and Belousov, 1983). The main works were performed by the Spitsbergen party of the Sevmorgeologiya Industrial Geological Association by the order of Arktikugol.
The first Soviet weather station on the archipelago was established at the Grumant mine in 1932 and was moved to Barentsburg in 1933 (WMO index 20107).
Meteorological and marine hydrological observations at this station were only interrupted during World War II (Antsiferova, 2020). Prior to it, the Green Harbour Norwegian Weather Station (WMO index 99821), the oldest one on Spitsbergen, functioned on Cape Finne- set from 1911 to 1930. It was located only 2 km from the modern weather station in Barentsburg (Forland et al., 1997). Data from these two weather stations make it possible to assess trends in the air temperature variation in the study area over a period of more than 100 years.
Similarly to the entire archipelago, the studied area is characterized by land glaciation, which deter- mines specific permafrost–hydrogeological condi- tions. Research on Spitsbergen by the Soviet Glacio- logical Expedition of the Institute of Geography of the Academy of Sciences of the Soviet Union began in 1965 (Glyatsiologiya…, 1985). B.I. Vtyurin, a member of the glaciological expedition, studied the cryogenic structure of Quaternary rocks in outcrops and pits in 1987–1988 (Vtyurin, 1989, 1990).
It should be pointed out that the works by B.I. Vtyurin (1989, 1990) and N.I. Obidin (1958) and the Hydrogeology, Engineering Geology, and Geomor- phology of the Svalbard Archipelago collection of articles (1983) are some of few published academic works of the Soviet period devoted to permafrost and groundwater in the area of mines on Spitsbergen. Most of the works are reports of departments. They are little known in Russia and are not known abroad. For example, the article by Norwegian researchers, which generalizes the history of permafrost study of the Spitsbergen Archipelago (Hum- lum et al., 2003), does not contain any references to the works of Russian (Soviet) authors.
Research into permafrost started again in Barents- burg in 2016 as part of works of the RAE-S of the Arctic and Antarctic Research Institute (AARI) (Demidov
et al., 2016, 2019; Demidov, V.E. and Demidov, N.E., 2019). They included the creation of a network of wells to monitor the temperature of frozen rocks according to the Global Terrestrial Network for Permafrost (GTN-P) (Biskaborn et al., 2019), the study of their cryogenic structure and salinity, monitoring the sea- sonally thawing layer (STL) according to the Circum- polar Active-Layer Monitoring (CALM) program (Brown et al., 2000; Nelson et al., 2004), researching the internal structure of heaving mounds and other cryogenic phenomena, electrical explorations to map taliks and georadar studies of glaciers to isolate warm ice and subglacial taliks, and the study of the chemical composition of springs and icings.
The aim of this work is to summarize data on the geocryological and hydrogeological conditions of Barentsburg, Kolsbey, and Grumant, including new ones and those obtained in the Soviet period, and to make them available to the scientific community in order to form the basis for further studying and moni- toring of the underground cryosphere in this region of Spitsbergen.
STUDY AREA
Orohydrography. The studied area is located on the Nordenskiold Land (Lotsiya…, 2001) on the western coast of West Spitsbergen, which is a part of the Spits- bergen Group of Islands (Archipelago) (the old Rus- sian name is Grumant, and the old Scandinavian and modern Norwegian name of the Spitsbergen Islands, together with Medvezhii Island, is Svalbard). The western coast of West Spitsbergen, washed by waters of the Greenland Sea, is characterized by a large number of narrow, branched, and mostly deep fiords which extend far into the land. The three settlements and mines are located on the southern coast of Isfjorden, in its bays and fjords: Barentsburg on the eastern shore of Grønfjorden, Kolsbey on the eastern shore of the Coles Bay, and Grumant on the shore of Isfjorden 4.5 km to the northeast of the Rusanova Cape (Fig. 1). Moun- tain ranges to the west of Grønfjorden formed by sharply folded rocks stretch in the meridional direc- tion. Gently sloping bedrocks to the east of Grøn- fjorden look like mountains, because they are deeply dissected by an erosion network. Grendalen, Hollen- dar, and Coles are the most extensive valleys. Moun- tain peaks reach 900 m in altitude.
The climate of the region is strongly affected by the warm West Spitsbergen Current and warm and humid air masses from the Atlantic Ocean. Therefore, the air temperature here is higher than would be expected for these Arctic latitudes. The polar day in Barentsburg lasts 125 days, and the polar night is 112 days (Obidin, 1958). The air temperature may sharply f luctuate in any month between negative and positive values.
The mean, maximal, and minimal annual tem- peratures over the period from 1912 to 2018 are given
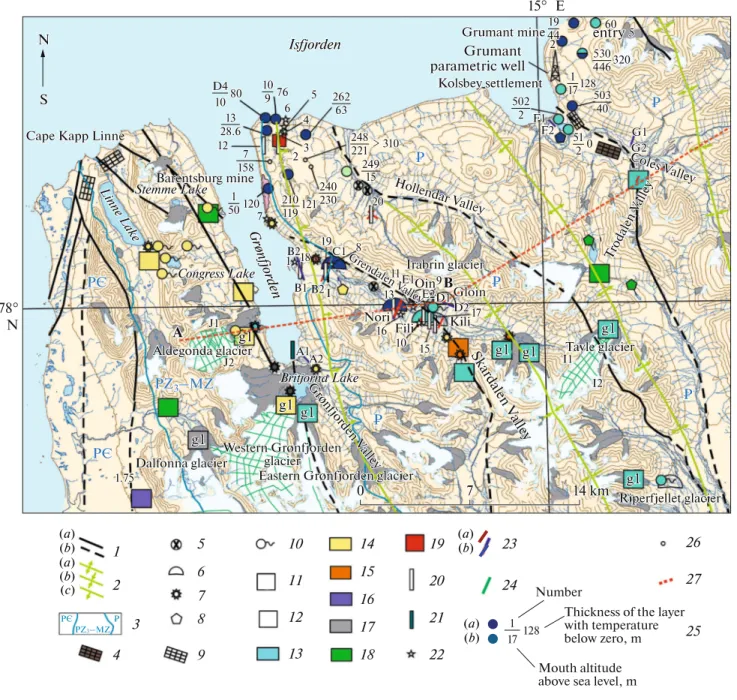
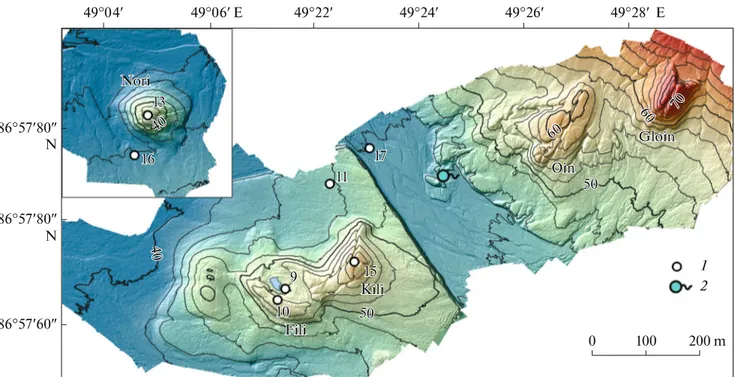
Fig. 1. Map of the actual material used in the article. (1) Faults: identified (a) and assumed (b); (2) main plicative structures of the Paleogene complex: elevations (a), depressions (b), and monoclines (c); (3) areas of geological complexes of different ages:
Precambrian (PC), Upper Paleozoic–Mesozoic (PZ3–MZ), and Paleogene (P); (4) wedge ice; (5) thermokarst craters (accord- ing to data of 2019); (6) long-term heaving mounds; (7) ice mounds (blisters); (8) lake waters; (9) ground polygons; (10) sources;
(11) icings near glaciers; and (12) icings of underground waters of deep and shallow runoff. For springs, lakes, ice of heaving mounds, and waters feeding ice and ice mounds, the tints in the map correspond to the following dominating ions in mg/L (data of RAE-S, 2019–2020): (13) and Na+; (14) and Ca2+; (15) and Mg2+; (16) and Mg2+; (17) and Ca2+; (18) and Na+; (19) the CALM plot with automatic meteorological complex (RAE-S, 2016–2020); (20) station- ary thermometric wells (RAE-S, 2016–2020); (21) towed sensor at the bottom of the fjord (RAE-S, 2019–2020); (22) wells with single thermometric measurements (RAE-S, 2016–2020); (23) profiles of EM sounding (RAE-S, 2019): (a) areas without con- ductors in the section and (b) areas with conductors; (24) GPR profiles (RAE-S, 2018–2020); (25) coal exploration and hydro- geological wells (1932–1986). The waters that are revealed are (a) saline sodium chloride and (b) sodium bicarbonate; (26) wells without data on aquifers (1932–1986); and (27) line of permafrost–hydrogeological section (Fig. 12).
26 27 N
N
S S
N
E
Cape Kapp Linne Cape Kapp Linne Cape Kapp Linne
Isfjorden Isfjorden Isfjorden
80 80 80 767676
20 20 20 19
19 19
9 9
17 17 17 15
15 10 15 10 10 16 16 16 13 13
13111111 BB
D2 D2 D2
I2 I2 I2 I1 I1 I1 D1
D1 E2D1 E2 E2 E1 E1 E1 8
C1 8 C1 C1 B2 B2 B2 B1 B1 B1
A1 A1 A1A2A2A2 J2
J2 J2 J1 J1
A J1
A
g1 g1 g1
g1 g1 g1 g1 g1 g1
g1 g1 g1
g1 g1 g1 g1g1g1
g1 g1 g1
g1 g1 g1
1.75 1.75 1.75
B2 B2B2 II 18 18 1 18 1
121 121 120 121
120 120 7 7
5 5
128 128 128
320 320 320
0 0
60 60 60 2
2
> 310
> 310
> 310
F1 F1 F1 F2 F2 F2
G2 G2 G2 G1 G1 G1 5 5
6 6
4 4 3 23 2 12
12 12
10 10 10 9 9
1 1 17 17 17 19 19 19 44 44 44
51 51 51 2 2 D4
D4 D4 10 10 10
128 128 1 128 1 17 17 17 1
1 50 50 50
262 262 262 63 63
63 502502502
2 2
503 503 503 40 40 40 530 530 530 446 446 446
249 249 249 15 15 15 13
13 13 28.6 28.6 28.6 7 7 158 158 158
240 240 240 230 230 210 230 210 210 119 119 119
248 248 248 221 221 221 Linne Lak
e Linn
e Lake Linne Lak
e
Stemme Lake Stemme Lake Stemme LakeBarentsburg mineBarentsburg mineBarentsburg mine
Congress Lake Congress Lake Congress Lake Grønf
jor den Grøn
fjord en Grønf
jor den
Gre ndale
n Vall ey Gren
dalen V alley Gre
ndale n Vall
eyOinOinOin
Gloin Gloin Gloin Irabrin glacier Irabrin glacier Irabrin glacier Holle
ndar V alley Hollendar Valley Holle
ndar V alley
Trodale n Valle
y
Trodalen Valley Trodale
n Valle y Coles V
alley Coles Valley Coles V
alley Grumant mine
Grumant mine
Grumant mine entryentryentry Grumant
parametric well Grumant parametric well Grumant parametric well
Kolsbey settlement Kolsbey settlement Kolsbey settlement
Aldegonda glacier Aldegonda glacier Aldegonda glacier
Western Grønfjorden glacier Western Grønfjorden
glacier Western Grønfjorden
glacier
Eastern Grønfjorden glacier Eastern Grønfjorden glacier Eastern Grønfjorden glacier Dalfonna glacier
Dalfonna glacier Dalfonna glacier
Britjorna Lake Britjorna Lake Britjorna LakeGrønf
jord en V
alley Grøn
fjord en V
alley Grønf
jord en V
alley Nori Nori Nori
Fili Fili
Fili KiliKiliKili Skardale
n V alle
y Ska
rdalen Valley Skardale
n V alle
y
Tavle glacier Tavle glacier Tavle glacier
Riperfjellet glacier Riperfjellet glacier Riperfjellet glacier
Number
Thickness of the layer with temperature below zero, m Mouth altitude above sea level, m
25 (a)
(b)
(a) (b)
(a) (b) (a)
(b) (c)
1 5
6 7 8 9
10 11 12 13
14 15 16
18 17
19 23
20 24 21 22 2
4
PЄ 3 PЄ PЄ PЄ PЄ
PZ3–MZ
PZ3–MZ PZ3–MZ PZ3–MZ
15°
78°
0
0 777 141414 kmkmkm
−3
HCO SO24− SO24− HCO3− HCO3−
− 2
SO4
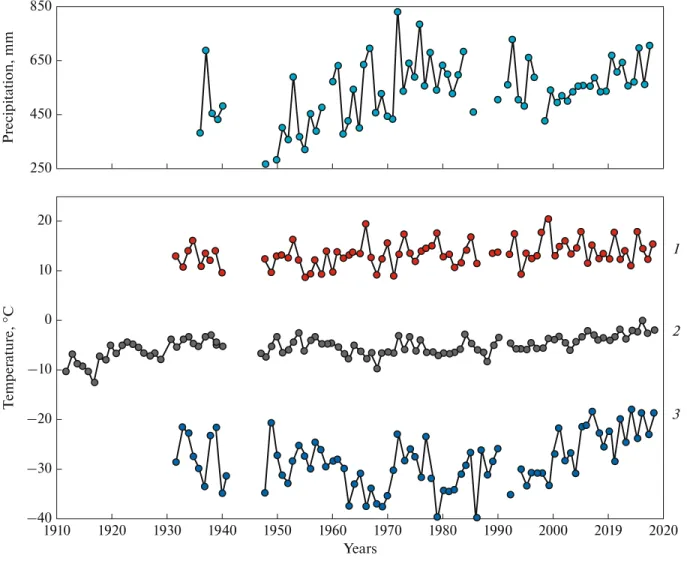
in Fig. 2. The coefficients of the linear trend of anomalies of the mean annual air temperature calcu- lated for 1976–2015 show that the rate of the rise in the mean annual air temperature is 0.92°C per 10 years, which is 1.5 times higher than on the Kola Peninsula and twice as high as the mean for the area of Russia (Antsiferova, 2020).
According to data of the Barentsburg weather sta- tion, there is also an increase in the precipitation amount (Fig. 2). For example, annual precipitation was 482 mm in 1940 and 704 mm in 2018. The precipitation is the greatest from October to March: in the period of particularly high cyclonic activity. The least precipita- tion occurs from April to July, dominated by stable anti- cyclonic weather. In general, the precipitation amount in winter is 1.5–2 times higher than in summer (Antsif- erova, 2020).
According to data of the 65-year-long observation period (Lotsiya…, 2001), the mean date of coastal ice formation in Barentsburg is January 26, and the mean
date of its fracturing is May 5. In 2016–2019, we recorded coastal ice formation only at the head of Grønfjorden, and most of it remained ice-free all year round. In 2020, the coast ice in front of Barentsburg was formed in January and melted in April.
Hydrology. Hydrological works in the studied area were performed according to the order of Arktikugol since the 1930s (Rossiiskie…, 1998) and by the Spits- bergen Glaciological Expedition of the Institute of Geography, Academy of Sciences of the Soviet Union, in 1976–1990 (Oledenenie…, 1975). At the present time, regular hydrological studies are a branch of works of the RAE-S (Romashova et al., 2019).
The Coles, Gren, and Hollendar are the largest riv- ers, more than 20 km long with an annual discharge of about 40 million m3. They have two periods of nour- ishment: spring, when snow melts, and summer–
autumn, when rivers are fed by water of the STL and rain and melt glacial water. The portion of glacial run-
Fig. 2. Changes in precipitation and air temperature by data of meteorological observations in Barentsburg: 1912–1931 are from the Green Harbor Weather Station; 1932–2018 are from the Barentsburg Observatory. (1–3) Temperature: (1) maximal, (2) mean annual, and (3) minimal.
Precipitation, mmTemperature, °C
1
2
3
1910 1920 1930 1940 1950 1960 1970 1980 1990 2000 2019 2020 Years
20 250 450 650 850
10
0
–10 –20
–30
–40
off varies from 20–25% in the Gren River to 50% in the Aldegonda and Grønfjorden rivers and to 90% in the Bretjorna River (Romashova et al., 2019). The constant discharge of rivers lasts about 5 months and usually ends by the beginning of October. More than 90% of river discharge occurs in the 3 summer months (Tret’yakov, 2010). In winter, the rivers freeze to the bottom, except for the Congress River, which is fed by groundwater all year round.
There are several large lakes and many small ones of various origins in the studied area. Valley lakes (Linne, Grendal, and Fara) were formed in the Holocene after the sea regression from the fjords, and some of them may be of thermokarst origin. The Stemme mountain lake, fed by glacial waters, is a source of water supply for the settlement of Barentsburg. Congress Lake, located nearby on a mountain saddle, is of glacial-karst origin.
To the north of Linne Lake, a group of small karst lakes is allocated to the outcrop of Permian limestone on the Vardeborgsletta Plain (Salvigsen and Elgersma, 1985).
Many small thermokarst lakes are formed on the sur- face of moraines of retreating glaciers. Large Lake Bret- jorna fills an exaration basin in front of the moraine of the Western Grønfjorden glacier. The altitude of the lakes does not exceed 100 m above sea level, and only the water edge of Ishjern Lake, located on the mountain saddle, has an altitude of 239 m.
The landscapes of the region are diverse: from those of watershed peaks to the landscapes of valleys, glacial moraines, and coastal plains. Peaks, mountain slopes, and moraines are covered by primary and desert-arctic soils with thin herbaceous–moss–lichen groups. Val- leys and sea terraces are occupied by typical arctic and arctic-tundra soils under sparse willow–forbs–moss groups (Belousov et al., 1983).
Glaciers. Large mountain-valley and twinned gla- ciers (Fritjof, West and East Grønfjorden, Aldegonda, Dalfonna, Linne, Wering, etc.) are located on the west- ern shore of Grønfjorden in the region of relatively high submeridional ridges, which catch moisture from the Atlantic. To the east of Grønfjorden, mountain ranges are mainly free of glaciers. Small hanging and moun- tain-valley glaciers are only preserved in the upper reaches of the Grendalen, Hollendar, and Coles valleys (Tavle, Tunge, Pass, and Ira are the largest of them).
The glaciers of the region are relatively comprehen- sively studied due to the small distance from the settle- ment of Barentsburg (Glyatsiologiya…, 1985; Vasi- lenko et al., 2001; Lavrent’ev, 2008; Romashova et al., 2019; Terekhov et al., 2020). Some large glaciers are characterized by a two-layer structure (Glyatsi- ologiya…, 1985). The top layer of ice is located in the zone of negative temperatures, while ice below the boundary of 50–100 m is at the melting point and con- tains water. The degradation of glaciers is widespread in the west of the Nordenskiold Land during the cur- rent 100-year period as a result of climate warming (Mavlyudov et al., 2012). From 1936 to 2017, the area of
glaciers decreased on average by 49.5%, and their outer edge retreated by several kilometers (Chernov and Murav’ev, 2018). Intraglacial channels are described in a number of glaciers: water through them is drained to bed rocks (Mavlyudov, 2007).
Geology. The studied area is allocated to the con- tact zone of two large structures of the first order (Kra- sil’shchikov, 1973): the horst-anticlinorium of the western coast of Spitsbergen and the West Spitsbergen grabenlike trough. The contact zone of these two structures is represented by the western boundary fault zone (Livshits, 1973) covered by waters of Grøn- fjorden and the Fritjof and Western and Eastern Grønfjorden glaciers.
To the east and southeast of Grønfjorden, the structures of the West Spitsbergen graben-like trough are composed of Lower Cretaceous and Paleogene sedimentary rocks, which are subhorizontal or gently sloping and are represented by sequences of alternat- ing sandstones, siltstones, and argillites; the Paleo- gene deposits also contain layers and lenses of coal and bentonite clays. Cretaceous deposits outcrop only in a small area of the coastal part of Grønfjorden and Isfjorden. In the area of the Barentsburg mine, rock strata are inclined to the east-northeast at an angle of 10–12° (Cretaceous rocks) and 5°–8° (Paleogene rocks).
At the Grumant mine, Cretaceous and Paleogene rocks are characterized by the inclination to the west-south- west at angles reaching 5°–8°. According to A.I. Panov et al. (cited by (Rossiiskie…, 1998)), such an inclina- tion of layers is the result of a modification of the west- ern part of the West Spitsbergen trough by a number of disjunctive and plicative structures, such as the Hollen- dardalen and Coles Bay faults or the Iradalen trough, which are characterized by a submeridional direction;
the fault amplitudes do not exceed 100–150 m.
The geological structure of the western coast of Grønfjorden is more complicated (Sirotkin et al., 2017). Ancient rocks—structures of the horst-anticli- norium of the western coast of Spitsbergen—outcrop here. Precambrian (Mid-Riphean–Vendian) rocks are metamorphosed and are represented by mica-chlorite shale, marbles, quartzites, metabasites, and metatil- lites. The Upper Paleozoic–Mesozoic sedimentary rocks are composed of siltstones, argillites, and sand- stones, which are typical for the entire studied area, and they are accompanied by limestone, dolomites, gyp- sum, and phosphorites. All the rocks are represented by interrelated folds with an inclination of 20°–90° on the wings. They are transformed by a system of faults, as well as dikes and sills of Mesozoic dolerites.
Quaternary deposits are represented by colluvial, proluvial, eluvial-deluvial, alluvial, f luvioglacial, and glacial deposits typical for mountainous countries, as well as by marine rocks. The cover of Quaternary deposits, except for the STL and areas of taliks, is often completely frozen. Some features of its structure are discussed in more detail below.
METHODS OF RESEARCH
The following equipment and approaches were used for implementing works according to the RAE-S project in 2016–2020.
Boreholes were dry-drilled by an UKB-12/25 small-sized rig (Vorovskii machine-building plant, Yekaterinburg, Russia) without blowing. The total volume of drilling was 156 m with a maximum depth of 25 m. The drilling was accompanied by photographs of the cores, by a description of the lithology and cryo- genic structure, and by sampling. Hydrochemical anal- ysis of ice (73 samples) and water samples (93 samples) was performed at a RAE-S chemical-analytical labo- ratory in Barentsburg. We also determined the weight humidity (116 samples) and chemical composition of water extract (195 samples) from samples of frozen rocks (20 g of dry weighted sample to 100 mL of dis- tilled H2O). Granulometric analyses (173 samples) were performed at the laboratory of the Alfred Wegener Insti- tute (Potsdam, Germany) using a Malvern Mastersizer 3000 laser-diffraction particle size analyzer (Great Brit- ain); the GRADISTAT program was used for data interpretation (Blott and Pye, 2001). Geo Precision (Germany) and MGU-Geofizika (Russia) thermistor chains were used to measure the temperature in wells.
The thickness of the STL was measured at the end of the thawing period by a metal probe according to stan- dards of the CALM program.
Electromagnetic (EM) sounding was performed by time domain method using Tem-Fast equipment (AEMR, Ltd., the Netherlands) in a single-loop ver- sion. A square loop of copper wire (25 × 25, 50 × 50, or 100 × 100 m) was used as the radiating and receiving antenna. In general, we analyzed 237 NTES pegs with a current of 1 and 4 A, including 15 profiles of a total length of about 9 km.
Georadar surveys on the glaciers were performed by a pulseEKKO PRO GPR (Sensors&Software, Canada) in combination with the Sokkia GRX2 dual-frequency GPS/GLONASS positioning system (Sokkia Topcon Co, Japan). During the observation, a 50-MHz dipole antenna set on a special sled was dragged behind a snowmobile at a speed of 5–10 km/h. Horizontal and altitudinal coordinates of each analyzed site were determined with high accuracy simultaneously with the recording of geophysical information. The total length of georadar profiles was about 160 km.
Aerial photography of heaving mounds was per- formed from a height less than 120 m with a longitudi- nal and transverse overlap of 60–80% using a DJI Phantom 4 c unmanned aircraft system. The methods used were discussed in more detail in (Demidov et al., 2016, 2019; Koshurnikov et al., 2019).
Published works on underground waters and per- mafrost of Svalbard used for the analysis of previous studies included the following: the collection of scien- tific works of Sevmorgeologiya (Gidrogeologiya…, 1983), articles by N.I. Obidin (1958) and B.I. Vtyurin (1989,
1990), and engineering-geological and hydrogeologi- cal reports of 1935–1989 from the archives of the Spitsbergen Party of the Stock Venture Polar Marine Geosurvey Expedition in Barentsburg (Rossiiskie…, 1998).
RESULTS AND DISCUSSION Distribution, Thickness, and Temperature
of the Frozen Layer
The studied area is characterized by continuous distribution of permafrost. The thickness of rocks with temperatures below zero is about 100 m near the coastal zone (Obidin, 1958) and increases to 400–540 m on watersheds. According to data by M.N. Mirzaev et al.
(cited by (Rossiiskie…, 1998)), the maximal thickness of rocks with a negative temperature is recorded near the settlement of Kolsbey in well 31: 540 m at an alti- tude of the well mouth of 526 m above sea level. At the Barentsburg mine, the maximal thickness of deposits with negative temperature exceeds 310 m in well 248 (Obidin, 1958) with an altitude of the mouth of 221 m.
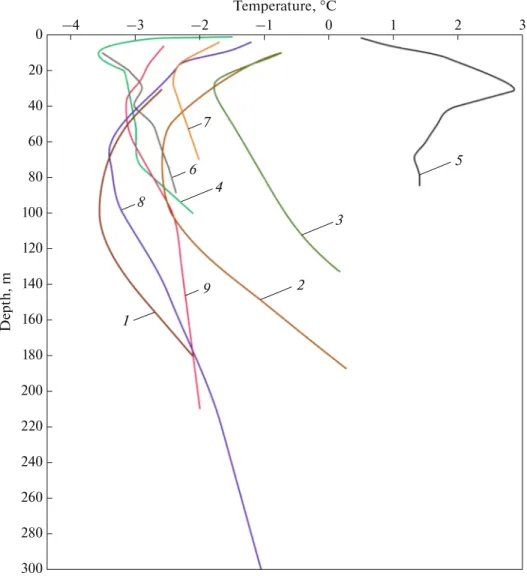
The thermometric curves of exploration wells obtained in the 1930s–1950s are given in Fig. 3. The temperature curves below the layer of seasonal tem- perature f luctuations tend to bend towards positive temperatures in most wells. This is probably related to the cycle of climate warming, which began prior to measurements and continues at the present time.
According to measurements in the Grumant paramet- ric well, the mean geothermal gradient is 2.9°C/100 m for Mesozoic and Cenozoic terrigenous rocks and 1.7°C/100 m for Permian siliceous-carbonate rocks.
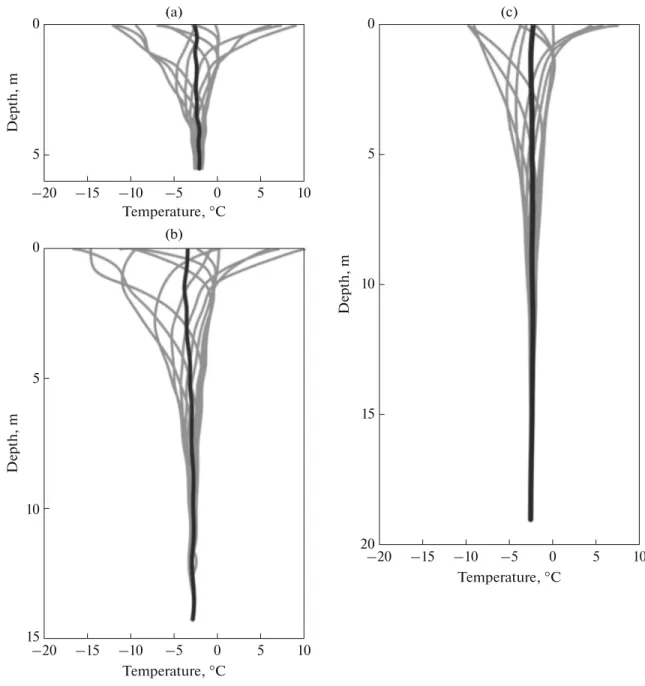
The minimal temperature of rocks under the layer of seasonal f luctuations in 1930–1950 was –3.6°C (Fig. 3). According to data by I.Yu. Misnik and K.N. Belousov (1983), this parameter varies from –3.2 to –2.4°C at a depth of 11–40 m in the region of Bar- entsburg, which in general corresponds to the modern data (Table 1, Fig. 4). The year-round temperature monitoring is now performed in eight RAE-S wells, three of which are included in the GTN-P system:
wells 2, 9, and 12 (codes in the GTN-P database are RU 202, RU 204, and RU 201, respectively). The thermometric wells enable the temperature monitor- ing of different kinds of deposits: of the accumulative sea terrace (well 2), rocky ground (well 12), long-term heaving mounds (wells 9, 13, and 15), and taliks under river beds (wells 17, 18, and 19).
The STL thickness is measured on the CALM monitoring site (code in the GTN-P database is Bar- entsburg CALM) at 121 points with a distance between them of 5 m at the end of the warm season after the first snowfall (in late September or in October). The CALM site is located at an altitude of about 75 m above sea level on a monadnock of the marine accu- mulative terrace 1.3 km southwest of the Barentsburg helicopter pad (Fig. 1). The deposits of the terrace are
characterized by thermometric well 2 allocated to the plot boundary. The terrace is composed of sandy-clay deposits with a massive cryogenic structure of 7 m thick (Demidov et al., 2016). An automatic weather complex is located near the site. The landscape of the site is formed by wood-rush–moss spotted tundra with the total projective cover of vegetation from 50 to 95%. It is characterized by the presence of frost scars covered by a thin algae-lichen crust. Some of the spots are located on the open, sometimes rocky, surface. According to measurements of 2019, the STL thickness on the site ranges from 114 to 154 cm with a mean of 133.5 cm. In 2017 and 2018, the mean STL thickness was 138 and 144.5 cm, respectively. In some areas of the studied part of the Nordenskiold Land, in places of the warming effect of seasonal water f lows in particular, the STL thickness may be significantly greater, exceeding 3–4 m.
Continuous frozen rocks are interrupted in areas of shelf, under-lake, glacial, and water-thermal taliks.
According to data by M.N. Mirzaev et al (cited by (Ros- siiskie…, 1998)), the absence of frozen rocks under waters of sea bays was recorded by drilling nine engi- neering–geological wells in the water area of the Coles Bay by the Giproarktika Research Institute in 1956.
The wells were drilled from the shoreline towards the water area at sea depths reaching 16 m to a distance of 317 m. The maximal depth of wells from the sea bot- tom surface was 32 m. The warming effect of the sea was also recorded by the temperature curve for well 7 of RAE-S drilled on Cape Finneset at a distance of 5 m from the edge of the 8-m-high sea terrace and at a dis- tance of 20 m from the sea (Demidov et al., 2016). The temperature at a depth of 12.5 m on September 12, 2016, was –0.87°C.
Fig. 3. Thermometric curves according to drilling data in the Soviet period. (1) Well 7, 1937; (2) well 13, 1937; (3) well 1, 1937;
(4) well 240, 1952; (5) well 51, Fara Lake, 1957; (6) mine 5, Barentsburg, 1941; (7) well 251 (according to report from 1957);
(8) well 248 (according to report of 1957); and (9) well 259 (according to report of 1957). Location of wells is given in Fig. 1.
3 2
1 0
–1 –2
–3 –4
Temperature, °C
5
3 4
9 2 1
6 7
8
Depth, m
300 280 260 240 220 200 180 160 140 120 100 80 60 40 20 0
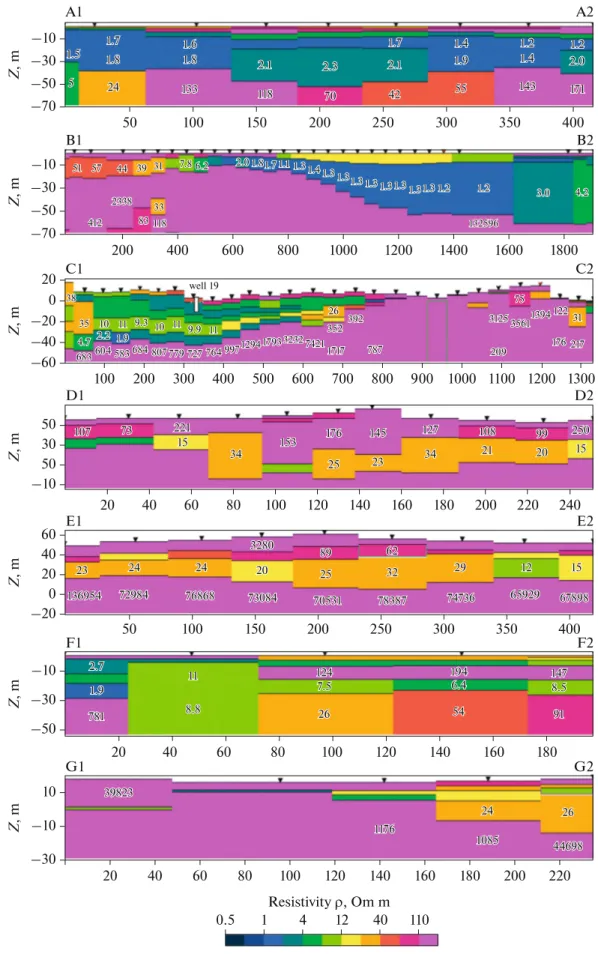
Extensive through taliks near the mouths of the Grønfjorden and Grendalen valleys stretch from the sea for several kilometers. They were discovered during electrical exploration by the EM method in 2019 (Figs. 1, 5). Low electrical resistivity (Om m) indicate that the rocks contain saline unfrozen water.
High-resistance layers, underlying the low-resistance ones at the bottom of the section, may correspond to the rock base or frozen rocks of the Quaternary age. In the geo-electric section in the Grønfjorden valley, the thickness of the top high-resistance layer of frozen rocks, which covers the talik, regularly increases from the first meters on the coast edge to 10 m at a distance of 350 m from the sea (Fig. 5, section A1–A2). The
first two measurements on this profile were made from the fast ice; the absence of high-resistance rocks in them testifies to the absence of a canopy of frozen rock extending into the sea. In the lower reaches of the Grendalen Valley, the top part of the geoelectric sec- tion to a depth of 3–7 m is represented by strongly resistant frozen rocks, which cover the talik (Fig. 5, sections B1–B2, C1–C2). The formation of this talik zone is a result of two processes: the infiltration of sea water in the valley mouth and the formation of cryopegs by pressing out of salts during the freezing of marine sediments. The relatively recent rise of the lower parts of the valleys above sea level, when there was sufficient time for freezing of sediments, may
Fig. 4. Mean monthly temperature envelopes according to observation wells 2 (a), 9 (b), and 12 (c) (RAE-S; September 25, 2018–
August 25, 2019). Location of wells is given in Fig. 1.
(a)
(b)
(c)
Temperature, °C
Depth, mDepth, m Depth, m
0
5
0
5
10
15
15 10 5 0
20
–20 –15 –10 –5 0 5 10
Temperature, °C
–20 –15 –10 –5 0 5 10
Temperature, °C
–20 –15 –10 –5 0 5 10
also be important. The geoelectric section in the Coles Valley is more complicated. There is a high- resistance layer between low-resistance ones at a depth of 8–13 m, which may be related to the pres- ence of icy rocks (Fig. 5, section F1–F2).
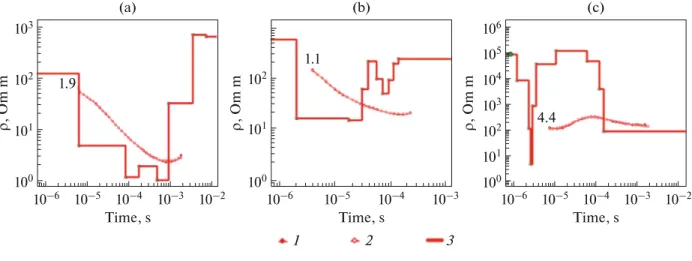
According to the EM data, the talik zone with the resistance of several units (Om m) under Grendal Lake may be traced at least to a depth of 31 m at a dis- tance of 2.3 km from the sea in the Grendalen Valley (Figs. 1, 6a). In deeper layers, the resistance increases, which may be related to frozen rocks or to the appear- ance of the underlying bedrock. According to data by
M.N. Mirzaev et al. (cited by (Rossiiskie…, 1998)), the presence of a through talik under Fara Lake in the mouth of the Coles Valley is proved by the thermo- metric analysis of the 85-m-deep well 51 (Fig. 3) drilled from ice in the center of the lake in 1957. Taliks between frozen layers, the roof of which is located at depths from 10 to 20 m, are also revealed in the Gren- dalen Valley under the Oin and Gloin pingo (Figs. 1, 6, sections D1–D2, E1–E2). There is also a thin talik at a depth of 15–16 m near the slope of the Grendalen Valley to the south of the Nori pingo (Figs. 1, 6c). In the Coles Valley, at a distance of 5 km from its mouth, Table 1. Characterization of wells and data of thermometric measurements on the Barentsburg Cryologic Test Plot
Well no.:
coordinates, mouth altitude above sea level
Geomorphologic position and generalized lithological section (rocks are frozen)
Depth/mean annual temperature by lower sensor
Depth/temperature by lower sensor, single
measurement well 2:
78.09504° N, 14.24096° E, 75.5 m
Accumulative sea terrace on the southern shore of Isfjorden:
0–7 m—sand and loam;
7.0–7.5 m—rock
5.5 m/–2.17°С
(September 24, 2018–Sep- tember 24, 2019)
well 7:
78.04703° N, 14.21962° E, 8.0 m
Sea terrace on Cape Finneset:
0–9 m—gravelly sand and sandy loam;
9–12.5 m loam;
(pebble is at the bottom)
12.5 m/–0.87°С (September 12, 2016)
well 8:
78.02068° N, 14.40860° E, 16.0 m
Swollen terrace (hydrolaccolith) on the right bank of the Gren River:
0–1. 5 m—gravel and pebble with loamy substrate;
1.5–25 m—loam and siltstone with ice layers reaching 1 m in thickness
14.5 m/–3.56°С (September 14, 2017)
well 9:
77.99355° N, 14.6621° E, 53.0 m
Crater on the summit of the heaving mound in the Grendalen Valley:
0–1.5 m—loam;
1.5–23.8 m—massive ice;
23.8–25 m—clay
14.25 m/–2.6°С
(September 22, 2018–Sep- tember 22, 2019)
well 12:
78.09075° N, 14.20244° E, 95.0 m
Accumulative terrace on the southern shore of the Isfjorden:
0–2 m—gravelly loam with inclusions of pebble;
2–19 m—fractured sandstone
19.0 m/–2.57°С
(September 22, 2018–Sep- tember 22, 2019)
well 13:
77.99483° N, 14.59009° E, 42.5 m
Top of the Nori heaving mound in the Grendalen Valley:
0–4. 4 m—gravel and pebbles with layers of sandy loam and loam;
4.4–20.5 m—ice;
20.5–22.0 m—gravel and pebbles with loamy material
21.8 m/–2.58°С (April 4, 2019)
well 15:
14.66742° N, 77.99398° E, 60.5 m
The top of the Kili heaving mound in the Gren- dalen Valley:
0–13.5 m—gravel and pebble with sand and clay material;
13.5–14.0 m—ice
14.25 m/–2.87°С (September 22, 2019)
Fig. 5. Geoelectric sections by data from EM sounding. Location of the sections is given in Fig. 1: (A1–A2) Grønfjorden Valley, (B1–B2 and C1–C2) Grendalen Valley, (D1–D2) Gloin pingo, (E1–E2) Oin pingo, and (F1–F2 and G1–G2) Coles Valley.
50 100 150 200 250 300 350
1800 1600
1400 1200
1000 800
600 400
200
1300
240
400
180
220 200 180 160 140 120 100 80 60 40 20
160 140
120 100
80 60
40 20
350 300
250 200
150 100
50
220 200 180 160 140 120 100 80 60 40 20
1200 1100 1000 900 800 700 600 500 400 300 200 100
400
Resistivity ρ, Om m
0.5 1 4 12 40 110
Z, mZ, mZ, mZ, mZ, mZ, mZ, m
–30 –10 –50 –30 –10 –20 0 20 40 60 –10 50 30 50 –60 –40 –20 –70 –50 –30 –10 –10 –30 –50 –70
0 20
10
A1 A2
B1 B2
C1 C2
D1 D2
E1 E2
F1 F2
G1 G2
1.7 1.7
1.7 1.61.61.6 1.8 1.8
1.8 2.12.12.1 2.32.32.3 2.12.12.1 1.91.91.9 1.4 1.4
1.4 1.21.21.2 1.21.21.2 1.4 1.4
1.4 2.02.02.0 171 171 143 171 143 55 143
55 42 55
42 70 42
70 118 70
118 133 118
133 24 133
24 24
51 51 51 575757
38 38 38
35 35 35
107 107
107 737373 221221221 15 15 15
34 34 34
153 153 153
25 25 25 176 176 176 145145145
23 23
23 343434 127 127
127 108108108 21 21
21 202020 99 99 99 250250250
15 15 15 4.7
4.7 4.7 2.22.22.2 1.91.91.9
9.3 9.3
9.3 101010 111111 9.99.99.9 111111 11
11 11 10 10 10
683 683
683604604604 583583583 684684684 807807807 779779779 727727727 764764764 997997997129412941294 179317931793 323232323232 742174217421 1717 1717 1717 352 352 352262626 392392392
787 787 787
75 75 75 3125 3125 3125
209 209 209
3561 3561 3561139413941394 122122122
176 176176 217217217
31 31 31 44
44 44
2338 2338 2338 333333
83 8383 118118118 412
412 412
39 39
39 313131 7.87.87.8 6.26.26.2 2.02.02.0 1.81.81.81.71.71.7 1.11.11.1 1.31.31.3 1.41.41.4 1.31.31.3 1.31.31.3 1.31.31.3 1.31.31.3 1.31.31.3 1.31.31.3 1.31.31.3 1.31.31.3 1.21.21.2 1.21.21.2
132596 132596 132596
3.0 3.0 3.0 4.24.24.2 5
5
1.7 1.7 1.7 1.8
1.8 1.5 1.8 1.5 1.5
well 19
15 15 15
147 147 147 8.5 8.5 6.4 8.5
6.4 6.4 194 194 124 194
124 124 7.5 7.5 7.5 26 26 8.8 26
8.8 8.8 1.9
1.9 1.9 2.7 2.7 2.7
781 781 781
39823 39823 39823
1176 1176 1176
24 24
24 262626 44698 44698 44698 1085
1085 1085 11
11 11
91 91 54 91
54 54
12 12 12 29
29 29 62
62 62 32 32 32 89
89 89 25 25 20 25
20 24 20
24 24 24
24 23 24
23 23 136954 136954
136954 729847298472984 768687686876868 730847308473084 705317053170531 783877838778387 747367473674736 659296592965929 678986789867898 3280
3280 3280
Fig. 6. EM sounding curves: (a) talik under the Grendal Lake in the Grendalen Valley, (b) talik under an blister on the Gren River 1.3 km from the sea, and (c) talik near the slope of the Grendalen Valley to the south of the Nori pingo. (1) Actual curve, (2) model curve, and (3) parameters of model layers.
10–6 10–2
10–3 10–4 10–5 10–6
(a) (b) (c)
4.4 1.1
1.9
ρ, Om m ρ, Om m ρ, Om m
1 2 3
103
102 102
106
100 101
10–6 10–3
10–4
10–5 10–5 10–4 10–3 10–2
102 103 104 105
101
100 101
100
Time, s Time, s Time, s
there is a talik about 10-m-thick under the riverbed (Figs. 1, 5, geoelectric section G1–G2). The existence of permanent spring and blisters with liquid water on the eastern and western coasts of Grønfjorden (Fig. 1) testifies to the formation of a number of water-thermal taliks there. The frozen layer is interrupted under some large glaciers, which is described in detail in the Underground Water section.
Cryogenic Structure of Deposits
The cryogenic structure of the Quaternary deposits may be described by the analysis of wells drilled as part of works of RAE-S in 2016–2020. The data on the cryogenic structure of hard rocks are now very frag- mentary. There are only notes in the reports (Rossi- iskie…, 1998) that rocky ground in mines and explora- tion wells in Barentsburg contained ice layers reaching several centimeters thick. Wells drilled since 2016 characterize the accumulative sea terraces on the southern coast of Isfjorden; the terrace of Cape Fin- neset; the Grendalen and Hollendar mountain valleys composed of marine, slope, and river deposits; and pingos in the Grendalen Valley. The maximal thick- ness of the Quaternary deposits is 21.5 m in well 8 on a terrace in the Grendalen Valley. According to the data of the EM, the total thickness of Quaternary deposits in the area of this well may reach about 50–60 m (Fig. 5, section B1–B2).
In most wells, the top part of the section is repre- sented by coarse-grained gravel, rotted rock, and peb- bles with or without loam and sandy loam material between them. The genesis of this geological series is related to destruction of bedrock (argillites and sand- stones) and their further processing under conditions of beach. Slope and f luvioglacial deposits in valleys are processed by rivers. This is proven by the rounded shape of the fragments. This part of the section is character-
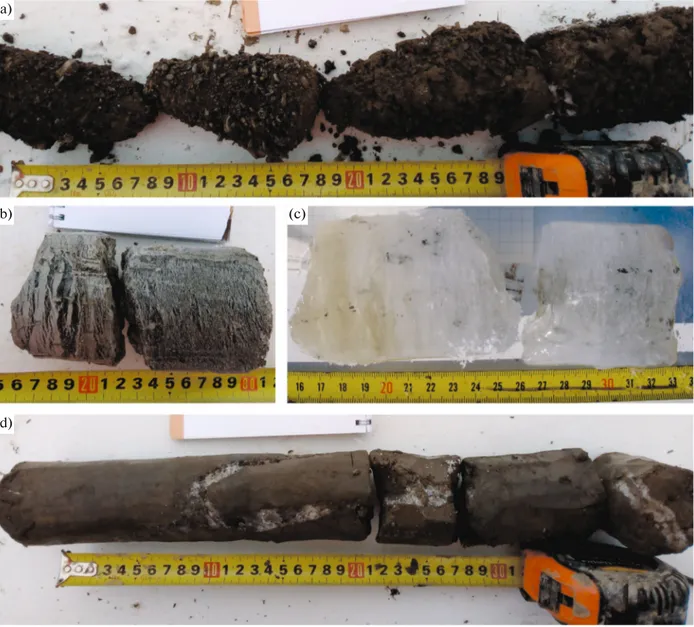
ized by a massive cryogenic structure, mainly of a pore type, and less often of film and contact type (Fig. 7a).
The mean water content of deposits is 25%. The total content of water-soluble salts is hundredths and thou- sandths of a percent of the mass of dry sample.
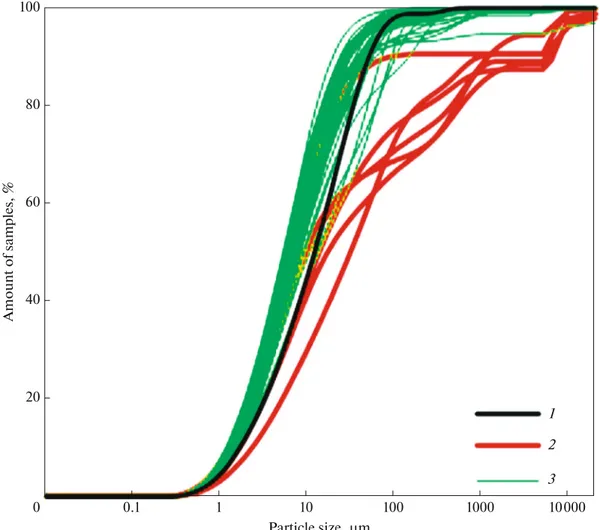
On the contrary, the bottom of wells composed of marine sediments is characterized by a loamy composi- tion (Fig. 8). These deposits are usually gray and some- times brown or black. The loam may contain rare rounded fragments or layers of gravel with rotted rock.
The cryogenic structure is schlieren (Fig. 7d). Subverti- cal and subhorizontal ice schliers several centimeters in width are located at a distance of several decimeters from each other. There are also ice inclusions and lenses. The mean water content of these deposits is 38%.
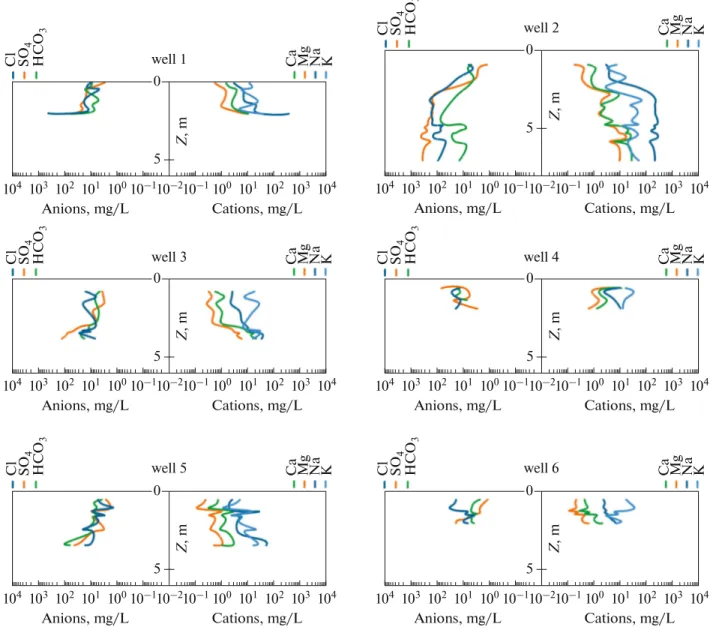
The total content of water-soluble salts in the coarse-grained series is hundredths and thousandths of a percent of the mass of dry sample. The taste of loamy deposits is often slightly saline: the content of water-soluble salts varies here from tenths to the first percent of the mass of dry sample. The cation compo- sition of the water extract from the both series is char- acterized by the domination of Na+ or K+ (Fig. 9). The domination of any one anion was not detected, except for well 8, where Cl– dominates the loam series.
According to the type of freezing, the loam series is epicryogenic, while freezing of the coarse-grained series may be both epicryogenic and syncryogenic.
Segregation and injection ice of various thicknesses is uncovered in a number of wells (it is discussed in the next section).
Cryogenic Geological Processes and Phenomena Cryogenic processes typical for mountain regions and lowlands are developed in the studied area. High plateau and mountain slopes undergo cryogenic
weathering, material transportation by stone streams, and frost sorting, resulting in the appearance of stone rings, stripes, and spots of frost scars. The solif luction transportation of material (Fig. 10a) is seen almost everywhere in the area: in piedmonts, on moraine complexes, on sea terraces, and in the bottoms of val- leys. Stone glaciers are formed at the foot of the talus slopes in the Coles Valley. Frost heaving, resulting in the formation of seasonal and perennial mounds (Fig. 10b), and frost cracking with the appearance of polygonal topography (Fig. 10c) are developed in some areas in valleys. A description of an ice wedge in the section of a terrace 15 km from the mouth of the Gren River is given in (Vtyurin, 1990). Its width at the top is 8 cm, and the vertical length is more than 2 m. The author supposes that this is a fossil epigenetic vein.
Classical polygonal forms are rare in the Grendalen and Hollendar valleys (only some long cracks are seen here), while the Coles Valley is characterized by well- developed polygonal relief, two types of which are dis- tinguished. The first complicated type, with sides of polygons 10–20 m in length, is formed in peaty areas of the f loodplain, probably by wedge ice. The second type is spread on the sea terrace composed of pebbly- gravel deposits and is represented by a rectangular pat- tern with a side of 5–10 m. Polygonal relief with sides of rectangles of 10–25 m in combination with karst forms is also described on boulder–pebble deposits on the western coast of Grønfjorden in the mouth of the Linne River on marine terraces (Akerman and Boardman, 1987; Sharin et al., 2012). According to (Matsuoka et al., 2004), these polygons are formed by ground wedges.
Fig. 7. Core samples of frozen sediments: (a) gravel of massive cryogenic structure from a depth of 2.8–3.2 m (well 15), (b) ice- oversaturated deposits from a depth of 3.4–3.6 m (well 16), (c) injection ice from a depth of 17.5–17.7 m (well 9), and (d) loam with a large subvertical ice schlier from a depth of 11.2–11.6 m (well 15).
(a)
(b) (c)
(d)
Fig. 8. Cumulative curves of the particle-size composition of deposits in well 8. Sampling depth, m: (1) 0.1–0.3, (2) 0.3–1.3, and (3) 1.5–20.35.
1 2 3 Particle size, μm
10000 1000
100 10
1 0.1
0
Amount of samples, %
100
80
60
40
20
Relatively warm permafrost, active tectonics, and glacial groundwater supply cause a wide range of pro- cesses related to groundwater discharge, which is not typical for high-latitude Arctic archipelagos (these processes are discussed in detail in the Groundwater section). Large hydrogeogenic icings formed in areas of groundwater discharge disappears in summer (Fig. 10d).
Icings are also formed in the margins of large mountain- valley glaciers Dalfonna, West Grønfjorden, East Grøn- fjorden, Aldegonda, Tavle, and Tunge. Ice mounds (blisters) appear on the surface of icings (Fig. 10e).
Ice mounds are also formed in riverbeds due to the freezing of taliks under the riverbed. Large long- term heaving mounds—pingos (hydrolaccoliths)—
are revealed in the areas, where valley parts that emerged as a result of the sea regression are frozen over the places of groundwater discharge along tectonic faults. A group of hydrolaccoliths allocated to the Grendalen fault and characterized by the maximal rel- ative height above the surrounding surface (15 m) is described in the Grendalen valley at a distance from 7 to 10 km from the mouth (Figs. 1, 11).
The results of hydrochemical and isotope analyses of core samples from well 9 (Demidov et al., 2019) show that the chemical composition of the ice core of the Fili pingo on the left bank of the Gren River is sim- ilar to that of the source of hydrocarbonate sodium water, emerging to the surface at the foot of the adja- cent Oin pingo on the right bank of the river. The ice core of the Fili pingo uncovered by the well is 20.7-m- thick and is underlain by frozen loam, which testifies to the talik freezing and to the end of the growth stage of the heaving mound. Ice thickness in well 13, which was drilled in the Nori pingo and is the closest to the sea, is 16 m (Demidov, V.E. and Demidov, N.E., 2019).
The ice core is underlain by frozen gravelly deposits.
Talik zones at depths of 20–40 m are detected under the Oin and Gloin pingos by the EM method (Fig. 5, sections D1–D2, E1–E2), which corresponds to the presence of the mentioned water source at the foot of the Oin mound. According to the geographic informa- tion resource of the Norwegian Polar Institute (https://toposvalbard.npolar.no/), a single small pingo is also revealed in the Hollendar Valley. However, the data from 12-m-deep well 20 drilled on its top in 2020
show that the ice core here is absent, which means that this outlier is not a heaving mound.
Under the warming climate, some of cryogenic processes are damped, while others become more intensive. Glaciers degrade over the research area. At the same time, the increasing STL thickness and more rains activate dynamic slope processes: landslides and mudslides (Figs. 10f, 10g), which are dangerous for the engineering infrastructure of settlements. The rise in the mean annual air temperatures and precipitation also cases the development of thermokarst processes on the surfaces, where moraines emerge from under glaciers, as well as in some places on the bottoms of the Grendalen and Hollendar valleys, where lenses of underground ice melt. An increase in the intensity of thermal erosion in the beds of permanent and tempo- rary water flows should be expected. Thermoabrasion
is, in general, slight due to the domination of rock cliffs along the sea coast; however, it is seen on the shores of Bretjorna Lake, which are composed of the terminal moraine with buried ice (Fig. 10h), and along the shoreline of capes Finneset and Kokeri, which are com- posed of loose sediments. Cryogenic processes and phe- nomena in the studied region are more comprehensively analyzed in (Demidov, V.E. and Demidov, N.E., 2019).
Groundwater
With respect to hydrogeological zoning, the stud- ied area is assigned to the zone of the West Spitsbergen adartesian basin (Fig. 12). According to the map of hydrogeological zoning of western Spitsbergen com- piled by Ya.V. Neizvestnov and V.I. Ivanov (Rossi- iskie…, 1998), only a narrow strip reaching 10 km in
Fig. 9. Ion composition of water extract from core samples of Quaternary deposits. Location of wells is given in Fig. 1.
0
5
0
5
Z, m Z, m
0
5
Z, m
0
5
Z, m
0
5
Z, m
0
5
Z, m
well 1
Cl SO4 HCO3 Ca KMg Na
well 2
Cl SO4 HCO3 Ca KMg Na
well 4
Cl SO4 HCO3 Ca KMg Na
well 3
Cl SO4 HCO3 Ca KMg Na
well 6
Cl SO4 HCO3 Ca KMg Na
well 5
Cl SO4 HCO3 Ca KMg Na
Anions, mg/L Cations, mg/L 104 103 102 101 10010–110–210–1100 101 102 103 104
Anions, mg/L Cations, mg/L 104 103 102 101 10010–110–210–1100 101 102 103 104
Anions, mg/L Cations, mg/L 104 103 102 101 10010–110–210–1100 101 102 103 104
Anions, mg/L Cations, mg/L 104 103 102 101 10010–110–210–1100 101 102 103 104 Anions, mg/L Cations, mg/L
104 103 102 101 10010–110–210–1100 101 102 103 104 Anions, mg/L Cations, mg/L 104 103 102 101 10010–110–210–1100 101 102 103 104