Analysis of more galaxies
C . HAPTER VI
The detailed analysis of NGC4254 has proven the overall feasibility of the approach. It
showedthatthegascontributioningalaxiescanbemodelledtoahighenoughprecisionto
enablethecomparison toreal measureddataand to drawvaluableconclusions. However,
theagreement betweenthesimulatedand themeasured gasvelocityeldwasonlypartly
satisfactoryona wiggle-to-wiggle basis. Further, theanalysisofa singlegalaxy couldnot
provide any insight, whether theresult is characteristic for luminous,non-barred spirals
asa whole. Theextension ofthe analysison a sampleof galaxies might promiseabetter
comprehensionof the relevant gas processes in spiralgalaxies, leading to a more reliable
and representative estimateof thedark matter content and distribution.
The analysis wasapplied to the rest of thegalaxies from thesample, forwhichsuÆcient
kinematicdatacouldbetaken and opticalphotometry wasavailable,hence thecolorcor-
rection could be performed. This applied to four more galaxies: NGC3810, NGC3893,
NGC5676 and NGC6643 as listed in Tables 4.1 and 4.2. NGC5364 was not included,
since only 5 slit positions could be taken, providing only a relatively poor guess of the
two-dimensionalvelocityeld.
Themodellingof thegravitationalpotentials followed theprocedure thatwas outlinedin
Chapter 4. Only where a diering, individual treatment was needed for single galaxies
modellingissues willbe described further inthis Chapter. Forall galaxies a largeset of
simulations was performed for a wide range of the spiral pattern speeds. Furthermore,
following the example of NGC4254, simulations were carried out for ve dierent mass
fractionsofthestellardisk,namelyf
d
=20%,45%, 60%,85%andamaximaldisk. Since
it became evident from the analysis of NGC4254 that the choice of thegas sound speed
aectstheconclusionsonlyatunphysicallyhighvaluesforc
s
,allfurthersimulationswere
performedassumingasoundspeedc
s
=10kms 1
. To account fortheuniquenessofeach
galaxy, this Chapter is divided into Sections describing the simulations and results for
each galaxyseparately.
6.1. NGC3810
NGC3810 isa relativelybrightScgalaxy locatedintheLeogroupof galaxies. It exhibits
afairlystrongtwo-armmorphology withan armto inter-armcontrast of0:45 0:75mag
in K 0
. At radii larger than 45 00
the two arm structure gradually fades into a more
fragmented orocculent structure(see Figure 6.1). The occulence of NGC3810 is even
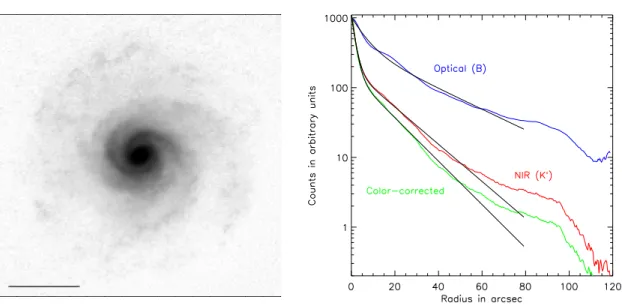
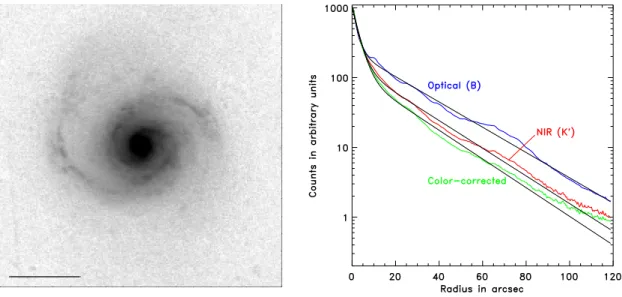
Figure6.1NGC3810. Atleftthedeprojected,color-corrected,HII-regioncleanedimageofNGC3810
isshown. Itwasusedasaninputtocalculatethegravitationalpotentialofthestellardiskcontribution
tothetotalgravitationalpotential. Thescalingbaris1 0
. Atright,theeectofthecolorcorrectionon
thediskscalelengthofNGC3810isshown. Notethedeviationoftheazimuthallyaveragedradiallight
prolesfrom asimpleexponential. Thetted part (blacklines) ofthecolorcorrectedprolesteepens
by14.7%,ascompared totheK-band.
moreapparentinthevisible,andisseenbestinthe'ColorAtlasofGalaxies'(Wray1988).
InastudyoftheNIRappearance ofocculentgalaxiesElmegreenetal.(1999)arguethat
the occulent optical appearance might be caused by higher than usual dust extinction
between thearmpieces. Indeed,dust might playa role, butmostprobablynotthemost
important, since 10 out of their sample of 14 galaxies kept their occulent appearance
also in the NIR. Elmegreen et al. (1999) further note that the arms of NGC3810 are
reasonably well matched by logarithmic spirals, however, they nda break in mid-disk,
whereemergingarmshavea higherpitchangle thanthemainarms, perhapsevidencefor
a spur (Elmegreen 1980). This occulent part of the disk has a rather constant surface
brightness of 21mag per square arcsecond. Beyond about 100 00
the surface brightness
drops steeplyuntilreachingtheexponentialdeclineof theinnerdisk atabouta radiusof
115 00
(seeFigure6.1). Adistanceof13.5MpcwasassumedtowardsNGC3810,takenasan
average literaturevalue. At thisdistance thegalaxy's a K-bandexponentialscalelength
of16:
00
3correspondsto1.07kpc;althoughtheproleisnotentirelyexponential. Thisisthe
shortestscalelengthofall5galaxiesinthesample. NGC3810 hasatotal bluemagnitude
of B
T
= 11:3mag and the bright part of the disk measures 3:42:4 arcminutes on the
sky. The major axispositionangle,PA =22:
Æ
0,and theinclinationof the disk, i=46:
Æ
0,
were determinedfrom themeasuredkinematics. The inclinationcorrected rotation curve
risesgentlyand attensat aradiusofabout40 00
to aconstant valueof 150kms 1
. There
is noevidence fora barat thecenter.
The color correction leaves the overall morphology of NGC3810 basically unchanged.
There seem no large arm-to-arm population dierences that cause the spiral structure
to change drastically. However, the color correction causes the radial prole to become
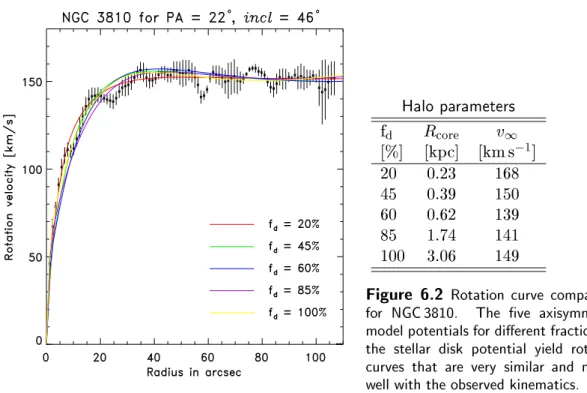
Halo parameters
f
d R
core v
1
[%] [kpc] [kms 1
]
20 0.23 168
45 0.39 150
60 0.62 139
85 1.74 141
100 3.06 149
Figure 6.2 Rotation curve comparison
for NGC3810. The ve axisymmetric
modelpotentialsfordierentfractionsof
the stellar disk potential yield rotation
curves that are very similar and match
wellwiththeobservedkinematics.
steeperby14.7%,thelargest changefromacolorcorrectioninanyofthesamplegalaxies
(see Figure6.1 andTable4.2).
Five modelsof thetotal gravitational potentialwere preparedforNGC3810, varying the
stellar disk massfraction f
d
. Figure 6.2 shows the rotation curves from theve axisym-
metric model potentials, as compared to the observed kinematics. All model rotation
curves can explain the galaxy's observed rotation curve similarly well. The Table ac-
companying Figure 6.2 lists the core radii and asymptotic rotation velocities of the ve
pseudo-isothermalhalomodelsusedto assemblethe nalgalaxy potentials.
6.1.1. Performing the hydrodynamical gas simulations
To modelthetwo-dimensionalgassurfacedensitiesandvelocityeldsforNGC3810 a set
of simulationswascarried out on a 201201 Cartesian grid. The grid cells were chosen
to give a resolution of 77.76pc per cell for the assumed distance towards the galaxy of
13.5Mpc. AsforNGC4254 thegasis taken to beisothermal throughoutthe simulation,
implyingthatthegascoolsinstantaneouslytoitsinitialtemperatureduringeachupdating
timestep. Followingtheinitializationofthegasincentrifugalbalanceinanaxisymmetric
potential,the nalnon-axisymmetricpotential isgraduallyturnedon andthesimulation
is completing the initialization phase by the time 40 sound crossing times of the code
havepassed. ForNGC3810,assumingagassoundspeedc
s
=10kms 1
,thatoccursafter
about436Myrs.
To nd the spiral pattern speed
p
, or equivalently the corotation radius R
CR
, the fol-
lowingcases weremodelled: R
CR
=3.15, 3.43,5.04, 6.14, 6.45, 7.00, 7.79,10.0kpcandno
patternrotation. Forthedierentstellardiskmassfractionsf
d
notalloftheabovelisted
corotation radii were simulated. Table 6.1 provides an overview of the runs which were
performedforNGC3810.
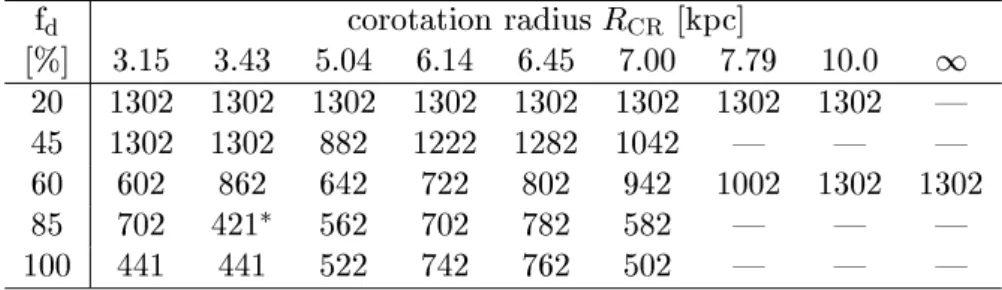
Table 6.1HydrodynamicsimulationsforNGC3810. Givenisthedurationofthe
individualsimulationinunitsof10 6
years.
f
d
corotationradiusR
CR [kpc]
[%] 3.15 3.43 5.04 6.14 6.45 7.00 7.79 10.0 1
20 1302 1302 1302 1302 1302 1302 1302 1302 |
45 1302 1302 882 1222 1282 1042 | | |
60 602 862 642 722 802 942 1002 1302 1302
85 702 421
562 702 782 582 | | |
100 441 441 522 742 762 502 | | |
Note: Thisrunterminatedbeforeendingtheinitializationphaseofthesimulation,
whichoccursat436Myrs.
6.1.2. Premature termination ofsimulations
As apparent from Table 6.1 some of the simulations, especially the ones for a fast pat-
tern rotation(smallR
CR
) andhigh diskmassfractions,terminated before thesimulation
reached the anticipated run time of 1302Myrs. For one run, the simulation terminated
even before the full non-axisymmetric galaxy potential was turned on. In such a case,
problems occur at certain grid cells during the simulation. Usually the gas density in
theparticular gridcellbecomesvery low,implyingconditionsthatare at thelimitofthe
code'srangeofapplication. FortreatingthegasowsindiskgalaxiesonaCartesiangrid,
highorderinterpolationshavetobeapplied. Inextremesituations,theycausethecode to
produceunphysicalnegativegasdensityvaluesforthenextupdatingtimestep. Repeated
occurrence of this problemeventually causes the simulation to stop. The occurrence of
these negative densities is aggravated by various processes. First, in the central regions
the gas densitycontrast can get very high,triggered by the non-axisymmetricnature of
thepotential. Second, theseconditions become more severe, ifthepotentialhas ahigher
degree of non-axisymmetry,i.e.forthe f
d
=85and 100%cases. Third,ifthe patternro-
tationishigh,shocks tendtobecome stronger sincethe gasisexposed tofasterpotential
changes. Finally,formassive galaxieswithhighrotationvelocitiesinthediskthevelocity
gradient in the inner parts of the disk is very large. Eventually, one of these processes,
oracombination ofthem,might producesuch extremelyrareedgasconditionsina grid
cell, terminatingthesimulation prematurely.
If the parameters for a simulation are close to the ones yielding the best representation
of the galaxy properties the 2
/N comparisonbetween thesimulatedgas kinematics and
the observations retains a very constant value, once the simulation proceeded past its
initialization phase. This is demonstrated in Figure 6.3. The 2
/N value uctuates at
maximum on a few-percent level. Thus, the evaluation of any simulation timestep past
theinitializationphasecanberegardedasbeingequivalent. Forthedataanalysis,amean
is calculated. The medianof the 2
exhibits averysimilarbehavior. However, ifthepa-
rameters for a simulation are far from representing a good description of the modelled
galaxy,thesimulationmightnotreachastationary solutionand the 2
/Nvalueincreases
withoutlimits. Often inthese cases thesimulationterminates prematurely. An example
is displayed inFigure 6.4.
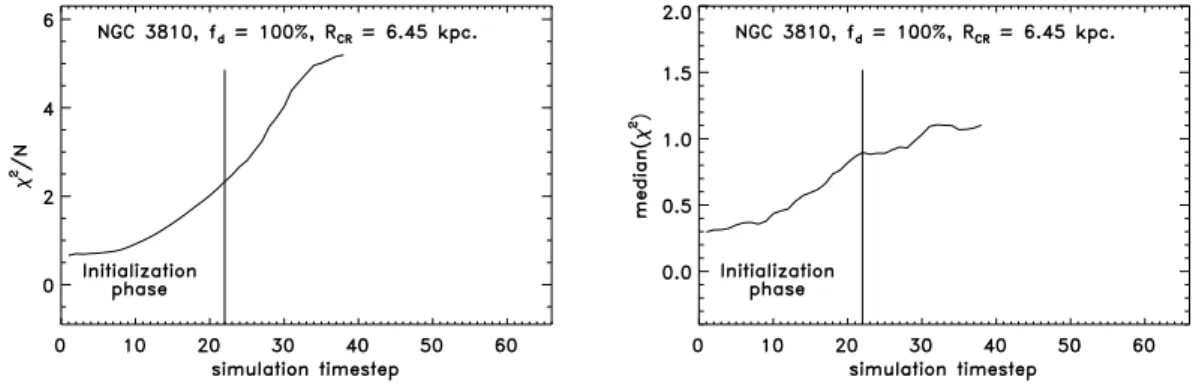
Figure 6.3 The overall 2
=N-value andthe median(
2
)of the model-to-observedkinematics com-
parison,plottedforasuccessfulsimulationofNGC3810. Thefullnon-axisymmetricpotentialisturned
onattimestep22.
2
=N isquitestableaftertheinitializationphaseaswellasthemedian(
2
).
Anysimulationthatterminatedbeforethefullnon-axisymmetricpotentialwasfullyturned
onwillgive 2
-valuesthat areslightlyo. In generalthesesimulationstendto givelower
2
s than what would be expected if the simulation had continued to the end. In the
furtheranalysis,some resultsofprematurelyterminatedsimulationsareincludedintothe
discussion,butthey arealways marked asbeinglessreliable.
Figure6.4Theoverall 2
=N-valueandthemedian(
2
)ofthemodel-to-observedkinematicscompar-
ison,plottedfor aterminated simulationof NGC3810. Thefull non-axisymmetric potentialis turned
on at timestep 22.
2
=N does notreach a stationary value after the simulation proceeded past its
initializationphase. Themedian(
2
)followsthesametrend,althoughlessvigorous. Notethedierent
scalesonthe 2
-axis.
6.1.3. Results fromthe hydrodynamicalgas simulations
6.1.3.1. The gas density
NGC3810 has a disk with a two-fold morphology. In fact, only the inner disk reveals a
fairlystrong spiralstructure. Intheouter diskno welldenedhighcontrast armscan be
found. In the simulation for thebest matching corotation radius (Figure 6.5), primarily
theinnerspiraldeterminesthedegreeofhowwellobservationsandsimulationsagree. The
simulated gasdensityexhibits a fairlyregular 3-arm morphology,that splits into several
piecesbeforeitalmostdissolvesat thecorotationradius. Thesimulationstracequitewell
theunderlyingspiralstructure,puttingthestrongestgas shocksto wherethespiralarms
arebestdenedand mostofthestar formingHII-regionsarelocated. Beyond corotation
the simulation develops long and continuous shocks that form in response of the weak
outer spiral pattern. These shocks come to lie close to where the arms are. Thus, the
overall agreement between thesimulatedgas densitymorphology and thegalaxy's spiral
patternis good.
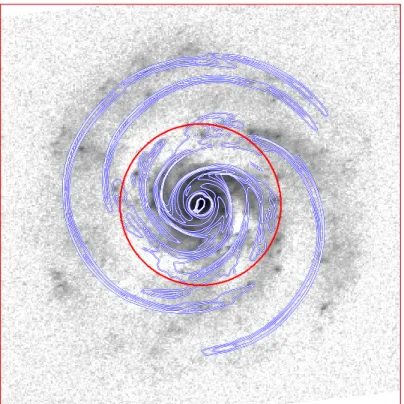
Figure6.5Simulationresultsofthegasdensitydistributionoverlaidincontoursontothedeprojected
K 0
-band image of NGC3810. From the image an axisymmetric radial brightness prole has been
subtractedtoenhancethecontrastofthespiralarms. TheFigureshowsthecontoursforthesimulation
with f
d
=60% and a corotationradius (red circle) of 3.15kpc. Thefull set of simulation results is
showninAppendixA.
NGC3810 appears to be a galaxywith afast patternrotation. The simulationsresulting
inagasdensitypatternthatresemblestheobserved spiralmorphologythemostwerethe
ones with the smallest corotation radius that could be performed for this galaxy. This
corotationradiusR
CR
=3:15kpc,measuringabout3exponentialdiskscalelengthsinK 0
,
correspondsto aspiralpatternrotationof
p
48kms 1
kpc 1
. Thisputsthecorotation
radius in the radial range that separates the inner disk with the stronger spiral and the
outer disk with the occulent morphology (see Figure 6.5). According to the discussion
from Section2.3, itis indeedfoundthat at thecorotationthenumberof starforming re-
gionsisreduced. Solely inthetheinnerarm emergingto thewest shows fewHII-regions
at thecorotationradius. Thisfactmightberegardedassome evidencethateventhough,
duetonumericallimitations,no fasterpatternspeedscould be probedthelocationofthe
corotationresonance is probablywelldetermined.
Certainly something is happening to the spiralpattern between the inner and the outer
disk that makes it lose strength. However, since the model-to-observations comparison
cannot be very detailedin theouter disk, there is no solution to the question ifa single
patternrotation speedisa good approximation forNGC3810.
6.1.3.2. The gas velocity eld
The observed gas velocity eld from NGC3810 is governed by a large amount of small
scale uctuations and jumps. There are almost no measurements that exhibit a longer
radial range of smooth, unshocked gas kinematics. Certainly, most of these small scale
wigglesare notinducedbygravity.
Figure 6.6 Example of the comparison of the simulation results to the observed kinematics of
NGC3810. The \maximal disk" and \minimal disk" velocity eld are shown for three position an-
gles. Presented are results from simulations assuming a fast pattern rotation
p
48kms 1
kpc 1
(R
CR
=3.15kpc). ThefullcomparisonisshowninAppendixA.
In Figure 6.6 the comparison of the simulations with the observed data is presented for
a sample of three positionangles of NGC3810, illustratingtheoverall t quality. Shown
are the simulated curves for the maximal disk case (f
d
=100% in green) and the one
for the setup using the most massive halo (f
d
=20% in red). An overview on all posi-
tion angles is provided in the Appendix A. Like for NGC4254, the global shape of the
rotation curve gets very well approximated by the models. This applies to all ve sim-
ulated disk-halo combinations, including the two shown extreme cases. On small scales
the situation is clearly less satisfying. Although a few wiggles overlap fairly well, most
of thestructurescannot bereproducedbythesimulatedgas velocityelds. Especiallyin
theouterpartsofthedisk,theagreementbetweensimulatedandobservedwigglesispoor.
As for NGC4254, the global least squares analysis loses much of its signicance in such
a case. By using the 2
-analysis theleast deviant modelvelocity eld can be identied.
This could in principle allowtwo conclusions: either the best matching case or the least
disagreeing simulation result. If the majority of the kinematic structures do not match
orcoincidewiththeobservations, thelatterof theabove willmostlikelybethepreferred
scenario from the 2
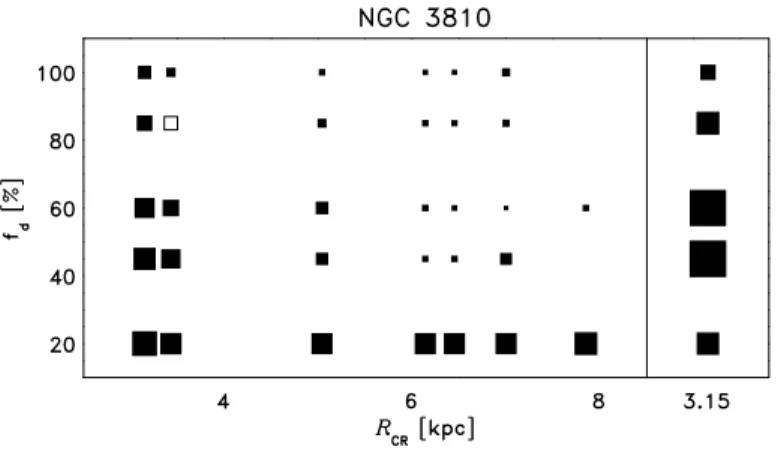
-analysis. The left partition of Figure 6.7 gives an overview on the
resultsfrom theglobal 2
-analysis. Largerboxes indicatea smaller 2
=N-value and thus
asmaller deviationfromtheobserved data. It mustbenoted, that{ like forNGC4254 {
Figure6.7Graphicalpresentationoftheglobal 2
-analysisofallthevelocitysimulationsforNGC3810
(leftpartition). Atright,the 2
-analysisofthereduceddatasetisshownforacorotationradiusR
CR
=
3.15kpc. Largeboxesindicatebetteragreementbetweenthesimulatedvelocityeldandtheobserved
kinematics. The open box representsthe simulation thatterminated beforepassing the initialization
phase. Theactual 2
-valuescanbefoundin AppendixA.
an additional systematic error of 9.5kms 1
has been addedto each observed data point
(see Section4.3.2).
Theglobal 2
-distributionacrosstheparameterspaceforNGC3810 appearsverysmooth.
While forlarge diskmassfractionsand large corotationradii theagreement betweenthe
simulationsand thedataisworst,italmostcontinuouslyturnsbetter forlighterdisksand
smaller corotation radii. The trend in corotation reects a real eect, since for the fast
patternrotation the morphologymatch of thegasdensityturnedoutbest. However, the
trendforthelighterdiskstoprovideabetter ttotheobservedrotationcurvesislikelyto
beasystematiceectfrom theglobal 2
-analysis. Asdiscussedabove,onsmallscalesthe
simulations failto reproducethe structureof the observed rotation curves in a suÆcient
way. In light ofthis, the modelsthat exhibittheleast non-axisymmetricstructures from
thetwo-dimensionalsimulationswillbethe onesthatdeviate theleastfromtheobserved
rotationcurves,towhichtheaxisymmetricgravitationalpotentialofthegalaxywastuned
to t.
However, followingthemethod explainedinSection4.3.2.1, it can be seenthat ifconsid-
ering only the parts of the observed velocity eld where the gas dynamics appear to be
dominatedbygravitationalforces, amediumdisksolutionispreferred(see theright par-
titionofFigure 6.7). Inthiscasethemodelwiththelighteststellardiskturnsoutto give
a less good agreement to the data as compared to the f
d
=45 and 60%models. During
therejection processof non-gravitationallyinducedwiggles,51%of thedata pointswere
discardedfromthecomparison(seeAppendixAfordetails). Thisimpliesthatabouthalf
ofthegasdynamicsmallscalestructurescouldnotberelatedto gravitationalinuenceof
thestellarspiral. Thus,NGC3810doescertainlynotqualifyasanexcellentlaboratoryfor
thisstudy. Nevertheless,the resultsarein favor ofa dynamicallyfairlyimportant stellar
disk, indicating that the mass comprised in stars roughly balances themass of the dark
halo insidetheoptical radiusof thedisk.
6.2. NGC3893
NGC3893 is agranddesignScgalaxy locatedintheUrsaMajorClusterof galaxies. The
galaxy is interactingwith theMagellanic dwarftypegalaxy NGC3896, locatedat apro-
jecteddistanceof3:
0
9tothesouth-east. RadiodatarevealaHI-bridgebetweenNGC3893
and NGC3896 (Verheijen & Sancisi 2001). The most striking optical evidence for the
interactionisaverycleartwo-armmorphologyatallradiiand theslightlydisturbedsym-
metry,seen in thenorth-eastern arm of NGC3893. The strong m =2 spiralhasan arm
to inter-arm contrast of 0:4 0:5mag in K 0
. The interacting arm shows a kink and a
change inthe pitchangle at a positionangleof 150 Æ
andanother one at a positionangle
of95 Æ
. Furthermoretheinteractingarmexhibitsaover-abundanceofHII-regionsrelative
to the rest of the galaxy, indicating enhanced star formation. Despite of its disturbed
morphology,the radial brightnessprole is fairlywelldescribed by a doubleexponential
model prole. Only beyond a radius of 100 00
the disk appears slightly brighter. The
galaxy'sK-bandexponentialdiskscalelengthof21:
00
9correspondsto 1.8kpc,ifadistance
of 17Mpc is assumed towards NGC3893, taken as an average literature value. See also
Figure6.8 foran illustrationof theradial K 0
prole.
Figure6.8NGC3893. Atleftthedeprojected,color-corrected,HII-regioncleanedimageofNGC3893
isshown. Itwasusedasaninputtocalculatethegravitationalpotentialofthestellardiskcontribution
tothetotalgravitationalpotential. Thescalingbaris1 0
. Atright, theeectofthecolorcorrectionon
thediskscalelengthofNGC3893isshown. Theazimuthallyaveragedradiallightproleisfairlywell
approximatedbya doubleexponentialdiskmodel(blacklines). Thecolorcorrectioncausestheprole
tosteepenbyonly3.5%,ascomparedtotheK-band.
NGC3893 has a total blue magnitude of B
T
= 11:2 mag and the disk measures about
4:32:5 arcminutes on the sky,although further outvery faint armscan stillbe traced
inlong exposures. Themajoraxis positionangle,PA =166:
Æ
0,and theinclinationof the
disk, i=42:
Æ
0,were determinedfrom themeasuredkinematics. Theinclinationcorrected
rotation curve rises gently and does not reach the at part of the rotation curve inside
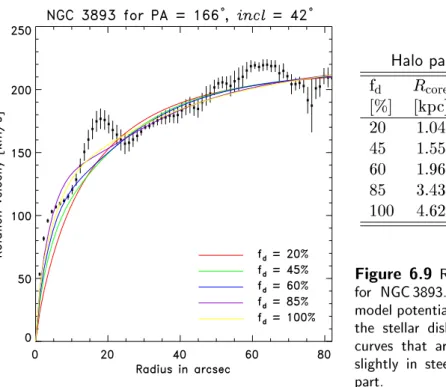
Halo parameters
f
d R
core v
1
[%] [kpc] [kms 1
]
20 1.04 228
45 1.55 230
60 1.96 233
85 3.43 262
100 4.62 287
Figure 6.9 Rotation curve comparison
for NGC3893. The ve axisymmetric
modelpotentialsfordierentfractionsof
the stellar disk potential yield rotation
curves that are very similar, but dier
slightly in steepness of the inner rising
part.
a radius of 85 00
. At this radius the rotation velocity reaches about 220kms 1
. From
HI-observations it is known that further out the rotation curve drops to 150kms 1
(Verheijen &Sancisi 2001), mostlikelyinuenced by the interaction. From the K-band
images,there isnoevidence forabarat thecenter. However, otherauthorsndevidence
fora weak barinoptical images(Eskridge etal. 2000).
The colorcorrectionhas nodrastic eect on the overall morphology ofNGC3893. While
the clear m = 2 spiralstructure remains very prominent, the largest eect of the of the
correction is seen inthe interactingarm. Therethe arm inter-arm contrastgets reduced
to 80%of itsK-bandvalue. This iscertainly theresultfrom ayounger stellarpopula-
tion occupyingthe north-eastern arm,where the interactionacted as a trigger to induce
recent starformation. ForNGC3893, thesteepeningof theradialproleduetothecolor
correction amounts to only 3.5% (see also Figure 6.8 and Table 4.2). This leads to the
conclusion that the induced star formation yielding younger, and therefore bluer, stellar
populations found in the interacting arm is a very local eect, i.e. local within the disk
and in time. If the interaction had taken place on large timescales the younger stellar
populationwouldhave spreadacrossthedisk, leadingto a overall blueouter disk.
Fivemodelsofthetotal gravitationalpotentialwerealsopreparedforNGC3893,varying
thestellardiskmassfraction f
d
. Figure6.9showstherotationcurvesfromtheve model
potentials,as comparedto theobserved kinematics. The Table accompanyingFigure 6.9
lists the core radii and asymptotic rotation velocities of the ve pseudo-isothermal halo
modelsusedto assemblethetotal galaxy potentials. Allof theaxisymmetricmodelrota-
tion curvescanapproximatethegalaxy'sobserved rotationcurve fairlywell. However, in
theinnerpartsthemodelswith ahigher stellardiskcontributionprovide abetter match
to theobservations. The'bump'at17 00
,whichiscausedbythestrongspiralarms,cannot
bereproducedbyaxisymmetricmodels. Toachievethis,2Dhydro-simulationsareneeded.
Table 6.2HydrodynamicsimulationsforNGC3893. Givenistheduration
oftheindividualsimulationinunitsof10 6
years.
f
d
corotationradiusR
CR [kpc]
[%] 3.18 5.47 6.46 7.06 7.55 8.56 9.84 1
20 281
1064 1064 1064 1064 1064 1064 1064
45 | 1064 1064 1064 1064 1064 1064 1064
60 281
1064 1064 1064 1064 1064 983 1064
85 281
1064 441
1064 1064 963 1064 1064
100 281
1064 1064 1064 1064 1064 1064 1064
Note: This run terminated before ending theinitialization phase of the
simulation,whichoccursat550Myrs.
6.2.1. Performing the hydrodynamical gas simulations
Formodellingthetwo-dimensionalgas surfacedensities and velocity eldsforNGC3893
again a Cartesian grid of 201201 grid cells was chosen. The adopted distance towards
NGC3893 of 17Mpc puts thegrid cellsizeto 97.9kpc. According to thiscell sizeand a
gas soundspeedc
s
=10kms 1
, thesound crossing time forone cellis about 13.8Myrs,
which puts theempirical time of 40 sound crossing times to initialize the nal potential
forthesimulation to 550Myrs.
To nd the spiral pattern speed
p
, the following corotation radii R
CR
were modelled:
R
CR
= 3:18, 5.47, 6.46, 7.06, 7.55, 8.56, 9.84kpc and no pattern rotation. Table 6.2
providesan overview oftheruns thatwereperformedforNGC3893.
6.2.2. Results fromthe hydrodynamicalgas simulations
6.2.2.1. The gas density
Thepuretwo-armmorphologyofNGC3893turnsoutto provideamore elementarybasis
forthesimulationsascomparedtoocculent,multi-armgalaxies. Inthesimulationforthe
bestmatchingcorotationradius(Figure6.10),thegasdensityrendersveryaccuratelythe
shapeoftheunderlyingspiralmorphology. Thestrongestgasshockscometoliewherethe
spiralarms are best dened and most of the star forming HII-regions are located. Even
beyond the corotation, which is indicatedby thered circle, theshocks are wellin place.
LikeforNGC3810,outsidecorotationthesimulationdevelopsalongandcontinuousshock
inresponseoftheoutskirtsoftheinteractingarm. Inthegalaxy'sinter-armregionsthere
arealso some weakershocks.
Given thegood agreement of thegas densitydistribution with the galaxy's morphology,
thepatternrotationofNGC3893 cangetdeterminedverywell. Thebestmatchingmodel
placesthecorotation at thevicinityof about3 exponentialK 0
diskscalelengths,R
CR
=
5:50:5kpc,correspondingto apatternspeed
p
38kms 1
kpc 1
. Ontheother hand,
a global pattern rotation speed might not hold forthe interacting part of the spiral. As
seenfromFigure 6.10,beyond thecorotationradius,theinteractingspiralarm broadenes
considerably. this indicates the disintegration of the density wave. Still, in the inner
part,wherethespiralexhibitsavery symmetricpattern, theapproximationwitha single
patternrotationspeedappearsto work verywell. Theanalysisof thekinematicdatawill
eventuallyconrmthisnotion.
Figure6.10Simulationresultsofthegasdensitydistributionoverlaidincontoursontothedeprojected
K 0
-band image of NGC3893. From the image an axisymmetric radial brightness prole has been
subtractedtoenhancethecontrastofthespiralarms. TheFigureshowsthecontoursforthesimulation
with f
d
=100% anda corotationradius(red circle) of5.47kpc. Thefull setof simulationresults is
showninAppendixB.
6.2.2.2. The gas velocity eld
DieringfromNGC3810 andNGC4254,intheobservedgasvelocityeldfromNGC3893
small scale wiggles and jumps are less prominent. As seen in Figure 3.2, the rotation
curvesalongmanyslitpositionsaresmoothandsteady,revealingbroadwiggleswherethe
slit was crossing a spiral arm. The interpretation of this nding would be that the gas
velocityeldofNGC3893 seemsindeedtobegovernedbylargescalegravitationaleects
ratherthanlocalgasbubblesandturbulences. Thesearefavorableconditionsforcarrying
outthehydrodynamicsimulations.
InFigure6.11thecomparisonofthesimulationswiththeobserveddataispresentedfora
sampleofthreepositionanglesofNGC3893,illustratingtheoveralltquality. Shownare
thesimulatedcurvesforthe maximaldiskcase (f
d
=100%ingreen) and theone forthe
setup usingthemost massive halo (f
d
=20%inred). An overview on all positionangles
is provided in the Appendix B. The match of the f
d
=100% simulation is striking! In
theinnerpartsthewigglesfoundinthesimulatedvelocityeldscoincidealmost perfectly
with the observations. This applies also to most of the slit position angles that are not
shown here, although in some cases the amplitude of the wiggles deviates slightly. This
nding complements very well the good match of the gas density morphology with the
underlyinggalaxy structure. At theouter partsof therotation curvesthe agreement be-
Figure 6.11 Example of the comparison of the simulation results to the observed kinematics of
NGC3893. The\maximaldisk"and\minimaldisk"velocityeldareshownforthreepositionangles.
Presented are results from simulations assuming a pattern rotation
p
38kms 1
kpc 1
(R
CR
=
5.47kpc). Clearlythemaximumdisk simulationprovidesanexcellentttotheobservations. Thefull
comparisonisshowninAppendixB.
Figure 6.12 Graphical presentation of the global 2
-analysis of all the velocity simulations for
NGC3893 (left partition). At right, the 2
-analysis of the reduced data set is shown for a corota-
tion radius R
CR
= 5.47kpc. Large boxes indicate better agreement between the simulated velocity
eldandtheobservedkinematics. Theopenboxesrepresentsimulationsthatterminatedbeforepassing
theinitializationphase. Theactual 2
-valuescanbefoundinAppendixB.
tweensimulationsandobservationsturnsintoagoodglobalt. Beyond45 00
thewiggles
intheobservedvelocityeldstendto exhibitalarger amplitudethanwhat can befound
inthesimulations. Corotation is at 65 00
.
Given theexcellentoverlapoffeatures, theconditionsaresuchthattheglobal 2
-analysis
mayyieldconclusionsaboutthemasscompositionwithinthegalaxy. Theleftpartitionof
Figure6.12providesanoverviewon theresultsfrom theglobal 2
-analysis. Largerboxes
indicatea smaller 2
=N-value and thusa smaller deviationfrom the observed data. The
bestmatchingsimulationresultslieinthefastpatternrotation andhighdiskmassrange.
Theopenboxesdenotesimulationsthatterminatedbeforepassingtheinitializationphase.
As discussedin Section 6.1.2, these runs tend to rendera better t than what the equi-
libriumstate would yield. Stillthese simulationsdemonstrate that in the vicinity of the
best ttingrun(R
CR
=5:5kpc ;f
d
=100%) theoverall t qualityis generally high. The
regionofgoodagreementforthemediumdiskmodelsislackingthedetailedtqualityon
awiggle-by-wigglebasis,thatis foundforthemaximaldisksimulationwhichisdisplayed
inFigure 6.11.
The analysis ofonlythe fractionof the velocityeld,for which mostlikelygravity isthe
dominant driving force of the gas (see Section 4.3.2.1 for a description of the method)
providesevenstrongersupporttothistrend. Seetheright partitionofFigure6.12. Even-
tually, the least squares comparison is not very sensitive to non-gravitationally induced
gas dynamicfeatures. The selection process rejected about40%of thedata points from
theobservations(see AppendixBfora Figure),withalmost no eect ontheconclusions.
Thus, theanalysis of NGC3893 yieldsa very robustresult and it can be concluded that
a maximumdiskis neededto explaintheobservationswell.
Eventually,a detailedlookat thedatarevealsthat thegood agreement betweenobserva-
tions and simulationsmainly relies on the innerpart of the disk. In the outer partsthe
simulationsfailtopredict thediskkinematicsasdetailed,pointing todynamicprocesses,
most likely correlated with the interaction, that cannot get treated with a single spiral
patternspeed.
6.3. NGC5676
NGC5676 is a Sc starburstgalaxy located in a smallgroup of galaxies with 11 reported
members(Garcia1993). Itrevealsafairlystrongtwoarmgranddesignmorphology. How-
ever,asitcanbeseenintheleftpanelofFigure6.13,thedeprojectedspiralpatternshows
frequent kinksmaking the inner spirals appearhexagonal. At a radius of about 30 00
the
spirals become smoother. While the eastern (left) arm continues for another 180 Æ
after
the last kink, the western arm (right) breaks up and fragments into a more occulent
morphology. From the K-bandimages, there isevidence fora weak barat the center. It
is displayed in the right panel of Figure 6.13. Its position angle is at about 38 Æ
and its
radiusis about12 00
,or1.9kpc.
Althoughsituated ina group,noevidence forongoing interactionhasbeenreported. On
the other hand, past interactions certainly occured and might have triggered the spiral
density wave and thestarburst. The radial brightness proleis very welldescribed bya
doubleexponentialmodelprole(seeFigure4.1a). Thegalaxy'sK-bandexponentialdisk
scale length of 22:
00
4 corresponds to 3.6kpc, if a distance of 33Mpc is assumed towards
NGC5676, taken as an average literature value. NGC5676 has a total blue magnitude
of B
T
= 11:9 mag and the disk measures about 3.91.9 arcminutes on the sky at the
22K-mag persquare arcsecond isophote. The major axispositionangle, PA=45:
Æ
8,and
thediskinclination, i=64:
Æ
0,weredetermined fromthemeasuredkinematics.
The inclination corrected rotation curve rises very steeply at the center and reaches the
atpart of therotation curve at a radiusof 25 00
(see Figure 6.14). Therotation velocity
levels at about 240kms 1
, which is the highest rotation velocity of all galaxies from the
sample withmeasuredkinematics.
Figure 6.13 NGC5676. At left the deprojected, color-corrected, HII-region cleaned image of
NGC5676 is shown. It was used as an input to calculate the gravitational potential of the stellar
disk contribution to the total gravitationalpotential. At right, the central region of NGC5676 (K-
band) is shown. Using the unsharp masking technique, a weak central bar can be identied. The
horizontalbaratthebottomofbothimagesmeasures1 0
.
Halo parameters
f
d R
core v
1
[%] [kpc] [kms 1
]
20 0.82 240
45 2.09 240
60 3.30 240
85 8.87 280
100 12.0 280
Figure 6.14 Rotation curve compari-
son for NGC5676. The ve axisymmet-
ricmodelpotentialsfordierentfractions
of the stellar disk potential yield rota-
tion curves that t fairly well with the
observed rotation curve. However, the
steep central risefrom 10 00
to30 00
is ap-
proximatedbestbyeitherthemaximalor
minimaldiskmodel.
Thecolorcorrectionclearlyenhancesthem=2spiralstructureofNGC5676. Someofthe
features inthe diskappearveryblue andhence getlargelyreducedinthecolorcorrected
image (for example the inter-arm feature seen in the upper left corner of the K-band
image, displayed in the right panel of Figure 6.13). However, NGC5676 might have a
considerableamount of dustin the disk, that obscures especially at optical wavelengths.
Since theopticalimagehas onlya moderate resolutionof 2:
00
3(FWHM) itis veryhard to
tellfromtheimage, ifaregionislessbrightbecause ofdustorbecause lessstarformation
activity. Highamountsofdustcan inprinciplecause thecolorcorrectionto failat places
where the dust is opticallythick. On the other hand, the color correction works wellin
thepresence ofdustaslongasnotall thelightgets absorbed. Moreover, ingalaxieswith
violentstarformationgoingon{likeNGC5676{thepopulationdierencesarelargeand
thecolorcorrectionisexpectedtohave astrongereect onthetwodimensionalmassdis-
tribution. However, theIMFofstarburst galaxiesisdistinclydierent fromtheuniversal
IMF that was usedto derivethe M/L to colorrelation. Thisfact leadsto theconclusion
thateven thecolorcorrected K-band imagestilldoesnotprovidea highlyaccuratemass
mapof thegalaxy. In lightof this,even ifthemassmapwillnotbe perfect, applyingthe
colorcorrection stillyieldsa better massmap thanjust theK-band imageand thatit is
worthwhiledoingit. Thecolorcorrectioncausesthearmsto appearmorecontinuousand
better dened. The radial K-band light prole steepens by 12.9% as a result from the
colorcorrection, stillremainingexponential.
NGC5676's inclination on the sky (64 Æ
) is rather high and the deprojected image has
beenconvolved witha transposeddistortion function, as shown inFigure 4.3. Addition-
ally,even thoughthecenterreveals theweak bar,thevery centerwasreplacedbya truly
axisymmetricmodeloftheinnerpart. Thiswasdonetoavoidproblemsattheverycenter,
when runningthehydrosimulations. Due tothe highrotation velocityand thesteep cen-
Table 6.3HydrodynamicsimulationsforNGC5676. Givenisthedurationoftheindividualsimulation
inunitsof10 6
years. ThedynamicaltimescaleforNGC5676is383Myrs.
f
d
corotationradiusR
CR [kpc]
[%] 5.6 6.6 7.65 8.6 9.6 10.6 11.6 12.6 13.6 14.16 1
20 | | 902 902 902 902 902 902 902 | |
45 571 1052 1292 1292 1292 1292 1292 691 781 812 1292
60 | | 602
y
452 y
572 y
| 873 993 873 843 1714
85 | | 511
571 541 511
511
511
541 | |
100 | | 541 511
511
511
541 451
451
511
|
Notes:
Thisrunterminatedbeforeendingtheinitializationphaseofthesimulation,whichoccursat
529Myrs.
y
Thef
d
=60%simulationswereperformedon agridwithalargercellsize,leadingtolongerinitial-
izationphases(704Myrs).
tral velocity gradient, NGC5676 is very susceptible to creating these extremely rareed
gasconditionsinthe simulationsthatweredescribedinSection 6.1.2.
AlsoforNGC5676 ve modelsofthetotal gravitationalpotentialwereprepared,varying
thestellardiskmassfractionf
d
. Figure6.14showstherotationcurvesfromthevemodel
potentials,ascomparedtotheobserved kinematics. TheTableaccompanyingFigure 6.14
lists the core radii and asymptotic rotation velocities of the ve pseudo-isothermal halo
models used to assemble the total galaxy potentials. The model rotation curves match
fairlywellwiththeobserved rotation curve,however notaswellasitcan beachieved for
othergalaxies inthesample. A reasonforthisis thesteep riseinthecenter andtherigh
rotationvelocity. Forthe\medium-disk"modelstheisothermal spherewith acore isnot
exibleenoughto account forthe steep rise, lackingmassive contributionfrom thesmall
bulgeandtheinnerdisk. Asitwillbeseenlater,thetwodimensionalgassimulationsyield
velocity eldsthat reproducethe observed rotation curves better thanthe axisymmetric
modelrotation curves.
6.3.1. Performing the hydrodynamical gas simulations
Thetwo-dimensionalgasmodellingforNGC5676wasperformedona301301Cartesian
grid. Thelargergrid sizewasmotivatedbythefacttheNGC5676 islocatedatadistance
of 33Mpc,thusrelativelyfaraway. Thegrid wasscaledto yield asimilarcellsizeinreal
dimensionswithin thegalaxy. In thissetup thelength of one grid cell measures95.1pc.
According to thiscellsizeand a gassoundspeedc
s
=10kms 1
,thesound crossingtime
forone cell is about 13.2Myrs, whichputs the empiricaltimeof 40 sound crossingtimes
to initialize the nal potentialfor the simulation to 530Myrs. Only for the earliest runs
(f
d
= 60%), the grid cell size was larger (127pc), putting theinitialization time for the
codeto704Myrs. Thelaterincreaseingridresolutionwasmotivatedbythegainofhigher
accuracy aswellasreducingthe simulationtimefurthe runs.
To ndthe spiralpatternspeed
p
modelswith thefollowing corotationradii R
CR were
simulated: R
CR
=5:6, 6.6, 7.65, 8.6, 9.6, 10.6, 11.6, 12.6, 13.6, 14.16kpc and no pattern
rotation. Table 6.3provides an overview of the runs thatwere performed for NGC5676.
As seen from Table 6.3, the premature termination of simulations is a serious issue for
NGC5676. For heavy disk simulations, all the runs terminated close to the end of the
initializationphase. Themainreasonfor thisto happen,isthe very steep velocitygradi-
ent of 400kms 1
within a radial scale of 40 00
at the center. Furthermore the small
bar introduces additional non-axisymmetric structures, that cause strong shocks in the
simulatedgasow. Asa preventivestrategy,thecenterof themassmap, whichwasused
as the inputto calculate the stellar disk contribution of the gravitational potential, was
replacedbyatrulyaxisymmetricmodelinordertominimizethenon-axisymmetriccentral
structuresinthenalpotential. Eventhough,forheavydisks,therunsencounterextreme
shocksatthecenterthateventuallyproducenegativegasdensitiesatcertaingridcells. In
asecondattempt,simulationsweredoneusingahighergassoundspeedofc
s
=15kms 1
,
intendingthegasto respondlessto non-axisymmetricfeatures inthepotential. Alsothis
modicationcould not extendtherun timeof thesimulation considerably. Theseresults
are notdiscussed.
Yet,thesimulationsituationforNGC5676isveryunsatisfactory. Asseeninthefollowing
section, preliminary conclusions can be drawn, buta thoroughly successful modelling of
thegalaxystillneedstobeachieved. At thepresentstatusofthesimulationprocess there
isstilla varietyofhitherto unexploredoptionsthatoer goodchances forsuccess. Sofar
itseemsthattheverybrightemissionofthemanystrongstarformingregionsinthearms
of this starburst galaxy has not been corrected well enough by the standard treatment
that wasdescribedin Chapter4.
6.3.2. Preliminary results from the hydrodynamicgas simulations
6.3.2.1. The gas density
ThespiralstructureofNGC5676 isfairlyregular,butstillthearmsdeviatefrom smooth
logarithmic radialproles. Apparentlythisbehavior is challenging forthesimulations to
match. Figure 6.15 shows the gas density distributions resulting from two simulations
which yield the best matching morphology. The gas density contours are overlaid onto
the deprojected K-band image, treated by the unsharp masking technique to enhance
the contrast of the underlying spiral structure. While the simulation with the slower
pattern speed (
p
21kms 1
kpc 1
orR
CR
= 11:6kpc, right panel of Figure 6.15)
reproduces very well the inner spiral structure, the one with the faster pattern speed
(
p
25kms 1
kpc 1
orR
CR
= 9:6kpc, left panel of Figure 6.15) yields a better t to
the outer spiral. In both simulations the modelled gas shocks follow rather closely the
spiralstructureofthearmemergingfromthenorthtopofthebarforabout270 Æ
. Further
out, othershocks, comingfrom theinnerorouter inter-armregionthentake theplace of
the primary shock. The replaced shock quicklyloses its strength and fades away. Thus,
thesimulatedgasshocks cometo lieinthevicinityofnearlyallarmpartsandfragments.
The fact thatsimulationsfordierent patternspeedstend to reproducethe spiralstruc-
ture better at dierent radii can be regarded as evidence that the pattern speed is not
constantfortheentiredisk. Additionally,ifthevelocityeldisconsidered,itcanbefound
thatthereisaseveremismatchatthecentralarcsecondstoo,whichindicatesthatalsothe
dynamic processes at thebar cannot be modelledsuccessfully along with therest of the
disk. Inlightofthis, describingthediskdynamicsofNGC5676 byasinglepatternspeed
Figure6.15Simulationresultsofthegasdensitydistributionoverlaidincontoursontothedeprojected
K 0
-band image of NGC5676. From the galaxy image a unsharp mask was subtracted to enhance
the contrast of the spiral arms. The Figures show the contours for the simulation with f
d
= 85%
and corotation radii (red circles) of 9.6 and 11.6kpc. The full set of simulation results is shown in
AppendixD.
mightnotbeappropriate. However, therangeof bestttingpatternspeedsisstillrather
narrow(R
CR
9 12kpc). Furthermore,asitwillbeseenfromthevelocitycomparison,
the simulations with R
CR
= 11:6kpc render very wellthe observed gas dynamics across
mostofthe disk.
Thus, a good matching corotation model places the resonance at the vicinity of about
3 exponential K 0
disk scale lengths, R
CR
= 11 +1
2
kpc, corresponding to a pattern speed
p
22kms 1
kpc 1
. Inthiscasethecorotationresonanceislocatedinthedirectvicinity
to wherethestellar spiralends. Beyond corotationthere isno regular spiralstructure.
6.3.2.2. The gas velocity eld
Theobserved gasvelocityeldofNGC5676isgovernedbyaverysteepriseatthecenter,
levellingat240kms 1
alongthemajoraxispositionangleatabout45 Æ
(seeFigure6.16).
In general, the gas velocity eld reveals a considerable amount of small scale structure.
Scaling with the overall high rotation velocity there are many observed abrupt velocity
jumpsin therange of 30 { 50 kms 1
. The observed data comprise only 7 slit positions,
missingone measurement at the0 Æ
positionangle.
In Figure 6.16the comparison of thesimulationswith theobserved data ispresentedfor
a sample of three positionangles of NGC5676, illustratingtheoverall t quality. Shown
are the simulated curves for the near maximal disk case (f
d
=85% in green) and the
one for the setup using the most massive halo (f
d
=20% in red). The match of the
f
d
=85% simulation is very good along the displayed postion angles. Even some of the
smallscalewiggles are reproducedvery accurately. As it isappearent from the overview
on all positionangles inAppendix D, formost position anglesthe comparison turnsout
Figure 6.16 Example of the comparison of the simulation results to the observed kinematics of
NGC5676. Velocityeld areshownfor threeposition angles. Presented areresults fromsimulations
withf
d
=20and85%,assuming apatternrotation
p
21kms 1
kpc 1
(R
CR
=11.6kpc). There
areseverediscrepanciesinthecentralparts. Thefullcomparisonisshownin AppendixD.
very good. Onlyin theinner20 00
thesimulatedvelocity eldsexhibitexceedinglyhigh
velocity jumps, that eventuallygrow to such magnitudes that the simulation terminates
prematurely. Theseextremeshocks areassociatedwiththe steep velocitygradient inthe
central velocity eld of NGC5676 and the presence of a small bar in the same region.
This central bar could further possess a pattern speed, diering from that of the disk,
introducing even more dynamic challenges for the simulations. In light of this, it must
be pointedout thatthe f
d
=85% results, which aredisplayed in Figure6.16, are indeed
from a runthat didnot reach thenal,stationary simulationphase. The runcrashedat
thetimestepwherethenalrealistic, non-axisymmetricgravitationalpotentialwasbeing
turnedon. The f
d
=20%simulation proceeded formore thana galactic dynamical time
scalebeyond thispoint. In fact, asseen fromthe resultsfrom thefull 2
-analysisthat is
presented inFigure 6.17, noneof theheavy disksimulationsproceeded signicantlypast
theinitializationphase.
Nonetheless, there is reasonto argue that the f
d
=85% scenario is characteristic to the
galaxy,andnotjustanumericaleect. First,thewiggle-to-wiggleagreement betweenthe
simulationsand observationsis undoubtedlybetter fortheheavy disk model. Second,as
seen from Figure 6.18, the evolution of the t quality during the initialization phase of
the simulation proceeds towards even better agreement (smaller 2
) untilthe runtermi-
nated. Itseemssafeto extrapolate thatmedian(
2
) liesintheclosevicinityofthelastt
even beyond simulationtimestep18, afterwhichthestationary simulationconditionsare
accomplished. The better t qualityof thef
d
=20%modelsascompared to the45 and
60%modelsisa result from thesmoother and more axisymmetricmodelrotation curve.
The basic axisymmetricdisk model was tuned to match the overall rotation curve. This
eect has beendiscussedforNGC3810.
As a conclusion of this discussion, it seems fair to state that the simulations provide
evidence for a heavy disk scenario in NGC5676, even though the simulations did not
yet provide an entirely satisfactory degree of completeness. A disk mass fraction f
d
85% indicates that about 2/3 of the total mass inside 2.2 K-band disk scale lengths is
contributedfrom thestellardisk. The coreradiusof thepseudo-isothermalhaloisinthat
caseintherangeofseveraldiskscalelengths. Inthisscenario,thehalobeginsonlybeyond
theextent of thebright stellardiskto dominate thedynamics ofthegalaxy.
Figure 6.17 Graphical presentationof the preliminary, global 2
-analysisof all the velocity simula-
tions for NGC5676. Large boxes indicatebetter agreement between the simulatedvelocity eld and
the observed kinematics. The open boxes represent simulations that terminated before passing the
initialization phase. Grey boxes representsimulations thatterminated immediately afterreaching the
stationarysimulationphase. PrematureterminationsareaseriousissueforNGC5676.
Figure 6.18 Evolution of the t quality of the f
d
= 85%, R
CR
= 11.6kpc simulation during its
initializationphaseasmeasuredfromthemedian(
2
)fromthecomparison. Thesimulationterminated
duringthecalculationoftimestep18. Thesimulationevolvestowardsabettertqualityandmightbe
safelyextrapolatedintothestationarysimulationphase.
6.4. NGC6643
NGC6643 is probably the least suited galaxy for this experiment that is in the sample.
AlthoughitisclassiedasSc,thegalaxyreveals averyocculent morphologywithmany
starformingregionsandknottyarms. IntheNIR,thespiralstructureismorepronounced,
however, thearmsappearstillknotty and thearm to inter-armcontrast isveryvariable:
0.2 { 0.6K 0
-mag. The regular two-arm spiral that direcly emerges from the tiny bulge
breaks up into several arm piecesat a radius ofabout20 00
. Thesearms continue to wind
outward for 180 Æ
with changing pitch angles. At the radius where the spiral breaks
its symmetry, there is a massive over-abundance of star forming HII-regions. This over-
abundance is also distincly notable in the radial brightness proles, shown in the right
panel of Figure 6.19. At the radial range from about 15 to 25 00
the brightness in B
increases whileinK 0
itstays constant. The colorcorrected radial prolealmost entirely
corrects this discontinuity and produces a very smooth exponential prole. This can be
consideredasastrongargument infavorofthecolorcorrectionmethod. Especially,since
for NGC6643 it is not obvious that the color correction should work accurately. Like
NGC3810, also NGC6643 wasstudied byElmegreenetal. (1999) lookingforunderlying
NIR symmetric structures in optically occulent galaxies. These authors argued that
dust mightplaya major role inexplainingthe occulent optical appearance. AlsoEvans
(1993) ndshighdustextinction inthecentralregionof NGC6643. Asdiscussedalready
for thecase of NGC5676, strong dustextinction might corruptthe outcome of thecolor
correction. However, considering the above, the color correction seems to yield a much
better massmapthan theK-bandimagewouldbe.
Figure 6.19 NGC6643. At left the deprojected, color-corrected, HII-region cleaned image of
NGC6643 is shown. It was used as an input to calculate the gravitational potential of the stellar
disk contribution tothe total gravitationalpotential. Thebar is 1 0
. At right, the eect ofthe color
correctiononthediskscalelengthofNGC6643isshown. NotethedeviationoftheopticalandK-band
azimuthally averagedlightprolesfromasimple exponential. Themodelt(blacklines) ofthecolor
correctedprolesteepensby8.6%,ascomparedtotheK-band.
Halo parameters
f
d R
core v
1
[%] [kpc] [kms 1
]
20 0.80 183.5
45 1.46 180
60 2.34 180
85 4.90 180
100 11.5 242
Figure 6.20 Rotation curve compari-
son for NGC6643. The veaxisymmet-
ricmodelpotentialsfordierentfractions
ofthestellardisk potentialyieldrotation
curves that are very similar and match
wellwiththeobservedkinematics.
A distance of 23Mpc was assumed towards NGC6643, taken as an average literature
value. At thisdistance thegalaxy's K-band exponentialscale lengthof24:
00
4corresponds
to2.72kpc. NGC6643hasatotalbluemagnitudeofB
T
=11:8magandthediskmeasures
about 3:62:1 arcminutes on the sky at the 22 K-mag persquare arcsecond isophote.
Themajoraxispositionangle,PA =40:
Æ
0, andthe inclinationof thedisk, i=57:
Æ
8,were
determinedfrom the measuredkinematics. The inclinationcorrected rotation curverises
aboutlinearlyoutto aradiusof about20 00
,wherethereisa sharpbreakandtherotation
curve levelsto a constant valueof 185kms 1
.
Five modelsof thetotal gravitational potentialwere preparedforNGC6643, varying the
stellar disk mass fraction f
d
. Figure 6.20 shows the rotation curves from the ve model
potentials,ascomparedtotheobservedkinematics. Allmodelrotationcurvescanexplain
the galaxy's observed rotation curve similarly well. Again, small scale features in the
rotation curve like the \bump" at 20 00
cannot be matched by a simple axisymmetric
model. TheTable accompanyingFigure 6.20 liststhecore radii and asymptoticrotation
velocities of the ve pseudo-isothermal halo models used to assemble the total galaxy
potentials.
6.4.1. Performing the hydrodynamical gas simulations
Thetwo-dimensionalgasmodellingforNGC6643wasperformedona257257Cartesian
grid. The grid size was chosen to yield a cell size in real dimensions within the galaxy
that is similar to the others from the sample. In this setup the length of one grid cell
measures 88.3pc. According to this cell size and a gas sound speed c
s
=10kms 1
, the
sound crossing time forone cell is about 12.2Myrs, which puts the empirical time of 40
soundcrossingtimes to initializethenal potentialforthesimulationto 488Myrs.
Table 6.4 Hydrodynamic simulations for NGC6643. Givenis the
durationof theindividual simulationin units of10 6
years. Thefull
potentialis turnedonat488Myrs.
f
d
corotationradiusR
CR [kpc]
[%] 4.18 5.1 6.0 6.5 7.00 8.0 9.0 10.0
20 782 842 842 842 842 842 842 842
45 842 842 842 842 842 842 842 842
60 692 842 842 | 842 842 842 842
85 842 842 842 842 782 511 842 842
100 661 782 601 812 | 842 842 842
Tondthespiralpatternspeed
p
,orequivalentlythecorotationradiusR
CR
,thefollow-
ing cases were modelled: R
CR
= 4:18, 5.1, 6.0, 6.5, 7.0, 8.0, 9.0 and 10.0kpc. Table 6.4
provides an overview of the runs, performed for NGC6643. All runs carried on well be-
yond theinitializationphase, sothat premature simulation terminations areno issuefor
NGC6643.
6.4.2. Results from the hydrodynamicalgas simulations
6.4.2.1. The gas density
As mentioned before, the morphologic appearance of NGC6643 does not qualify it as
the perfect laboratory forthe anticipated analysis. It does not exhibita cleargrand de-
sign spiral structure that helped to yield the good results for NGC3893, but rather a
patchyandocculentmorphology. Figure6.21shows thegasdensitydistributionthatre-
sulted from two simulationswith dierentcorotation radii,which reproducethe galaxy's
spiral structure comparably well. The gas density contours are overlaid onto the depro-
jected,unsharpmaskedK-bandimage,representingtheunderlyingspiralstructure. Since
NGC6643'sarmsdonotwindwithaconstantpitchangle,thesimulationsencounterdiÆ-
cultiesto reproduceallspiralfeatures. Whileforthemodelwiththefasterpatternspeed
(R
CR
= 6:5kpc) the most prominent eastern (left) arm cannot be traced by one single
gas shock, it still exhibits gas shocks in the vicinity of all major star forming regions.
Thescenario withtheslowerpatternspeed(R
CR
=8:0kpc)resultsinafairlywelloverall
matching morphology, only the arms in the gas simulation seem to wind too long, ul-
timately deviating from the observed morphology. Eventually, the spiral structure that
developsinbothgassimulationsmatcheswellwiththegalaxy'struespiralpattern. How-
ever, theresults fromthekinematiccomparison favorthefasterpatternspeedmodel.
Fromthemodelling,thelocationofthecorotationresonancecanbeplacedclosetotheend
ofthestrongerspiralpattern. Thisisinthevicinityofabout2.4exponentialK 0
diskscale
lengths,R
CR
=6:5 +1:5
0:5
kpc,correspondingtoapatternspeed
p
28:5kms 1
kpc 1
. Due
to themoderate morphologicalmatch,theprecision,withwhichthecorotationcan bede-
terminediscomparablylow. However, theresultsfromsimulationsoutsidethecorotation
range ofR
CR
=6 8kpc yieldto even lesssatisfyingcomparisons(see AppendixE).
Figure6.21Simulationresultsofthegasdensitydistributionoverlaidincontoursontothedeprojected
K 0
-band image of NGC6643. From the galaxy image a unsharp mask was subtracted to enhance
the contrast of the spiral arms. The Figures show the contours for the simulation with f
d
= 45%
and corotationradii (red circles) of 6.5 and 8.0kpc. These two simulations reproduce the galaxy's
morphologycomparablywell. ThefullsetofsimulationresultsisshowninAppendixE.
6.4.2.2. The gas velocity eld
The observed gas velocityeld of NGC6643 doesnotreveal an exceedinglyhigh amount
of small scalenoise (see Figure 6.22 for three positionangles). In the central region the
rise of the rotation curve is not particularly steep. As for NGC5676, the observed data
compriseonly7 slitpositions,missing one measurementat the 0 Æ
positionangle.
InFigure6.22thecomparisonofthesimulationswiththeobserveddataispresentedfora
sampleofthreepositionanglesofNGC6643,illustratingtheoverallt quality. Shownare
thesimulatedcurvesforanearmaximaldiskcase(f
d
=85%ingreen) andtheone forthe
setup using the most massive halo (f
d
=20% in red). Considering the rather moderate
match of the gas density eld withthe spiralstructure, thecorrespondance of the simu-
latedvelocityeldofthelightdiskmodelwiththedataisrespectablygood. Particularly,
the global overlap of the curves is striking. From all observed 14 slit positions,given in
AppendixE,itcanbeseen thatthecomparisonturnsoutverygoodforthecompleteve-
locityeld. The simulationsfailhowever, to reproducea substantialnumberof thesingle
wiggles pointingtowards non-gravitationally inducedgasdynamics. Thiswillcomplicate
the conclusion process, which disk mass fraction setup eventually explains the observed
gasdynamicsbest.
The left partition of Figure 6.23 shows the results from the full 2
-analysisof the runs.
AsforNGC3810,theresult fromtheglobal 2
-analysisyieldsa verysmoothdistribution
acrossthestudiedparameterspace. Accordinglyitmustbeconcludedthattheamountof
non-gravitationallyinducedgasdynamicwigglesisratherhighandprobablyasabundant
asthegravitationally inducedones.
Figure 6.22 Example of the comparison of the simulation results to the observed kinematics of
NGC6643. Velocityeld areshownfor threeposition angles. Presented areresults fromsimulations
withf
d
=20and85%,assumingapattern rotation
p
28.5kms 1
kpc 1
(R
CR
=6.5kpc). Both
simulationsyieldacomparablygoodmatch. Thefull comparisonisshownin AppendixE.
Figure 6.23 Graphical presentation of the global 2
-analysis of all the velocity simulations for
NGC5676 (left partition). At right, the 2
-analysis of the reduced data set is shown for a coro-
tation radius R
CR
= 6.5kpc. Large boxes indicate better 2
=N agreement between the simulated
velocityeldandtheobservedkinematics.
The analysis ofonlythe fractionof the velocityeld,for which mostlikelygravity isthe
dominant driving force of the gas (see Section 4.3.2.1 for a description of the method)
allowsslightlymore reliableconclusions. AsforNGC3810,slightlymore than50%ofthe
observed data points have been rejected from the comparison. From the results of the
2
=N comparisonon thereduceddataset, displayedintheright partitionofFigure6.23,
it can be seen that low and mediumdisk models provide a comparably good agreement
between observations and simulations. This rather vague result comes not unexpected,
considering the weak spiraldensitywave in NGC6643. If the stellarmass is onlypoorly
concentrated within the spiralarms, the gravitational inuence of the arms excerts also
weak forcingonthegas. Reproducingthese subtleeectswiththesimulationsisdiÆcult.
In light of this, the conclusion that a heavy disk scenario is unlikely for NGC6643 can
already beregarded asarespectablesuccess.