Geographical, seasonal, and depth variation in sinking particle speeds in the North Atlantic
M. Villa-Alfageme1, F. C. de Soto2, E. Ceballos1, S. L. C. Giering3, F. A. C. Le Moigne4, S. Henson3, J. L. Mas5, and R. J. Sanders3
1Departamento de Física Aplicada II, ETSIE, Universidad de Sevilla, Seville, Spain,2Departamento de Sistemas Físicos, Químicos y Naturales, Universidad Pablo de Olavide, Seville, Spain,3Department of Ocean Biogeochemistry and Ecosystems, National Oceanography Centre, Southampton, UK,4GEOMAR, Helmholtz Centre for Ocean Research Kiel, Kiel, Germany,5Departamento de Física Aplicada I, Universidad de Sevilla, Seville, Spain
Abstract
Particle sinking velocity is considered to be a controlling factor for carbon transport to the deep sea and thus carbon sequestration in the oceans. The velocities of the material exported to depth are considered to be high in high-latitude productive systems and low in oligotrophic distributions. We use a recently developed method based on the measurement of the radioactive pair210Po-210Pb to calculate particle sinking velocities in the temperate and oligotrophic North Atlantic during different bloom stages. Our estimates of average sinking velocities (ASVs) show that slowly sinking particles (<100 m d1) contribute significantly to carbonflux at all the locations except in the temperate regions during the bloom. ASVs appear to vary strongly with season, which we propose is caused by changes in the epipelagic community structure.Our results are thefirstfield data to confirm the long-standing theory that particle sinking velocities increase with depth, with increases of up to 90% between 50 and 150 m depth.
1. Introduction
The biological carbon pump (BCP) of the ocean plays a fundamental role in the global carbon cycle. About 510 Gt C yr1 are transported from the surface ocean as biogenic particles to depth [Falkowski et al., 1998]. The coupling of oceanic production and carbon export removes carbon dioxide from the atmosphere and transfers it to the dark ocean. This way, the BCP reduces atmospheric carbon dioxide levels to almost half of what it would be without it [Henson et al., 2011;Sarmiento and Toggweiler, 1984].
The magnitude of the BCP as a remover of atmospheric carbon dioxide is strongly dependent on the depth to which particles sink. Each year, 105 Pg C arefixed into phytoplankton biomass [Field et al., 1998] and most of it is recycled in the upperfirst hundred meters of the ocean [Bishop et al., 1978;Marsay et al., 2015;Martin et al., 1987;Suess, 1980]. Only those particles transported to below the winter mixed layer (~1000 m) will sequester carbon for long time scales. Between ~5% and 25% [Martin et al., 1987;Schlitzer, 2000] of the net primary pro- duction (PP) is exported from the euphotic zone (this ratio of export to PP is termed“export efficiency” (ExpEff)), yet only 1–3% arrive to the deep sea [Lampitt et al., 2010]. Moreover, there are significant temporal and regional differences inExpEff[Henson et al., 2012, 2015].
One of the key parameters that influence temporal and geographical variations of theExpEffand to which depth particles sink (i.e., sequestration potential) is the velocity at which particles sink [Berelson, 2002]. This is because slow sinking speeds allow time for microbes and zooplankton to remineralize particles at shallower depth, reducing the likelihood for particles to penetrate deep into the ocean. Reported values of particle sinking velocities suggest that they sink predominantly at velocities>100 m d1(e.g., 150–200 m d1in coastal regions [Turner, 2002] and 200– 2400 m d1in the Mediterranean Sea [Armstrong et al., 2009;Lee et al., 2009]). Recent studies, however, indicate that slow-sinking particles (<10 m d1) contribute significantly to particleflux in the Canary Current [Alonso-Gonzalez et al., 2010] and in the temperate North Atlantic (NA) [Riley et al., 2012]. Average sinking velocities (ASVs) of 25– 150 m d1 have been reported for the Southern Ocean [McDonnell and Buesseler, 2010]. Villa-Alfageme et al.
[2014] analyzed the contribution of slow-sinking particles to downward particleflux at different depths in the tem- perate NA during the postbloom season and reported AVS of 60 and 90 m d1at 50 and 500 m, respectively.
The speed at which particles sink through the mesopelagic is thought to increase with depth [Trull et al., 2008]. This increase in sinking speeds is reflected in the mathematical function commonly used to describe particleflux attenuation, the“Martin curve”[Martin et al., 1987]. Yet very few studies have measured sinking
Geophysical Research Letters
RESEARCH LETTER
10.1002/2016GL069233
Key Points:
•Slow-sinking particles (<100 m d1) contribution to particle sinkingflux is ubiquitous across the North Atlantic
•Strong variations in sinking velocity are found to be mostly seasonal, and the community structure appears to drive sinking velocities
•In both temperate and oligotrophic regions we confirm the long-standing hypothesis that sinking velocity increases with depth (30-90%)
Supporting Information:
•Supporting Information S1
Correspondence to:
M. Villa-Alfageme, mvilla@us.es
Citation:
Villa-Alfageme, M., F. C. de Soto, E. Ceballos, S. L. C. Giering, F. A. C. Le Moigne, S. Henson, J. L. Mas, and R. J. Sanders (2016), Geographical, seasonal, and depth variation in sinking particle speeds in the North Atlantic, Geophys. Res. Lett.,43, 8609–8616, doi:10.1002/2016GL069233.
Received 18 APR 2016 Accepted 3 AUG 2016
Accepted article online 8 AUG 2016 Published online 24 AUG 2016
©2016. American Geophysical Union.
All Rights Reserved.
speed of particles in situ using, e.g., the Marine Snow Catcher [Riley et al., 2012], imaging of particles in viscous polyacry- lamide gels [McDonnell and Buesseler, 2010], or Indented Rotating Sphere sediment traps [Alonso-Gonzalez et al., 2010]. A novel method uses the
210Po-210Pb disequilibrium in the water column, coupled with inverse modeling techniques and a one-box model, as proxy to provide estimates of particle ASVs throughout the upper mesopela- gic (euphotic zone depth to ~500 m depth) [Villa-Alfageme et al., 2014].
We expand the limited data set byVilla- Alfageme et al. [2014] and, using the
210Po-210Pb method, present ASV esti- mates from both oligotrophic and eutrophic regions in the NA during dif- ferent stages of the bloom. We discuss the contribution of fast- and slow-sinking particles to carbon export and the variability in ASV distributions with depth, region, and season.
2. Methods
2.1. Study Sites
We analyzed210Po-210Pb measurements from seven cruises (PAP site: D341, JC070; Irminger and Iceland Basins: D350 and D354; and Bermuda Atlantic Time-series Study (BATS) site: #217, #219, and #221). These cruises covered a wide range of environment from the temperate to the oligotrophic North Atlantic (NA) (Figure 1). The specific stations sampled during the cruises, their locations, and sampling dates are given in Table S1 in the supporting information.
Cruise D341 took place in July and August 2009 at the Porcupine Abyssal Plain (PAP) site (48 N, 16.5 W) and is described byLe Moigne et al. [2013] andVilla-Alfageme et al. [2014]. Cruise D354 was undertaken in July– August 2010 in the Irminger Basin (IrB) and Iceland Basin (IB) in the high-latitude NA [Le Moigne et al., 2014]. Cruise JC071 took place within 30 km of the PAP site, between 29 April and 12 May 2012 and covered the start of the phytoplankton spring bloom.
2.2.210Po-Derived Particulate Organic Carbon Fluxes and Average Sinking Velocity Calculations We combined particulate and dissolved210Po activities into a one-box model and calculated ASVs following the methods byVilla-Alfageme et al. [2014]. This model assumes steady state; i.e., both activities and210Po fluxes are assumed to be constant for time scales shorter than 138 days (the half-life of210Po). According to their half-lives, parent210Pb and daughter210Po are expected to display equal total activities; however, the downwardflux of210Po breaks the equilibrium.210PofluxðP210PoÞis proportional to210Pb-210Po disequili- brium and is traditionally calculated as
dP210Poð Þz;t
dz ¼λ210Po atotal210
Pbatotal210
Po
; (1)
whereλPois the decay constant of210Po (0.0072 d1) andatotalPb andatotalPo are the total (seawater plus particles) specific activities of210Pb and210Po, respectively [Le Moigne et al., 2013]. Alternatively,210Poflux can also be written in terms of sinking velocity as
P210Po¼aparticle210
Po v zð Þ (2)
whereaparticlePo is the210Po specific activity measured in particles andv(z) is sinking velocity. If the specific activities of total210Pb and210Po in both seawater (including particles) and particles are known, we can Figure 1.Position and bathymetry map of the sampling areas in the
North Atlantic (PAP site, Irminger Basin, Iceland Basin, and BATS) show- ing the stations sampled for Po-Pb.
combine equations (1) and (2) and solve for sinking velocityv(z). A least squaresfitting procedure allows the calculation of sinking velocity by minimizing the difference between predicted and observed values, follow- ing the inverse modeling approach developed byVilla-Alfageme et al. [2014].
Note that the calculated velocity is based on the210Pb-210Po deficit caused by the particle sinkingflux, imply- ing that the calculated ASV corresponds to the average velocity of all particle sinkingflux. Alternatively, other methods such us the Marine Snow Catcher, viscous polyacrylamide gels, or Indented Rotating Sphere sediment traps provide sinking velocities only for specific particle sizes or particle velocity classes. Hence, this must be considered when comparing our AVS to other data.
Our inverse model [Villa-Alfageme et al., 2014] assumes that steady state may introduce a systematic bias in systems where nonsteady state conditions prevail. In order to assess the validity of the approach and estimate any systematic errors, we performed a sensitivity test by including a constant variation in activity with time (Non Steady State (NSS) term) in the inverse model algorithm. We assume, for instance, a varia- tion in the activity with time of 10% every 15 days, with the variation being either positive (NSS+; i.e., activ- ities increased over time) or negative (NSS; i.e., activities decreased over time) for every depth. This is a worst-case scenario. For the NSS sensitivity analysis we selected two adjacent stations in the Iceland Basin that were sampled 27 days apart (Figure S3). The modified best fit parameters indicate that ASVs would be changed between 10% and 20% from Steady State (SS) to NSS, which is within the experimental uncertainties of the model. Therefore, assuming steady state in a nonsteady state situation does not affect our results significantly over the associated uncertainties.
2.3.210Po and210Pb Measurement
We analyzed total210Po and210Pb in the temperate NA (PAP, IrB, and IB) following the GEOTRACES protocol [GEOTRACES Standards and Intercalibration Committee, 2010]. Alpha counting was performed at Centro de Investigación, Tecnología e Innovación, Universidad de Sevilla, using a Passivated Implanted Planar Silicon- type alpha detector (Canberra). Uncertainties were estimated by error propagation. Background and210Po and210Pb decay corrections were carried out (details of the corrections, spikes, and calculation of the radio- chemical yields are given inLe Moigne et al. [2013] andVilla-Alfageme et al. [2014]).
Particulate matter was sampled using an in situ Stand-Alone Pumping System. 1500–2000 L of seawater was filtered onto 53μm and 1μm Nitex screens. Particles were washed off using MiliQ water and the solution split for subsequent210Po and210Pb analysis. The analysis was performed following the same protocol as for water analysis [Le Moigne et al., 2013].
For the oligotrophic NA (BATS), measurement methodology and sampling strategy for210Po and210Pb activ- ities in particles and water are described byStewart et al. [2010]. A thorough description of the biogeochem- ical conditions during the cruises is provided byBrew et al. [2009].
2.4. Satellite Data
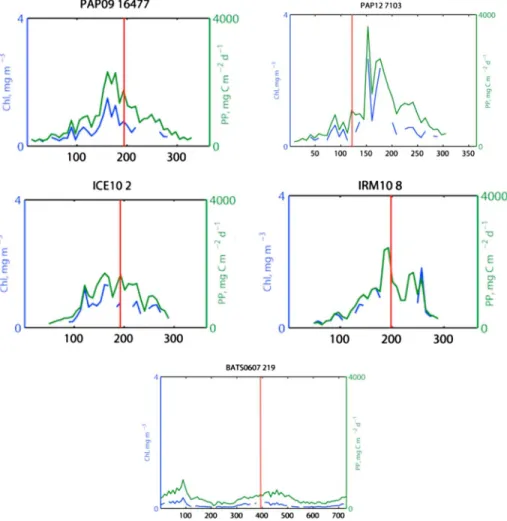
Chla concentrations were obtained from the NASA Moderate Resolution Imaging Spectroradiometer (MODIS) satellite at 9 km spatial and 8 day temporal resolution (http://oceancolor.gsfc.nasa.gov/). A time series of Chl a for all stations was created by averaging pixels within a 25 km radius of the sampling location. Chl a concentration was converted to PP using the Vertically Generalized Production Model algorithm [Behrenfeld and Falkowski, 1997]. Satellite time series of Chla concentra- tion and PP were used to differentiate the bloom stages (Figures 2 and S1). We defined the bloom start as the day on which the Chl a value was higher than 5% of the annual median [Henson et al., 2006;Siegel et al., 2002].
Ourfield campaigns sampled the main seasonal bloom in the temperate regions during two stages: (1) bloom conditions at PAP during May 2012 and (2) the decline of the bloom at PAP during July 2009 and at IrB and IB during July 2010. The oligotrophic BATS site was sampled three times [Brew et al., 2009;Stewart et al., 2010] representing three different bloom stages: (1) in November 2006 well before the spring bloom, (2) in January 2007 at the start of the spring bloom (i.e., Chlaconcentration exceeded 5% but before the high- est Chlapeak was reached), and (3) during the winter-spring bloom in March 2007.
3. Results and Discussion
3.1. Slow-Sinking Particle Contribution
We analyzed a total of 30 depth profiles between 50 and 600 m depth. ASVs ranged from 20 ± 4 to 590 ± 80 m d1and increased with depth at all sites (Figure 3). The values displayed correspond to the average value of the sinking velocities calculated for all the stations associated with a particular cruise and one site/basin. The ASV depth profiles, including all the depths, are detailed in Figure S2 and Table S2. There appear to be clear temporal and depth trends. We divided ASVs into three groups according to region and season: postbloom in the temperate NA (PAP site in July (PAPJuly), IrB and IB), bloom in the temperate NA (PAP site in May, PAPMay), and bloom in the oligotrophic NA (BATS). We further define fast particles as those sinking at over 100 m d1and slow particles as those that sink slower than 100 m d1. Although deciding what can be considered slow or fast based on current data is somewhat arbitrary, this choice is consistent with previous reports:Riley et al. [2012] found that particulate organic carbon (POC)fluxes at the PAP site could be characterized by two pools with sinking velocities of<10 m d1and>350 m d1, andMcDonnell and Buesseler[2010] considered fast particles as those sinking at over 150 m d1.
ASVs in the postbloom temperate NA increased with depth with 40–60 m d1at 50 m, 70–80 m d1at 150 m, and 90–115 m d1at 500 m. Generally, ASVs were below 100 m d1(Figure 3) implying that slowly sinking particles contributed significantly to the particle export from the photic zone.
On the contrary, during the bloom in the temperate NA, particles sinking from the euphotic zone appeared to be mainly fast particles, with ASVs of 130 ± 35 m d1and 330 ± 30 m d1at 150 m. This is in agreement with results from the Mediterranean Sea using Indented Rotating sphere sediment traps [Lee et al., 2009;
Figure 2.Example of time series of Chlaand PP, using the NASA MODIS satellite, from the four sampling areas, PAP09, PAP12, IB, IrB, and BATS cruises. Complete time series are found in the supporting information.
Wakehaman et al., 2009], where particle sinking velocities during the bloom were ranging from 200 to 500 m d1[Peterson et al., 2009]. Between 2 and 8 May, the significant differences in AVS could have been explained by the fast-growing bloom, which might have promoted the formation of faster-sinking particles.
In the oligotrophic NA, the contribution of slow-sinking particles out of the euphotic zone was apparent both before and during the spring bloom (January and March) with ASVs of 40 ± 10 m d1and 25 ± 5 m d1at 150 m, respectively. These observations match the average velocities (49 ± 25 m d1 at 150–300 m depth) thatMcDonnell et al. [2015] measured at BATS between April 2008 and September 2009. However, at 500 m our ASVs in November and January were much faster (410 ± 90 m d1and 220 ± 60 m d1, respectively).
Our results suggest that slow-sinking particles contribute significantly to the POC downwardflux across the NA with exception of the temperate bloom period. In the next paragraphs we will explore what drives these patterns. The key question is how much these slow-sinking particles contribute toExpEffand whether the contribution toflux remains constant in depth in oligotrophic and temperate regions.
3.1.1. Seasonal Variability in Temperate and Oligotrophic North Atlantic (NA)
We hypothesize, following Stoke’s law [De La Rocha and Passow, 2007], that the slower ASVs in the postbloom temperate NA are due to the relative abundance of small, slowly sinking particles. They are formed in three ways: (1) during the late stages of the bloom, nutrients are depleted and phytoplankton community structure shifts to smaller species [Moore et al., 2005]; (2) toward the end of the bloom there may be more efficient recy- cling of particles in the upper ocean which could, through disaggregation, result in smaller particles; and/or (3) particles are broken and consumed by mesozooplankton and macrozooplankton, which occur in large numbers later in the bloom [Giering, 2013;Wiedmann et al., 2014]. The latter mechanism, however, also pro- duces fast-sinking fecal pellets whose presence likely increases ASVs. Whether mesozooplankton and macro- zooplankton activity increases or decreases ASVs depends on the balance between particle fragmentation and fecal pellet production. In any case, the slow ASVs observed in the postbloom temperature NA are likely caused by a combination of the three mechanisms.
During the spring bloom at the PAP site (MayPAP), surface ASVs are the highest observed during this study (Figures 3 and S2 and Table S2) and sinking velocities at 150 m and 200 m were remarkably high (130 ± 35 m d1 and 330 ± 30 m d1). We have no direct information about the origin of the sinking material.
However, it is likely that sinking particles during the spring bloom in the temperate NA were generated pri- marily by phytoplankton aggregation processes unrelated to zooplankton. This is because the phytoplankton population likely has grown rapidly enough to outcompete their zooplankton grazers [Herndl and Reinthaler, 2013;Martin et al., 2011]. Diatoms, which are often associated with temperature blooms [Martin et al., 2011], Figure 3.Average sinking velocities (AVS in m d1) between 50 and 70 m depth (blue), 150–200 m depth (white), and 400–500 m depth (green), calculated at the PAP site, in Irminger and Iceland Basin, and at the BATS site. Error bars show standard deviation of ASVs for all averaged stations at any one location.
typically have cell diameters between ~10 to 70μm [Moore et al., 2005]. Following Stoke’s law [De La Rocha and Passow, 2007], individual diatom cell sinking velocity should be ranging from 1 to 50 m d1. According to our results, however, ASVs in the spring bloom were much faster, indicating that the high concentration of phytoplankton cells triggered the formation of larger aggregates that sink faster than individual cells [De La Rocha and Passow, 2007;Kiorboe, 2001;Shatova et al., 2012]. Indeed,Martin et al. [2011] observed that export during the IrB spring bloom was driven by fast-sinking diatom aggregates that formed in the presence of transparent exopolymer particles released during silica limitation and that were not grazed by zooplankton.
When the ASVs during the bloom of the temperate (PAPMay) and the oligotrophic NA (BATS March) are com- pared, the fast ASVs at the PAP site contrast strongly with the slow ASVs (<65 m d1) at BATS. We believe that during the bloom, particle composition and the community structure likely played a decisive role in control- ling ASVs. Oligotrophic BATS is a low seasonality ecosystem regularly dominated by picophytoplankton due to low macronutrients and high surface ocean temperature [Durkin et al., 2015;Steinberg et al., 2001]. This results in relatively low but constant rates of PP and carbon export rates [Steinberg et al., 2001] and, likely, a tightly coupled food web. The abundance of small (<3μm)Synechococcusand picoeukaryotes was mea- sured at BATS during our three cruises and found to be most abundant during the March bloom [Brew et al., 2009]. The presence of small cells coupled to a short food web likely prevented the production of large, fast-sinking particles. These conditions could therefore explain our observed ASVs, which were consistently low at both 70 m (ASV = 50, 30, and 20 m d1 in November, January, and March, respectively) and 150 m depth (ASV = 100, 40, and 25 m d1, respectively). Moreover, the lowest ASVs were observed during the bloom (Table S2), whenSynechococcuswas dominating the phytoplankton community. We conclude that the phytoplankton community composition strongly influenced the initial particle sinking velocity of parti- cles exiting the euphotic zone.
3.2. Vertical Variability: Increasing ASV With Depth
Our results are thefirst to show that there is a systematic increase of ASV with depth throughout the year and across the NA (Figure 3). Three possible biogeochemical mechanisms to explain an increase of ASV with depth have been suggested: (i) shallow remineralization of slow-sinking particles as they take more time to reach depth relative to fast-sinking particles [McDonnell et al., 2015]; (ii) preferential remineralization of the organic fraction of larger particles and aggregates with the result of denser and faster particles [Armstrong et al., 2009]; (iii) aggregation in the upper mesopelagic zone, potentially including ballasting biominerals, that results in faster sinking speeds; and (iv) repackaging of sinking matter into faster aggregates or fecal pellets by mesopelagic zooplankton. We believe that the contribution of each of these four processes is dependent not only on the sampling site but also on the season and the community structure.
To evaluate the increase of the ASV with depth, we calculated the change of ASV between two depths (Δv) as Δv¼v2v1
v2 (3)
wherev1andv2are the ASVs at the shallow and deep sampling depths, respectively.
At BATS, ASVs increased dramatically with depth (Δvof up to 88% between 50 and 500 m). This trend likely resulted from the combination of mechanism (i) and (ii) as mesopelagic zooplankton abundance was rela- tively low at this site [Steinberg et al., 2002]. Surface temperatures at BATS are relatively high (~19°C), allowing fast remineralization of slow-sinking particles and the lighter organic fraction (e.g., lipids) in the particles. This mechanism would allow only faster-sinking particles to reach the lower mesopelagic, leading to an overall increase of ASV with depth.
The increase of ASVs from 50 to 150 m depth at IB and PAPJuly site during the decline of the bloom (Δvof 22% and 29%, respectively) is moderate relative to the observed increase at BATS. One possible explanation for this might be the colder temperature (~11°C), presumably leading to slower remineralization rates. Slow- sinking particles would thus penetrate deeper into the mesopelagic before being remineralized.
During the PAP spring bloom (8 May), we observed a high increase in ASV (Δv= 44%) from 150 m (330 ± 30 m d1) to 500 m depth (590 ± 80 m d1). Mesopelagic temperatures are lower at PAP (~10°C) leading to lower microbial remineralization rates compared to BATS, likely on the order of ~8% C d1 [Iversen and
Ploug, 2013]. Microbial remineralization can thus not satisfactorily explain the high increase of ASV at PAP. As described above, export was likely driven by large, fast-sinking diatom aggregates, the formation of these aggregates promote the increase of the ASV (mechanism (iii)).
Particle sinking velocities and temperature are believed to be two of the main factors that influence theExpEff [Buesseler et al., 2007;Henson et al., 2015;Le Moigne et al., 2016]. There is a relationship betweenExpEff,flux attenuation, and increase of velocity with depth. A large increase in sinking velocity implies a strongflux attenuation according to Martin’s curve [Kriest and Oschlies, 2008], andflux attenuation is connected to ExpEff. In one of thefirst quantitative analyses published aboutflux attenuation,Buesseler et al. [2007] corre- latedflux attenuation and sinking velocity as follows: a strong particleflux attenuation in oligotrophic subtro- pical latitudes (compared to that in high latitudes) was associated with (i) high remineralization of the sinking material due to faster biological degradation of sinking particles at higher temperatures and (ii) faster particle remineralization of slower particles, typically associated with tropical water waters.
Therefore, a next step in the sinking velocity analysis would be to analyze global patterns in sinking velocities versus ExpEff in order to determine the influence of sinking particle velocity over ExpEff and carbon flux attenuation.
4. Conclusions
Particleflux attenuation described by Martin’s equation assumes that remineralization rate decreases linearly with depth and/or particle sinking velocities increase linearly with depth; however, previous observations could not detect the sinking velocity increase [Trull et al., 2008]. Here we use the radioactive Po-Pb pair to calculate ASVs across the North Atlantic. Slow-sinking particles (<100 m d1) contributed significantly to downwardflux in most locations, including temperate regions. Moreover, we found that ASVs increased with depth at nearly all sites, with a rate of increase of about 30–90%.
During the postbloom phase in temperate systems, slow particles were likely associated with zooplankton graz- ing. Zooplankton grazing was also one of the main drivers of the increase of ASVs with depth, together with preferential remineralization of slow-sinking particles and the organic fraction in larger particles. High ASVs were found during the bloom. Oligotrophic systems were dominated by slow-sinking picoplankton, and remi- neralization of slow-sinking particles appeared to be the main driver owing to high water temperatures promot- ing higher microbial respiration rates. The community structure strongly influenced ASV during the bloom.
Overall, this study clearly shows that an increase in particle sinking velocities with depth is ubiquitous across the North Atlantic and should be specifically included when trying to model particle export.
References
Alonso-Gonzalez, I. J., J. Aristegui, C. Lee, A. Sanchez-Vidal, A. Calafat, J. Fabres, P. Sangra, P. Masque, A. Hernandez-Guerra, and V. Benitez-Barrios (2010), Role of slowly settling particles in the ocean carbon cycle,Geophys. Res. Lett.,37, L13608, doi:10.1029/
2010GL043827.
Armstrong, R. A., M. L. Peterson, C. Lee, and S. G. Wakeham (2009), Settling velocity spectra and the ballast ratio hypothesis,Deep Sea Res., Part II,56(18), 1470–1478.
Behrenfeld, M. J., and P. G. Falkowski (1997), Photosynthetic rates derived from satellite-based chlorophyll concentration,Limnol. Oceanogr., 42(1), 1–20.
Berelson, W. M. (2002), Particle settling rates increase with depth in the ocean,Deep Sea Res., Part II,49(1–3), 237–251.
Bishop, J. K. B., D. R. Ketten, and J. M. Edmond (1978), Chemistry, biology and verticalflux of particulate matter from the upper 400 m of the Cape Basin in the southeast Atlantic Ocean,Deep Sea Res.,25(12), 1121–1161.
Brew, H. S., S. B. Moran, M. W. Lomas, and A. B. Burd (2009), Plankton community composition, organic carbon and thorium-234 particle size distributions, and particle export in the Sargasso Sea,J. Mar. Res.,67(6), 845–868.
Buesseler, K. O., et al. (2007), Revisiting carbonflux through the ocean’s twilight zone,Science,316(5824), 567–570.
De La Rocha, C. L., and U. Passow (2007), Factors influencing the sinking of POC and the efficiency of the biological carbon pump,Deep Sea Res., Part II,54(5–7), 639–658.
Durkin, C. A., M. L. Estapa, and K. O. Buesseler (2015), Observations of carbon export by small sinking particles in the upper mesopelagic,Mar.
Chem.,175, 72–81.
Falkowski, P. G., R. T. Barber, and V. Smetacek (1998), Biogeochemical controls and feedbacks on ocean primary production,Science, 281(5374), 200–206.
Field, C. B., M. J. Behrenfeld, J. T. Randerson, and P. Falkowski (1998), Primary production of the biosphere: Integrating terrestrial and oceanic components,Science,281(5374), 237–240.
GEOTRACES Standards and Intercalibration Committee (Ed.) (2010),Sampling and Sample-Handling Protocols for GEOTRACES Cruises, Geotraces.
Giering, S. (2013), The role of mesozooplankton in the biological carbon pump of the North Atlantic, PhD Thesis, Sch. of Ocean and Earth Sci., Univ. of Southampton.
Acknowledgments
We thank the captain and crew of the RRSDiscoveryand RRSJames Cookand the scientific team of D341-D350-D354 and JC070 cruises. This work was partially funded by Obra Social
“la Caixa”(Spain) through a Grant for Graduate Studies (E.C.R.), V Research Programme from Universidad de Sevilla (M.V.A. and E.C.R.), and FIS2015-69673-P project from Spanish MEC (M.V.A.). F.A.
C.L.M. is supported by Future Ocean Kiel, (DFG). The data used are listed in the references,figures, and supporting information.
Henson, S. A., I. Robinson, J. T. Allen, and J. J. Waniek (2006), Effect of meteorological conditions on interannual variability in timing and magnitude of the spring bloom in the Irminger Basin, North Atlantic,Deep Sea Res., Part I,53(10), 1601–1615.
Henson, S. A., R. Sanders, E. Madsen, P. Morris, F. Le Moigne, and G. Quartly (2011), A reduced estimate of the strength of the ocean’s biological carbon pump,Geophys. Res. Lett.,38, L04606, doi:10.1029/2011GL046735.
Henson, S. A., R. Sanders, and E. Madsen (2012), Global patterns in efficiency of particulate organic carbon export and transfer to the deep ocean,Global Biogeochem. Cycles,26, GB1028, doi:10.1029/2011GB004099.
Henson, S. A., A. Yool, and R. J. Sanders (2015), Variability in efficiency of particulate organic carbon export: A model study,Global Biogeochem. Cycles,29, 33–45, doi:10.1002/2014GB004965.
Herndl, G. J., and T. Reinthaler (2013), Microbial control of the dark end of the biological pump,Nat. Geosci.,6(9), 718–724.
Iversen, M., and H. Ploug (2013), Temperature effects on carbon-specific respiration rate and sinking velocity of diatom aggregates—
Potential implications for deep ocean export processes,Biogeosciences,10(6), 4073–4085.
Kiorboe, T. (2001), Formation and fate of marine snow: Small-scale processes with large-scale implications,Sci. Mar.,65, 57–71.
Kriest, I., and A. Oschlies (2008), On the treatment of particulate organic matter sinking in large-scale models of marine biogeochemical cycles,Biogeosciences,5(1), 55–72.
Lampitt, R. S., I. Salter, B. A. de Cuevas, S. Hartman, K. E. Larkin, and C. A. Pebody (2010), Long-term variability of downward particleflux in the deep northeast Atlantic: Causes and trends,Deep Sea Res., Part II,57(15), 1346–1361.
Lee, C., M. L. Peterson, S. G. Wakeham, R. A. Armstrong, J. K. Cochran, J. C. Miquel, S. W. Fowler, D. Hirschberg, A. Beck, and J. H. Xue (2009), Particulate organic matter and ballastfluxes measured using time-series and settling velocity sediment traps in the northwestern Mediterranean Sea,Deep Sea Res., Part II,56(18), 1420–1436.
Le Moigne, F. A. C., M. Villa, R. J. Sanders, C. Marsay, S. R. Henson, and R. García-Tenorio (2013), Export of organic carbon and biominerals derived from234Th and210Po at the Porcupine Abyssal Plain,Deep Sea Res., Part I,72, 88–101.
Le Moigne, F. A. C., A. M. Moore, R. J. Sanders, M. Villa-Alfageme, S. Steimberg, and E. Achtemberg (2014), Sequestration efficiency in the iron-limited North Atlantic: Implications for iron supply mode to fertilized blooms,Geophys. Res. Lett.,41, 4619–4627, doi:10.1002/
2014GL060308.
Le Moigne, F. A. C., S. A. Henson, E. Cavan, C. Georges, K. Pabortsava, E. P. Achterberg, E. Ceballos-Romero, M. Zubkov, and R. J. Sanders (2016), What causes the inverse relationship between primary production and export efficiency in the Southern Ocean?,Geophys. Res. Lett.,43, 4457–4466, doi:10.1002/2016GL068480.
Marsay, C. M., R. J. Sanders, S. A. Henson, K. Pabortsava, E. P. Achterberg, and R. S. Lampitt (2015), Attenuation of sinking particulate organic carbonflux through the mesopelagic ocean,Proc. Natl. Acad. Sci. U.S.A.,112(4), 1089–1094.
Martin, J. H., G. A. Knauer, D. M. Karl, and W. W. Broenkow (1987), VERTEX: Carbon cycling in the northeast Pacific,Deep Sea Res.,34(2), 267–285.
Martin, P., R. S. Lampitt, M. J. Perry, R. Sanders, C. Lee, and E. D’Asaro (2011), Export and mesopelagic particleflux during a North Atlantic spring diatom bloom,Deep Sea Res., Part I,58(4), 338–349.
McDonnell, A. M. P., and K. O. Buesseler (2010), Variability in the average sinking velocity of marine particles,Limnol. Oceanogr.,55(5), 2085–2096.
McDonnell, A. M. P., P. W. Boyd, and K. O. Buesseler (2015), Effects of sinking velocities and microbial respiration rates on the attenuation of particulate carbonfluxes through the mesopelagic zone,Global Biogeochem. Cycles,29, 175–193, doi:10.1002/2014GB004935.
Moore, C. M., M. I. Lucas, R. Sanders, and R. Davidson (2005), Basin-scale variability of phytoplankton bio-optical characteristics in relation to bloom state and community structure in the Northeast Atlantic,Deep Sea Res., Part I,52, 401–419.
Peterson, M. L., J. Fabres, S. G. Wakeham, C. Lee, I. J. Alonso, and J. C. Miquel (2009), Sampling the vertical particleflux in the upper water column using a large diameter free-drifting NetTrap adapted to an Indented Rotating Sphere sediment trap,Deep Sea Res., Part II,56(18), 1547–1557.
Riley, J., R. Sanders, C. Marsay, F. Le Moigne, E. Achterberg, and A. Poulton (2012), The relative contribution of fast and slow sinking particles to ocean carbon export,Global Biogeochem. Cycles,26, GB1026, doi:10.1029/2011GB004085.
Sarmiento, J. L., and J. R. Toggweiler (1984), A new model for the role of the oceans in determining atmospheric PCO2,Nature,308(5960), 621–624.
Schlitzer, R. (2000), Applying the adjoint method for biogeochemical modeling: Export of particulate organic matter in the world ocean, in Inverse Methods in Global Biogeochemical Cycles,Geophys. Monogr. Ser., vol. 114, pp. 107–124, AGU, Washington, D. C.
Shatova, O., D. Koweek, M. H. Conte, and J. C. Weber (2012), Contribution of zooplankton fecal pellets to deep ocean particleflux in the Sargasso Sea assessed using quantitative image analysis,J. Plankton Res.,34(10), 905–921.
Siegel, D., S. Doney, and J. Yoder (2002), The North Atlantic spring phytoplankton bloom and Sverdrup’s critical depth hypothesis,Science, 296(5568), 730–733.
Steinberg, D. K., C. A. Carlson, N. R. Bates, R. J. Johnson, A. F. Michaels, and A. H. Knap (2001), Overview of the U.S. JGOFS Bermuda Atlantic Time-series Study (BATS): A decade-scale look at ocean biology and biogeochemistry,Deep Sea Res., Part II,48, 1405–1447.
Steinberg, D. K., S. A. Goldthwait, and D. A. Hansell (2002), Zooplankton vertical migration and the active transport of dissolved organic and inorganic nitrogen in the Sargasso Sea,Deep Sea Res., Part I,49(8), 1445–1461.
Stewart, G. M., S. B. Moran, and M. W. Lomas (2010), Seasonal POCfluxes at BATS estimated from210Po deficits,Deep Sea Res., Part I,57(1), 113–124.
Suess, E. (1980), Particulate organic carbonflux in the oceans—Surface productivity and oxygen utilization,Nature,288(5788), 260–263.
Trull, T. W., S. G. Bray, K. O. Buesseler, C. H. Lamborg, S. Manganini, C. Moy, and J. Valdes (2008), In situ measurement of mesopelagic particle sinking rates and the control of carbon transfer to the ocean interior during the Vertical Flux in the Global Ocean (VERTIGO) voyages in the North Pacific,Deep Sea Res., Part II,55(14–15), 1684–1695.
Turner, J. T. (2002), Zooplankton fecal pellets, marine snow and sinking phytoplankton blooms,Aquat. Microb. Ecol.,27(1), 57–102.
Villa-Alfageme, M., F. de Soto, F. A. C. Le Moigne, S. Giering, M. Salvador, and R. Sanders (2014), Observations and modeling of slow-sinking particles in the twilight zone,Global Biogeochem. Cycles,28, 1327–1342, doi:10.1002/2014GB004981.
Wakehaman, S. G., C. Lee, M. L. Peterson, Z. Liu, J. Szlosek, I. F. Putnam, and J. Xue (2009), Organic biomarkers in the twilight zone—Time series and settling velocity sediment traps during MedFlux,Deep Sea Res., Part II,56, 1437–1453.
Wiedmann, I., M. Reigstad, A. Sundfjord, and S. N. Basedow (2014), Potential drivers of sinking particle’s size spectra and verticalflux of particulate organic carbon (POC): Turbulence, phytoplankton, and zooplankton,J. Geophys. Res. Oceans,119, 6900–6917, doi:10.1002/
2013JC009754.