Is there demand for formality among informal firms?
Evidence from microfirms in downtown Lima
Miguel Jaramillo
May 2009
Discussion Paper / Deutsches Institut für Entwicklungspolitik ISSN 1860-0441
Jaramillo, Miguel: Is there demand for formality among informal firms : evidence from microfirms in downtown Lima / Miguel Jaramillo. – Bonn : DIE, 2009. − (Discussion Paper / Deutsches Institut für Ent- wicklungspolitik ; 12/2009)
ISBN 978-3-88985-462-9
Miguel Jaramillo is senior researcher at the Group for the Analysis of Development – GRADE in Lima, Perú.
E-mail: mjaramillo@grade.org.pe
© Deutsches Institut für Entwicklungspolitik gGmbH Tulpenfeld 6, 53113 Bonn
℡ +49 (0)228 94927-0 +49 (0)228 94927-130 E-mail:die@die-gdi.de http://www.die-gdi.de
Acknowledgements
This paper was designed and largely written during a visit to the German Development Institute / Deutsches Institut für Entwicklungspolitik (DIE) in the summer of 2008. I am grateful to Christian von Drachenfels for assistance with the literature review and Arturo García, who assisted with data processing. Also, thanks to Tilman Altenburg, Matthias Krause, and Christian von Drachenfels for comments on a preliminary version.
Miguel Jaramillo Lima, June 2009
Abstract
Experimental data from microfirms in downtown Lima is exploited to analyse the demand for formality, i.e., obtaining an operating license. The results are paradoxical: most firms report greater disadvantages than advantages of being informal, yet when encouraged to obtain the license, only one out of four firms takes up the incentive. Thus, for some firms formalisation may not be desirable at any cost. This is likely to be associated with the re- current costs of being formal, the low perceived value of the benefits of formalisation, and the limited growth perspectives of these firms.
Keywords: firm behaviour, informality, demand for formality, Peru JEL codes: D21, E26, L25, 017
Contents
1 Introduction 1
2 Literature review 2
3 Data description 4
4 Characteristics of the firms 5
5 The demand for formality: rationale for being formal 8
6 Are microfirms in downtown Lima really willing to formalise? 13
7 Conclusions and policy implications 15
Bibliography 17
Annex 17
Tables
Table 1: Firms and entrepreneurs, characteristics 5
Table 2: Business features 7
Table 3: Reasons for obtaining a license 9
Table 4: Reasons for not obtaining a license 9
Table 5: Advantages and disadvantages of having a license: perceptions of
those that have a license 10
Table 6: Advantages and disadvantages of having a license: perceptions of
those that DO NOT have a license 11
Table 7: Circumstances under which firms would consider obtaining a license
of operation 12
Table 8: Results of encouragement to formalise and reasons for not taking it up 13 Table 9: Determinants of obtaining a license: probit marginal effects 14 Table A1: Metropolitan Lima: educational levels among 25−65 year-olds (2006) 21
Is there demand for formality among informal firms? Evidence from microfirms in downtown Lima
German Development Institute 1
1 Introduction
After several decades of academic debate, informality is still a central policy issue in developing countries. Informality imposes costs on society in the form of a small tax revenue base, congestion of public services, which must serve a much broader popula- tion than that contributing to its financing, and unfair competition, factors which tend to translate into lower economic growth. Weak state structures have thus far made it im- possible to keep track of the increase in the number of informal enterprises, let alone to find ways to lead those already active onto the path of legality. Presently, the stock of output and employment attributable to the informal sector is a sizable part of the econo- mies even of middle income and the countries of the Organisation for Economic Co- operation and Development (OECD).1 Clearly, informal firms are a heterogeneous lot and portions of them (the so-called subsistence units) lack the productivity levels they would need to pay most regulatory costs. However, another significant portion may be able to reap benefits from formalising their activities. Thus, policy measures should tar- get this group of firms and induce them to formalise by reducing the costs of being in the formal sector as well as enhancing its benefits. There is, however, little evidence on the motivations and conditioning factors that shape the decision of informal entrepre- neurs to stay informal or move to the formal sector.
In this paper new empirical evidence on the motivations and circumstances of informal firms is used to analyse the demand for formality. The data come from two rounds of a recent survey of informal microfirms in Lima’s downtown area (El Cercado), carried out as part of a panel/tracer study to evaluate the impact of having an operating license on firms’ performance indicators, which includes an effort to generate experimental data.2 The experiment consisted in encouraging a random sample of the firms interviewed in the first survey round to formalise by subsidising the full money cost and providing guidance through the process. The data set includes general features of the entrepreneur and the firm, including access to capital and service markets, basic performance indica- tors, as well as aspects related to the motivations involved in the decision to formal- ise/stay informal. Cross-sectional data from the two rounds is exploited to identify fac- tors associated with the potential demand for formality. The results are paradoxical:
most firms report greater disadvantages than advantages of being informal, yet when encouraged to obtain the license, only one out of four firms takes up the incentive. Thus, for some firms formalisation may not be desirable at any cost. This is likely associated with the recurrent costs of being formal and the limited growth perspectives of these firms.
The paper is organised as follows. Following this introduction, the literature on formal- ity and firm behaviour is reviewed in order to locate our questions within the ongoing academic and policy debate. Section 3 describes the data. Section 4 presents the general characteristics of the firms and entrepreneurs in our sample. Section 5 considers the evi- dence concerning the rationale for formality/informality and analyses firm-level factors associated with formalisation. Section 6 concludes and discusses policy implications.
1 Schneider (2007) estimates the size of the informal economy for 145 countries. The average size for developing and transition countries is around 40 % of gross domestic product (GDP), while in OECD countries it is 16.3 %, with 5 out of 21 countries topping the 20 % mark.
2 Alcázar / Andrade / Jaramillo (2007). The study is funded by State Secretariat for Economic Affairs (SECO) through the International Finance Corporation.
Miguel Jaramillo
German Development Institute
2
2 Literature review
The question of formal versus informal status goes back quite a while in the economics literature. Its origins date back to the classic dual labour markets models of Lewis (1954) and Harris-Todaro (1970). In these models self-employment is a consequence of the inca- pacity of the modern/formal sector to incorporate an elastic supply of labour leaving low- productivity rural activities. Confronted with insufficient opportunities for salaried em- ployment, workers opt to generate their own employment. These self-generated jobs may, however, be quickly abandoned in the face of an opportunity to engage in wage labour in the formal sector. The result is a segmented labour market, where self-employment is not really an option but a refuge.3
This view still prevails in part of the literature.4 Another strand, however, takes a different view: the self-employed may not be a residual from the formal sector but a natural entre- preneur forced to produce outside the legal boundaries by an institutional environment littered with hurdles and barriers to private productive initiative.5 The regulatory hurdles and barriers translate into a level of costs that the entrepreneur cannot afford, given his/her firm’s low productivity levels. The question of the effects of regulation on entrepreneur- ship has produced an ever growing body of literature. One source of empirical support for the idea of the negative role of regulation is macro-level cross-country data analysis, which shows that cost of regulation correlates positively with level of informality (Djankov et al. 2002; Loayza / Oviedo / Serven 2005). Using data for European countries, Klapper / Laeven / Rajan (2006) conclude that costly regulations hamper the creation of new firms, particularly in industries that should naturally have high entry. Also, new en- trants tend to be larger and incumbent firms in naturally high-entry industries tend to grow more slowly.
However, other studies diverge from these conclusions. Van Stel / Storey / Thurik (2007), using a database of 39 countries across the five continents (including 13 poor countries), find that lowering entry barriers may result in lower levels of informality but not in higher entrepreneurship rates. Their findings indicate that entry regulation influences the distribu- tion of business activity between the formal and the informal economy, rather than influ- encing the total volume of activity. Therefore, they question the view that ‘heavily regu- lated’ countries as regards firm entry need only to lower entry barriers in order to become more enterprising, and thus wealthy. Hence, deregulation, while useful to curb informality, seems insufficient to promote entrepreneurship.
In spite of the continuing academic debate, the idea that regulatory costs hurt entrepre- neurship and cause informality has already had a major influence in policy making. This is the idea, for instance, behind the influential Doing Business Project (World Bank / IFC 2003−2009). By annually publishing indicators of the ease of doing business in a large set of countries, this research has led to a call for a lowering of regulatory barriers in order to
3 A useful and recent review of these models may be found in Fields (2005).
4 See, for instance, Tokman (2007).
5 De Soto (1986) has popularized this view, but see also the broad survey by Schneider / Enste (2000) for a view that sees institutional factors, extending from increasing taxation to regulatory burden, as the dri- ving force behind informality.
Is there demand for formality among informal firms? Evidence from microfirms in downtown Lima
German Development Institute 3
enable formalisation and stimulate growth.6 The visibility of this work has put pressure on politicians and generated strong momentum for reforming regulations to address informal- ity.
However, this approach has also attracted substantial criticism. Arruñada (2007) argues that there is an excessive and pernicious focus on initial costs of setting up a firm while both the value of services provided by registration and the reduction of transaction costs over the life-cycle of a firm are disregarded. Altenburg / von Drachenfels (2006) label the Doing Business approach minimalist and question its potential to address both informality and private sector development. Their central contention is that this approach is far from sufficient to deliver on its promise. Specifically, they argue that the idea that formalisation and growth of formerly informal firms will take place once deregulation is implemented is based on two questionable assumptions about firms operating in the informal economy.
First, that a majority of the people in the informal economy are vibrant entrepreneurs who are only waiting for their chance to expand their businesses once they are formalised and, second, that cumbersome registration procedures are the major barrier to growth. Testing the second assumption requires assessing empirically different types of obstacles to busi- ness growth, from poor human capital endowments to credit constraints to lack of access to technology, and modelling their interactions with the institutional environment. This has yet to be done. The first assumption has, however, already been put to the test in the literature, and it brings us back to the question of whether the informal sector is a refuge sought by “necessity entrepreneurs” or a source of natural entrepreneurship.
Clearly, how much entrepreneurial potential there really is in the informal economy it is a matter of dispute. To contribute to this debate, which they dub the de Soto (mostly “oppor- tunity entrepreneurship” constrained by ‘unfair’ regulations) vs. Tokman (mostly “neces- sity entrepreneurship” constrained by multiple deprivations) debate, De Mel / McKenzie / Woodruff (2008) study a panel of Sri Lankan firms and compare the characteristics of microentrepreneurs, self-employed, and wage earners. They conclude that no less than two-thirds of own-account workers can be classified as wage workers rather than entre- preneurs. Woodruff (2007) has extended this argument, characterizing the self- employment sector as a self-help safety net.
In the other direction, looking at the Peruvian labour market, Yamada (1996) concludes that in a context marked by strong heterogeneity, self-employment is not a refuge but an option. He finds that, on average, self-employed workers earn 20 % more than what they would if they were wage earners in the formal sector. This differential is explained by the entrepreneurial ability of the self-employed, who, the author concludes, overwhelmingly self-select themselves out of the wage labour force. Only about one third of the self- employed would do better as wage earners. Along this line, Maloney (2004) has examined transitions between wage labour and self-employment as well as characteristics and choices of microentrepreneurs in Mexico, Brazil, and Argentina. He concludes that the informal sector in Latin America may best be described as a basically voluntary entrepre- neurial sector.
6 In the latest edition, the Doing Business Report deals with the costs caused by regulations for 181 coun- tries with regard to starting a business, employing workers, getting credit, enforcing contracts, closing a business, registering property, dealing with licenses, protecting investors, paying taxes, and trading across borders. These costs are measured as direct costs, such as license fees, and indirect costs, like the number of procedures it takes to comply with regulations.
Miguel Jaramillo
German Development Institute
4
One clear conclusion from this debate is that the informal sector is quite heterogeneous and a place where one may find those left out of the formal wage labour market, but also potential entrepreneurs. At the centre of the debate is the question which group is domi- nant. The actual mix may differ from country to country. While there is no necessary link, one would expect that subsistence units run by ‘necessity entrepreneurs’ would find little incentive to become formal, while ‘opportunity entrepreneurs’ would be more likely to formalise.7 Thus, one mighty expect formalisation not to be attractive for everyone in the informal sector, and consequently, no matter how much the cost of formalising is lowered, as long as it remains greater than zero, there will be informal firms. Also, one would ex- pect that it is among those firms that perceive the greater potential gains from changing their status that demand for formalisation would be concentrated. However, we do not find many studies that focus on transitions from informality to formality among microfirms.8 Why some (informal) firms formalise and others do not is a question on which little em- pirical evidence has been produced. In this paper I try to cast light on it by examining ini- tial data from a unique experiment among informal firms in downtown Lima.
3 Data description
The data used in this analysis comes from two rounds of a panel of informal firms located in downtown Lima (El Cercado). These are part of a data collection effort that aims to assess the impact of a specific type of formality that associated with having an operating license granted by the municipality, on firms’ performance. The two rounds were imple- mented in 2008. The first round served to construct a baseline for the study. A total of 604 firm operators were interviewed. Lacking a sample framework for the informal sector, firms were identified through fieldwork covering the areas where, according to municipal authorities, informality is concentrated. We excluded shopping malls (‘galerías’) and per- manent fairs (‘campos feriales’), as firms operating in these areas are not required by law to have an operating license. Thus, we cannot claim that our sample represents informal microfirms in El Cercado, although it is likely that it represents well microfirms in El Cercado not operating in galleries or permanent fairs. The questionnaire covers informa- tion about firms’ outcomes, such as sales; inputs, such as investment, access to credit, and labour; and other features, such as size and age of firm; as well as characteristics of the entrepreneur. Another set of questions was included to provide contextual information that would help us to interpret the results, such as entrepreneurs’ perceived benefits and costs associated with formalisation.
The second round was implemented six months later, after we had conducted a process of encouraging a random sample of the firms to get their operating license. We do not use the panel structure of the data, but instead exploit the two cross-sections. The first-round data allows us to examine the ex ante motivations for formalising, while in the second-round data we exploit the fact that not all firms encouraged took up the incentive in order to ana- lyse factors associated with formalisation.
7 The link is not necessary because it may be that, for instance, opportunity entrepreneurs find room to thrive in informality, at least at some stage of their firms’ development. Conversely, necessity entrepre- neurs may find it desirable to formalise if, for instance, there is a serious enforcement effort by authori- ties.
8 This is no doubt related to the scarcity of longitudinal data sets that follow the trajectories of informal firms over time. One interesting approach is that in Nelson / De Bruijn (2005), who propose a phenome- nological model of the transition based on five cases of successful transition in Tanzania.
Is there demand for formality among informal firms? Evidence from microfirms in downtown Lima
German Development Institute 5
4 Characteristics of the firms
Who are the informal?
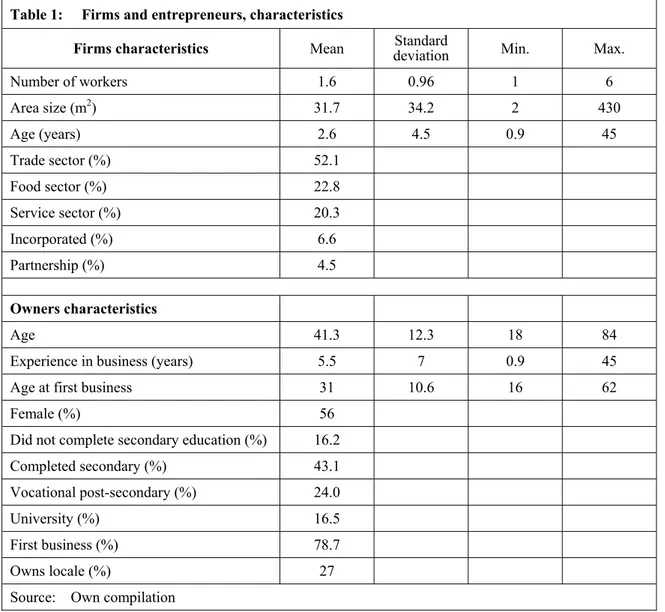
Table 1, below, summarizes the main features of firms and entrepreneurs in our sample.
All firms qualify as microfirms as they have no more than 6 workers. Most (61.6 %) have only 1 worker and the second largest group (23.1 %) has 2 workers only. Thus, the group of firms is at the lower end of the size distribution of firms. This is also reflected in their area size, which averages around 32 square meters. This seems particularly small if we consider that there are a good number (23 %) of restaurants, cafes, and other food- dispensing businesses in the sample.
With regard to activity, most of the firms are in commerce. This includes a diverse set of es- tablishments, from neighbourhood convenience stores to jewellers or information technology (IT) supplies providers. The second largest group is in the food sector and includes restau- rants, cafes, ice-cream parlours, and bakers. The third largest group is in the service sector (20.3 %) and includes printing, internet and phoning services, beauty parlours, and repair shops. Very few of these businesses, independent of the sector they belong to, have an autonomous legal existence. That is, most of them have not incorporated. Also, they are al- most exclusively individually owned businesses, with less than 5 % involving partnerships.
Table 1: Firms and entrepreneurs, characteristics
Firms characteristics Mean Standard
deviation Min. Max.
Number of workers 1.6 0.96 1 6
Area size (m2) 31.7 34.2 2 430
Age (years) 2.6 4.5 0.9 45
Trade sector (%) 52.1
Food sector (%) 22.8
Service sector (%) 20.3
Incorporated (%) 6.6
Partnership (%) 4.5
Owners characteristics
Age 41.3 12.3 18 84
Experience in business (years) 5.5 7 0.9 45
Age at first business 31 10.6 16 62
Female (%) 56
Did not complete secondary education (%) 16.2 Completed secondary (%) 43.1 Vocational post-secondary (%) 24.0
University (%) 16.5
First business (%) 78.7
Owns locale (%) 27
Source: Own compilation
Miguel Jaramillo
German Development Institute
6
Looking at the owners’ characteristics, somewhat surprisingly most of them (56 %) turn out to be women. This gender ratio compares favourably with the population of self- employed in Metropolitan Lima that have at least one employee, among which 50.3 % are women. However, if we further narrow the category to include only self-employed women in the trade or service sector, the proportion of women increases to 51.9 %, and if we fur- ther restrict it to those with 1 to 6 employees, it jumps to 61.9 %. Thus, far from being an anomaly, predominance of women entrepreneurs among the type of business we are focus- ing on seems to be the rule.9
As for education, most entrepreneurs in our sample have at least completed secondary education (43.1 %) and a good portion of them (40.5 %) have post-secondary studies.
Also, among those with some post-secondary education, four out of ten did their studies at the university level, while the rest attended vocational/technical schools. How does this compare with Lima’s labour force? Table A1 in the appendix allows this comparison. The educational profile of El Cercado’s informal entrepreneurs seems a bit different than that of Lima’s labour force. A larger portion of the former has completed secondary (43 % versus 35 %) and also a slightly larger portion has some post-secondary education (40.5 % vs. 36 %). On the other hand, however, the mix among those with post-secondary educa- tion is less favourable to Cercado’s entrepreneurs, as non-university attendees predomi- nate among them, while in the case of Metropolitan Lima the opposite is true. Thus, though on average the entrepreneurs in our sample fare better educationally than Lima’s overall labour force at the basic level, it tends to have a larger concentration of people from vocational/technical schools at the post-secondary level.
The average entrepreneur in our sample is 41 years old. These entrepreneurs have had significant experience in business, 5.5 years on average. If we compare this figure with that of the age of their present business, we conclude that on average half of this experi- ence has been acquired in their present business. For about four out of five entrepreneurs in the sample, the present business venture is their first. Finally, slightly more than one quarter of our entrepreneurs report that they own the locale of their businesses. In most of these cases, four out of five, the locale is also the owner’s house.
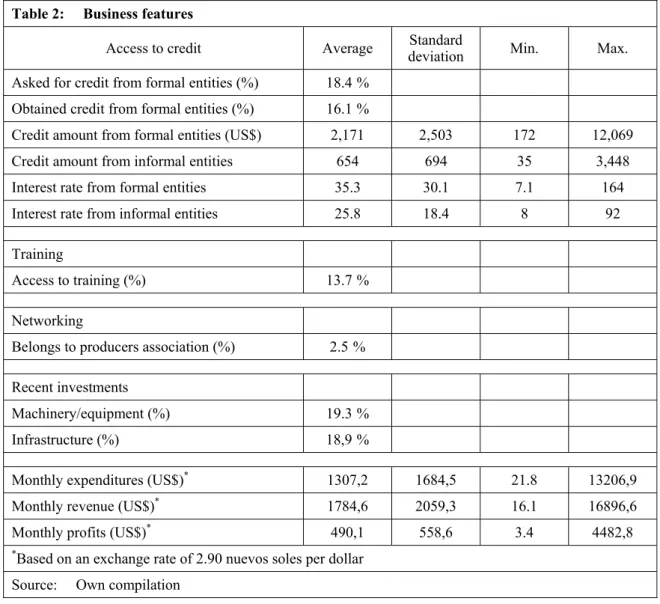
Table 2 summarises the information concerning the more operational features of the firms in our sample. As far as credit goes, one out of five firms requested credit from formal financial entities in the last three years and more than 90 % of them obtained it. This rate of success may seem large, but two factors need to be considered. First, this is a self- selected sample, as those that perceive that they have a low probability of success proba- bly did not bother to apply. Second, some respondents may be ashamed to admit that their credit applications were rejected. It may also be noted that an additional 11.7 % requested, and all of them got, credit from informal sources. The main source in this case is family and friends, but informal lenders figure as well.
The amounts granted by formal financial entities are not small for the type of firm, close US$ 2,200, but the variance is quite large. The median is below the average, US$ 1,700, indicating that most credits are for amounts below the average. Interest rates charged by informal sources are lower than those from formal entities, which is explained by the fact that the informal sources tend to be relatives and friends.
9 This finding contrasts with Carr / Chen (2004) and Chen at al. (2005), who suggest a minor role for women as employers in the informal sector.
Is there demand for formality among informal firms? Evidence from microfirms in downtown Lima
German Development Institute 7
Table 2: Business features
Access to credit Average Standard
deviation Min. Max.
Asked for credit from formal entities (%) 18.4% Obtained credit from formal entities (%) 16.1%
Credit amount from formal entities (US$) 2,171 2,503 172 12,069 Credit amount from informal entities 654 694 35 3,448
Interest rate from formal entities 35.3 30.1 7.1 164 Interest rate from informal entities 25.8 18.4 8 92
Training
Access to training (%) 13.7%
Networking
Belongs to producers association (%) 2.5%
Recent investments
Machinery/equipment (%) 19.3%
Infrastructure (%) 18,9%
Monthly expenditures (US$)* 1307,2 1684,5 21.8 13206,9
Monthly revenue (US$)* 1784,6 2059,3 16.1 16896,6
Monthly profits (US$)* 490,1 558,6 3.4 4482,8
*Based on an exchange rate of 2.90 nuevos soles per dollar Source: Own compilation
Access to training is very limited, as only 1 out of every 7 firms had any during the previ- ous year. The proportion increases to 1 in every 5 if we exclude firms with 2 or less em- ployees. In both cases training was mostly used by the owner; this occurred two thirds of the time. The main reasons given for not having made any use of training are lack of in- formation (61 %) and no time (28 %). Cost (7 %) is much less important.
The firms in our sample are very isolated, as only a tiny minority belong to any producers or business association. Only about one out of five has made investments in the last six months in either equipment or infrastructure. Finally, the average monthly expenditure is about US$ 1,300, while reported revenues border on US$ 1,800, reported net income or profit are around US$ 500, which represents about three times the minimum wage. Con- sidering that the minimum wage is around the median of labour earnings in Peru, our sam- ple of businesses produce income for their owners that is in the top half of the income dis- tribution.10 Note also that the variance of these numbers is quite large, far larger than the variance in the indicators of size.
10 See Jaramillo / Lopez (2006) for an analysis of the role of the minimum wage in the distribution of earnings in Peru over the decade 1995−2004. Unpublished estimates for 2005 indicate that the minimum wage is around the middle of the distribution of labour earnings for private sector salaried workers in urban Peru.
Miguel Jaramillo
German Development Institute
8
5 The demand for formality: rationale for being formal
If we are to analyse the demand for formalisation among small firms, a starting point is to ask for what reasons an entrepreneur would decide to formalise or not formalise his or her firm. Since our baseline data set includes a (small) portion of firms (11 %) that report hav- ing a provisional license, we can ask them why they got their operating license.11 Table 3 sets out the different types of reasons for becoming formal. Two comments seem in order.
First, “being on the legal side” seems to have some value for entrepreneurs, as nine out of ten entrepreneurs mention it as a reason to become formal. This evidence calls into ques- tion the idea of informality as part of an alternative culture that tends to disregard or downplay the legal system. How much of this is just lip service without much content is an open question, however. Second, if we classify reasons in two groups, one with those aspects entrepreneurs want to avoid, let us call them ‘negative reasons’, and the other with those aspects that the entrepreneur wants to take advantage of, let us call them ‘positive reasons’, we find that it is the former that predominates. In effect, avoiding fines or bribes is the reason most often mentioned to be formal. Among the ‘positive reasons’, greater visibility (through publicity) and access to credit are the most important, but enlarging their market through business with larger firms or participation in public biddings is also mentioned, as well as participating in public programs.
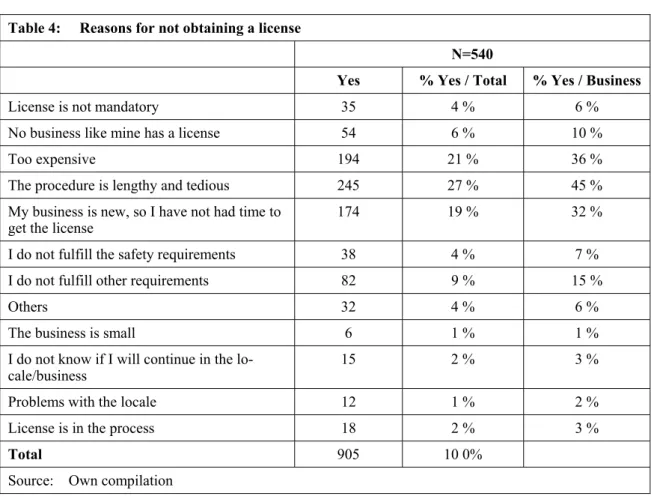
Among those businesses that have not gotten their licenses, the reasons for not obtaining the license (see Table 4) can be classified in four groups. The first is timing: the business is new and they have not had the time to start the process of registering. One third of the firms report this. The second has to do with the perceived costs and administrative burden of the process. Close to half of the firms in the sample (45 %) argue that the process of getting a license is long and tedious, while more than a third (36 %) thinks that the license is too expensive. Since it was possible to mark more than one answer, it is possible that there is considerable overlap among those that marked these two answers. The third group of causes is associated with information issues. One out of ten businesses claim that their type business does not have a license and an additional 6 % that a license is not manda- tory. Finally, the fourth group includes those firms that believe that they do not meet the prerequisites, regarding safety (7 %) or other aspects (15 %).
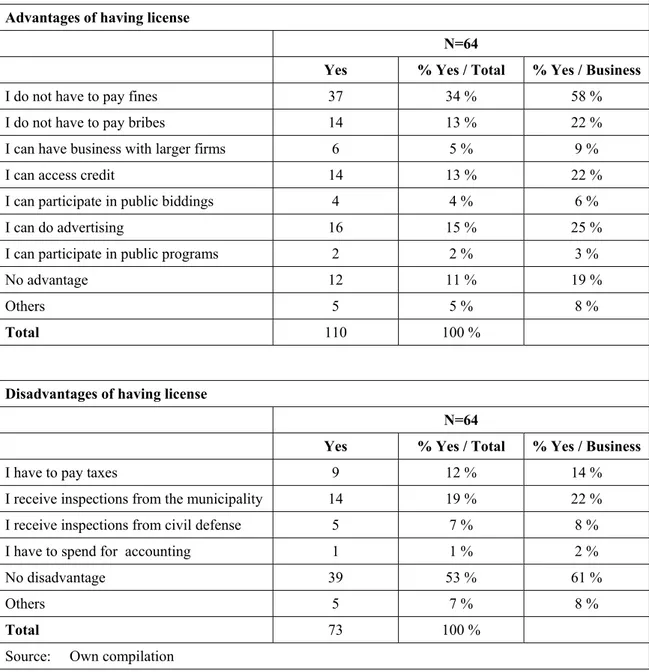
In addition to their stated reasons for being/not being formal, the entrepreneurs have a perception of what the advantages or disadvantages are of having/not having a license, based on their own experience. Table 5 presents the perceptions of those that have a li- cense. Aside from the fact one out of five entrepreneurs do not perceive any practical ad- vantage, the answers are pretty much consistent with the reasons for becoming formal.
The one most frequently mentioned is that they do not have to pay fines anymore; about three out of five firms mention this as an advantage. Not having to pay bribes is also a frequent answer, involving one out of five firms. Among the “positive” advantages, being able to use publicity (25 %) and to access credit (22 %) are the most important. Market expansion is also perceived by some firms as an advantage of having license, as one out of ten firms mention having business with larger firms, and one out of fifteen mention par- ticipation in public biddings. Finally, very few firms (3 %) find an advantage in being able to participate in public programs.
11 There is a larger group (23 % of the sample) that reports having started the process of obtaining a li- cense. While we have collected data from them, we are sceptical about these reports, since these persons may just be trying to avoid reporting themselves as informal. We will be able to test the grounds for our scepticism after the second data collection round, in six months.
Is there demand for formality among informal firms? Evidence from microfirms in downtown Lima
German Development Institute 9
Table 3: Reasons for obtaining a license
N=64
Yes % Yes / Total % Yes / Business
Being on the legal side 58 43.9 % 91 %
Avoid paying fines 35 26.5 % 55 %
Avoid paying bribes 11 8.3 % 17 %
Have business with larger firms 4 3.0 % 6 %
Do advertising 8 6.1 % 13 %
Access credit 8 6.1 % 13 %
Participate in public biddings 1 0.8 % 2 %
Participate in public programs 4 3.0 % 6 %
Others 3 2.3 % 5 %
Total 132 100.0 %
Source: Own compilation
Table 4: Reasons for not obtaining a license
N=540 Yes % Yes / Total % Yes / Business
License is not mandatory 35 4 % 6 %
No business like mine has a license 54 6 % 10 %
Too expensive 194 21 % 36 %
The procedure is lengthy and tedious 245 27 % 45 % My business is new, so I have not had time to
get the license 174 19 % 32 %
I do not fulfill the safety requirements 38 4 % 7 %
I do not fulfill other requirements 82 9 % 15 %
Others 32 4 % 6 %
The business is small 6 1 % 1 %
I do not know if I will continue in the lo-
cale/business 15 2 % 3 %
Problems with the locale 12 1 % 2 %
License is in the process 18 2 % 3 %
Total 905 10 0%
Source: Own compilation
In addition to their stated reasons for being/not being formal, the entrepreneurs have a perception of what the advantages or disadvantages are of having/not having a license, based on their own experience. Table 5 presents the perceptions of those that have a li- cense. Aside from the fact one out of five entrepreneurs do not perceive any practical ad- vantage, the answers are pretty much consistent with the reasons for becoming formal.
The one most frequently mentioned is that they do not have to pay fines anymore; about
Miguel Jaramillo
German Development Institute
10
Table 5: Advantages and disadvantages of having a license: perceptions of those that have a license Advantages of having license
N=64 Yes % Yes / Total % Yes / Business
I do not have to pay fines 37 34 % 58 %
I do not have to pay bribes 14 13 % 22 %
I can have business with larger firms 6 5 % 9 %
I can access credit 14 13 % 22 %
I can participate in public biddings 4 4 % 6 %
I can do advertising 16 15 % 25 %
I can participate in public programs 2 2 % 3 %
No advantage 12 11 % 19 %
Others 5 5 % 8 %
Total 110 100 %
Disadvantages of having license
N=64 Yes % Yes / Total % Yes / Business
I have to pay taxes 9 12 % 14 %
I receive inspections from the municipality 14 19 % 22 % I receive inspections from civil defense 5 7 % 8 %
I have to spend for accounting 1 1 % 2 %
No disadvantage 39 53 % 61 %
Others 5 7 % 8 %
Total 73 100 %
Source: Own compilation
three out of five firms mention this as an advantage. Not having to pay bribes is also a frequent answer, involving one out of five firms. Among the “positive” advantages, being able to use publicity (25 %) and to access credit (22 %) are the most important. Market expansion is also perceived by some firms as an advantage of having license, as one out of ten firms mention having business with larger firms, and one out of fifteen mention par- ticipation in public biddings. Finally, very few firms (3 %) find an advantage in being able to participate in public programs.
Six out of ten firms perceive no disadvantage in having the operating license. Among the disadvantages mentioned, the most frequent is related to inspection visits from the mu- nicipality or safety authorities. This is mentioned by more than half of those firms perceiv- ing some disadvantage. What is surprising is that it rates above paying taxes, which is the next most frequently mentioned, by about one out four firms that identified some disad- vantage. This is an important finding for its policy implications: inspections may be a stronger factor discouraging formalisation than taxes.
Is there demand for formality among informal firms? Evidence from microfirms in downtown Lima
German Development Institute 11
Table 6: Advantages and disadvantages of having a license: perceptions of those that DO NOT have a license
Advantages of not having license
N=540 Yes % Yes / Total %Yes / Business
I do not have to pay fines 67 11 % 12 %
I do not have to pay municipal taxes 91 15 % 17 %
I do not receive inspections from the municipality 63 10 % 12 %
I do not receive safety inspections 29 5 % 5 %
Others 6 1 % 1 %
No advantage 340 56 % 63 %
Does not know /does not answer 4 1 % 1 %
I do not have to spend money on official procedures 9 1 % 2 %
Total 609 100 %
Disadvantages of not having license
N=540 Yes % Yes / Total %Yes / Business
I cannot have business with larger firms 58 5 % 11 %
Risk of paying bribes 194 17 % 36 %
Risk of paying fines 367 32 % 68 %
I cannot put a sign 158 14 % 29 %
I cannot access credit 121 11 % 22 %
I have to buy more expensive / lower quality inputs 3 0 % 1 %
I cannot do advertising 95 8 % 18 %
I cannot participate in public biddings 30 3 % 6 % I cannot participate in public programs 29 3 % 5 %
Others 9 1 % 2 %
No disadvantage 65 6 % 12 %
It is a source of worries 13 1 % 2 %
Total 1142 100 %
Source: Own compilation
Table 6 focuses on the views of those that do not have a license. Most of them (63 %) see no advantage in their informal status. Among the perceived advantages, the two most fre- quently identified are not to have to pay municipal taxes and not to receive inspections, both mentioned with similar frequency, by about one third of those who see advantages.
Not having to pay fines is the next important advantage, identified by about one-fourth of those perceiving disadvantages.12
12 One reasonable concern is that firm owners’ reports may understate the benefits of being informal, be- cause they may not be willing to admit any outright infraction of the law. We have no way to test the va- lidity and importance of this concern. However, we consider this issue in discussing our results below.
Miguel Jaramillo
German Development Institute
12
A small proportion of informal firms (12 %) perceive no disadvantage arising from their status. Among the disadvantages, the two most commonly mentioned are: the risk of hav- ing to pay fines, mentioned by 68 % of the businesses, and the risk of having to pay bribes, identified by 36 % of the businesses. A second group of disadvantages has to do with lack of visibility: not being able to post a sign for their shop (29 %) or, more gener- ally, not being able to use publicity (18 %). Not having access to credit is also identified by 22 % of businesses as a disadvantage associated with not having an operating license.
A restricted market also falls in this category, as 11 % of informal businesses claim that they cannot do business with larger firms (11 %) or participate in public biddings (6 %).
Finally, only one out of twenty firms feels that not having access to government programs is a disadvantage associated with not having a license. Thus, government programs are not sufficiently attractive or accessible to prompt informal firms to formalise.
To sum up, generally speaking, one would say that the disadvantages identified by those firms that do not have a license mirror the advantages perceived by those that have a li- cense: risk/avoidance of fines, invisibility/visibility, no access/access to credit. Thus, the perceptions of both formal and informal firms tend to confirm one another as regards the advantages and disadvantages of their respective status.
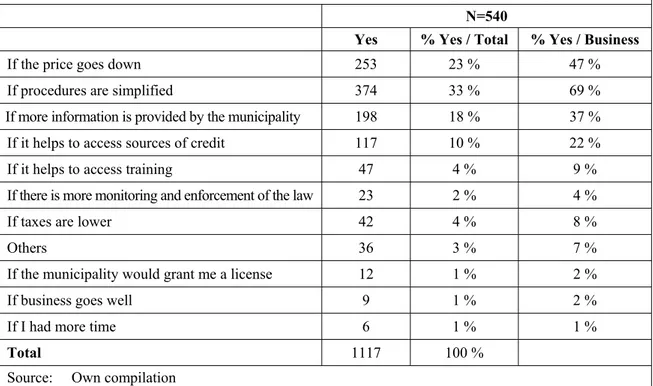
What does this evidence tell us about the demand for formality? First, it is quite clear that there are perceived costs and benefits from being formal / informal in regards to the operat- ing license and the fact that the perceptions of these costs and benefits vary from firm to firm. On balance, however, most firms see more benefits (advantages) than costs (disadvan- tages) of being formal. In effect, while about one-fifth of formal firms see no advantage to their status, almost two-thirds of informal firms see no advantage to theirs. Conversely, three out of five formal firms see no disadvantage to their status, while only one out of every eight informal firms sees no disadvantage to theirs. The question that naturally arises is, of course, why, then, is there so much informality? According to the entrepreneurs’views, which Table 7 below presents, the issues are still the administrative burden and money cost of formalising
Table 7: Circumstances under which firms would consider obtaining a license of operation
N=540 Yes % Yes / Total % Yes / Business
If the price goes down 253 23 % 47 %
If procedures are simplified 374 33 % 69 %
If more information is provided by the municipality 198 18 % 37 % If it helps to access sources of credit 117 10 % 22 %
If it helps to access training 47 4 % 9 %
If there is more monitoring and enforcement of the law 23 2 % 4 %
If taxes are lower 42 4 % 8 %
Others 36 3 % 7 %
If the municipality would grant me a license 12 1 % 2 %
If business goes well 9 1 % 2 %
If I had more time 6 1 % 1 %
Total 1117 100 %
Source: Own compilation
Is there demand for formality among informal firms? Evidence from microfirms in downtown Lima
German Development Institute 13
procedures, and lack of information. It is interesting to note that, contrary to De Soto’s (2000) predictions, only a small share of firms (one out of five) would be motivated by the fact that the license facilitates access to credit.
6 Are microfirms in downtown Lima really willing to formalise?
After the baseline survey was carried out, about one half of our sample of firms was se- lected to receive an encouragement to get the municipal operating license. The encour- agement consisted of paying for the cost of the license and providing guidance through the procedures with the municipality.14 Using the second round of data collection, we exploit the fact that not all firms encouraged took up the incentive to analyse factors associated with the demand for formalisation.
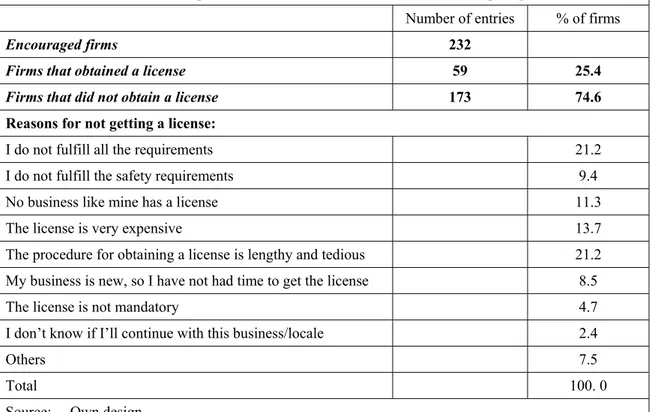
Table 8 summarizes the outcome of the encouragement process. About one out of four of those firms “encouraged” to get the license actually obtained it. Among those that did not obtain the license, close to one third (30.6 %, or 23 percent of the overall sample) were unable to get it because they did not comply with zoning standards or safety requirements (or both). This is an important finding because it indicates that business informality is linked with other types of informality and that promoting business formality by simplify- ing the procedure to obtain a license is insufficient. A more comprehensive focus is needed. The second important finding is that about half of the firms in the sample did not get the license even when they reportedly fulfilled the requirements and did not have pay for it. This indicates that a substantial portion of firms are at best indifferent between having
Table 8: Results of encouragement to formalise and reasons for not taking it up
Number of entries % of firms
Encouraged firms 232
Firms that obtained a license 59 25.4
Firms that did not obtain a license 173 74.6
Reasons for not getting a license:
I do not fulfill all the requirements 21.2
I do not fulfill the safety requirements 9.4
No business like mine has a license 11.3
The license is very expensive 13.7
The procedure for obtaining a license is lengthy and tedious 21.2 My business is new, so I have not had time to get the license 8.5
The license is not mandatory 4.7
I don’t know if I’ll continue with this business/locale 2.4
Others 7.5
Total 100. 0
Source: Own design
14 Initially the incentive was to pay for a portion of the license cost, but in the end the offer was raised to cover the whole cost.
Miguel Jaramillo
German Development Institute
14
or not having a license or, at worst, prefer not to have one. Among the reasons reported for this, burdensome and costly procedures are still the most frequent, even after the offer was made to cover the money costs. Also about one of every six firm owners that did not ob- tain the license claims either that the license is not mandatory or that it does not apply to his/her type of business, which suggests information problems.
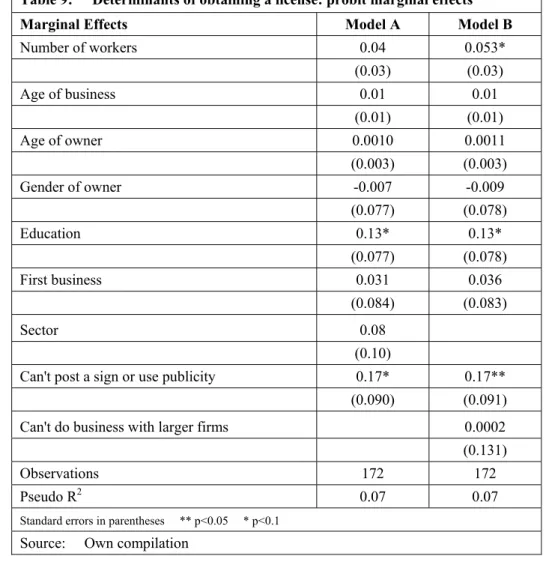
What factors may be affecting the decision to obtain/not to obtain a license? The data col- lected, though limited in size, makes it possible to explore this question. Excluding from the sample those firms that were unable to get the license because they did not fulfil the requirements, we compare firms that formalised with those that did not. To do this, we ran a probit model in which the dependent variable can take one of two values, according to whether or not the firm obtained a license. Explanatory variables include features of the firm and the firm owner, including stated disadvantages of not having a license. Table 9 presents the results from two different specifications, controlling and not controlling for firm sector. In controlling for firm sector, two variables predict formalisation: the fact that the firm owner has post-secondary education and the perception that not having license limits the visibility of the firm. Without controlling for sector, the results persist, but, in addition, number of workers becomes significant as well. Each additional worker in- creases the chances of getting a license by 5.3 percentage points. Likewise, the owner’s having post secondary education increases the chances by 13 percentage points, while the owner’s perception that not having a license limits the visibility of her or his firm in- creases the chances of getting a license by 17 points.
Table 9: Determinants of obtaining a license: probit marginal effects Marginal Effects Model A Model B
Number of workers 0.04 0.053*
(0.03) (0.03)
Age of business 0.01 0.01
(0.01) (0.01)
Age of owner 0.0010 0.0011
(0.003) (0.003)
Gender of owner -0.007 -0.009
(0.077) (0.078)
Education 0.13* 0.13*
(0.077) (0.078)
First business 0.031 0.036
(0.084) (0.083)
Sector 0.08
(0.10)
Can't post a sign or use publicity 0.17* 0.17**
(0.090) (0.091)
Can't do business with larger firms 0.0002
(0.131)
Observations 172 172
Pseudo R2 0.07 0.07
Standard errors in parentheses ** p<0.05 * p<0.1
Source: Own compilation
Is there demand for formality among informal firms? Evidence from microfirms in downtown Lima
German Development Institute 15
7 Conclusions and policy implications
Our results suggest a paradox: most firms see more benefits (advantages) than costs (dis- advantages) in being formal, yet about half of firms do not get their licenses when the as- sociated money cost is substantially reduced.15 In effect, while just about one-fifth of for- mal firms see no advantage to their status, as many as two-thirds of informal firms see no advantage to theirs. Conversely, three out of five formal firms see no disadvantage to their status while only one out of every eight informal firms sees no disadvantage to theirs.
However, confronted with the opportunity to obtain the license without any payment in- volved, most informal firms prefer not to obtain it. Hence, the results of our experiment suggest that for some firms formalisation is not desirable at any cost.
A first reason for the reluctance to register may be associated with the recurrent costs of being formal.16 As shown above, receiving inspections is the most frequently identified disadvantage (or cost) of being formal, ranking above taxes. Making sure that inspections do not constitute an unnecessary burden on the firms is an area where municipalities can work to make formality more attractive to them. Second, it may also be the case that some firms do not perceive much benefit from being formal. As the regression results indicate, most currently assumed potential advantages of having a license, such as doing business with larger firms, participating in public biddings, or getting access to credit, do not corre- late significantly with obtaining the license. Only the perception of the firm owner that without a license he or she cannot use publicity to increase the visibility of his/her firm is positively correlated with obtaining the license.
Third, it may be that microfirm owners are understating the actual benefits of informality, because they feel uncomfortable about admitting benefits from an illegal status. Finally, it is important to note that about one out of every four informal firms did not fulfil the re- quirements to obtain a license. In one third of these cases firms did not meet safety re- quirements, which can range from inadequate electricity connections all the way to ruin- ous buildings. In other cases, property titling problems or irregular subdivisions of real state property make it impossible for businesses to obtain a license. The point that this type of evidence suggests is that promotion of business formalisation in terms of getting a license cannot generally be done separately from other types of informality.
As predicted by the literature, the demand for formality is heterogeneous among informal microbusinesses in Lima’s Cercado. In addition to the potential gains of greater visibility mentioned above, the only two other factors that correlate significantly with obtaining a license are the owner’s having post-secondary education and size of firm. It should be noted, however, that there may be statistical problems because of the reduced size of the sample. Nonetheless, results from difference-in-means tests do not indicate any significant differences between firms that obtained and did not obtain the license in terms of other features of the firm or the owner. The only exception is the age of the business: firms that had a license are older (4.1 years-old on average) than those that did not (2.3 years-old).
15 One may argue that even if the price of acquiring the license was reduced to zero, there are other costs associated with obtaining the license: collecting the required documents, going to the offices of the mu- nicipality, waiting in line, etc.
16 Jaramillo (2004) and Arruñada (2007) have suggested that recurrent costs associated with formality may be more important than initial registration costs.
Miguel Jaramillo
German Development Institute
16
Once other features of the firm have been controlled for, as done in the regression analysis this effect disappears, however.
It is difficult to identify what type of firms are likely to formalise without looking at their performance over time or their opportunity costs as wage earners. However, one may clas- sify the sample of microfirms in three groups. In the first group are those firms that ob- tained the license. The owners of these firms are better educated on average and show a desire for greater visibility for their businesses. Obtaining their licenses creates important preconditions for firm upgrading and growth, and it may be taken as an indicator that at least some of these owners qualify as ‘opportunity entrepreneurs’. The second group con- sists of those firms that did not get the license because of zoning standards or safety re- quirements (or both). One may be inclined to think of this group largely as necessity en- trepreneurs, though some of them may be experimenting with an activity whose future returns they are not certain about. In the third group are those that, meeting the basic re- quirements for obtaining the license, chose not to pursue it. This is the largest group, two fifths of those encouraged, and one where ‘opportunity entrepreneurs’ would be largely absent. Our evidence suggests that for these firms, at least at this stage of their develop- ment, the benefits of having a license / being formal exceed its costs.
Is there demand for formality among informal firms? Evidence from microfirms in downtown Lima
German Development Institute 17
Bibliography
Alcázar, L. / R. Andrade / M. Jaramillo (2007): Panel/tracer study on the impact of business facilitation processes on enterprises in Lima: report on the methodological design, Lima: Grupo de Análisis para el Desarollo (GRADE)
Altenburg, T. / C. Drachenfels, von (2006): The ‘New Minimalist Approach’ to private-sector development:
a critical assessment, in: Development Policy Review 24 (4), 387–411
Arruñada, B. (2007): Pitfalls to avoid when measuring institutions: is Doing Business damaging business?
in: Journal of Comparative Economics 35 (4), 729−747
Carr, M. / M. Chen (2004): Globalization, social exclusion and work: with special reference to informal employment and gender, Geneva: International Labour Organization (Working Paper 20)
Chen, M. et al. (2005): Women, work and poverty, in: Progress of the world’s women 2005: women, work and poverty, New York: United Nations Development Fund for Women
De Mel, S. / D. McKenzie / C. Woodruff (2008): Who are the microenterprise owners?: evidence from Sri Lanka on Tokman v. de Soto: paper presented at the International Differences in Entrepreneurship Con- ference of the National Bureau of Economic Research (NBER), 1−2 February 2008, Savannah, Ga.
De Soto, H. (1986): El otro sendero: La revolución informal, Lima: El Barranco
De Soto, H. (2000): The mystery of capital: why capitalism triumphs in the west and fails everywhere else, New York: Basic Books
Djankov, S. et al. (2002): The regulation of entry, in: Quarterly Journal of Economics 117 (1), 1–37 Fields, G. (2005): A guide to multisector labor market models, Washington, DC: World Bank. (Social Pro-
tection Discussion Paper Series 0505)
Harris, J. / M. Todaro (1970): Migration unemployment: a two sector analysis, in: American Economic Re- view 60 (1), 126−142
INEI (Instituto Nacional de Estadística e Informática) (2006): Encuesta Nacional de Hogares sobre Condi- ciones de Vida en el Perú, Lima
Jaramillo, M. (2004): Transaction costs in Peru: How much does it cost to start a garment firm in Lima?
Lima: Grupo de Análisis para el Desarollo (GRADE), mimeo
Jaramillo, M. / K. Lopez (2006): ¿Cómo se ajusta el mercado de trabajo ante cambios en el salario mínimo en el Perú? Una evaluación de la experiencia de la última década. Lima: Grupo de Análisis para el De- sarollo (GRADE) (documento de trabajo 50)
Kaplan, D. / E. Piedra / E. Seira (2006): Are burdensome registration procedures an important barrier on firm creation? Evidence from Mexico, Standford, Calif.: Stanford Institute for Economic Policy Re- search (SIEPR Discussion Paper 06−013)
Klapper, L. / L. Laeven / R. Rajan (2006): Entry regulation as a barrier to entrepreneurship, in: Journal of Financial Economics 82 (3), 591–629
Lewis, W. A. (1954): Economic development with unlimited supplies of labour, in: Manchester School 22 (2), 139−191
Loayza, N. / A. M. Oviedo / L. Servén (2005): The impact of regulation on growth and informality: cross- country evidence, Washington, DC: World Bank. (World Bank Policy Research Working Paper 3623) Maloney, W. (2004): Informality revisited, in: World Development 32 (7), 1159–1178
Nelson, E. / E. De Bruijn (2005): The voluntary formalization of enterprises in a developing economy – the case of Tanzania, in: Journal of International Development 17 (4), 575–593
Schneider, F. (2007): The size of the shadow economies of 145 countries all over the world: first results over the period 1999 to 2003, in: Journal of Population Economics 20 (3), 495–526
Schneider, F. / D. Enste (2000): Shadow economies around the world – size, causes and consequences, Washington, DC: International Monetary Fund (IMF Working Papers 00/26)
Tokman, V. E. (2007): Modernizing the informal sector, New York: United Nations, Department of Eco- nomic and Social Affairs (DESA Working Paper 42)
Miguel Jaramillo
German Development Institute
18
Van Stel, A. / J. Storey / A. R. Thurik (2007): The effect of business regulations on nascent and young business entrepreneurship, in: Small Business Economics 28 (2−3), 171−186
Woodruff (2007): Self-employment: engine of growth or self-help safety net? in: P. Paci / P. Serneels (eds.), Employment and shared growth: rethinking the role of labor mobility for development, Washington, DC: World Bank
World Bank / International Finance Corporation (2003): Doing Business in 2004: understanding regulation.
Washington, DC: World Bank
World Bank / IFC (International Finance Corporation) (2004): Doing Business in 2005: removing obstacles to growth, Washington, DC: World Bank
World Bank / IFC (International Finance Corporation) (2005): Doing Business in 2006: creating jobs, Wash- ington, DC: World Bank
World Bank / IFC (International Finance Corporation) (2006): Doing Business in 2007: how to reform, Washington, DC: World Bank
World Bank / IFC (International Finance Corporation) (2007): Doing Business 2008, Washington, DC:
World Bank
World Bank / IFC (International Finance Corporation) (2008): Doing Business 2009, Washington, DC:
World Bank
Yamada, G. (1996): Urban informal employment and self-employment in developing countries: theory and evidence, Chicago, Ill.: The University of Chicago Press
Annex
Is there demand for formality among informal firms? Evidence from microfirms in downtown Lima
German Development Institute 21
Table A1: Metropolitan Lima: educational levels among 25−65 year-olds (2006) Metropolitan Lima Educational level
Men Women Total
No formal education 0.41 % 2.32 % 1.40 %
Incomplete elementary school 3.79 % 6.99 % 5.45 %
Complete elementary school 6.55 % 8.83 % 7.74 %
Incomplete secondary education 13.05 % 11.76 % 12.38 % Complete secondary education 37.40 % 34.54 % 35.91 % Incomplete non-university tertiary education 6.40 % 6.30 % 6.35 % Complete non-university tertiary education 10.32 % 10.82 % 10.58 % Incomplete university education 8.76 % 5.79 % 7.22 % Complete university education 11.43 % 11.48 % 11.45 %
Post-degree education 1.89 % 1.18 % 1.52 %
Source: INEI 2006, elaborated by author