Markus Pock Thomas Czypionka Miriam Reiss Gerald Röhrling
Economic burden of chronic respiratory diseases in Austria and Slovenia
Results of a life-cycle model
Research Report
Institut für Höhere Studien (IHS), Wien Institute for Advanced Studies, Vienna
Economic burden of chronic respiratory diseases in Austria and Slovenia
Results of a life-cycle model
Markus Pock Thomas Czypionka Miriam Reiss Gerald Röhrling
Final report
A study commissioned by GSK - GlaxoSmithKline Pharma GmbH
In collaboration with:
VI vis d.o.o., Slovenia
Scientific Advisory Boards of Austria and Slovenia
April 2018
Contact:
Thomas Czypionka
: +43/1/599 91-127 email: czypionka@ihs.ac.at Markus Pock
: +43/1/599 91-210
email: pock@ihs.ac.at
Contents
Executive summary I
1. Introduction 1
2. Background information on chronic respiratory diseases 2
2.1. COPD ... 2
2.2. Asthma ... 5
3. Epidemiology of chronic respiratory diseases 6 3.1. Considerations on methodology in epidemiological studies on chronic respiratory disease ... 6
3.2. International epidemiological data on chronic respiratory diseases ... 8
3.2.1. COPD ... 8
3.2.2. Asthma ... 13
3.3. Epidemiological data on chronic respiratory diseases in Austria ... 18
3.3.1. COPD ... 18
3.3.2. Asthma ... 22
3.4. Epidemiological data on chronic respiratory diseases in Slovenia ... 24
3.4.1. COPD ... 24
3.4.2. Asthma ... 29
4. Cost categories 34 5. International evidence on the economic burden of chronic respiratory diseases 36 5.1. COPD ... 37
5.2. Asthma ... 39
6. Method 42 6.1. Introduction ... 42
6.2. The life-cycle model ... 42
6.3. Methods specific to individual cost categories ... 50
6.3.1. Direct medical costs ... 50
6.3.2. Direct non-medical costs ... 51
6.3.3. Indirect costs ... 57
7.2.2. Direct medical costs ... 64
7.2.3. Direct non-medical costs ... 71
7.2.4. Indirect costs ... 74
7.3. Data sources for Slovenia ... 75
7.3.1. Key variables ... 75
7.3.2. Direct medical costs ... 77
7.3.3. Direct non-medical costs ... 84
7.3.4. Indirect costs ... 87
8. Results 89 8.1. Economic burden of chronic respiratory diseases in Austria ... 90
8.2. Economic burden of COPD and asthma in Slovenia... 94
9. Sensitivity analysis 100
References 106
Appendix Austria 113
Appendix Slovenia 121
Abbreviations
AMS Austrian Public Employment Service (Arbeitsmarktservice) ATHIS Austrian Health Interview Survey
AUVA Austrian Workers’ Compensation Board (Allgemeine Unfallversicherungsanstalt)
AN annuity
ATC Anatomical Therapeutic Chemical Classification System
BMASK Austrian Federal Ministry of Labour, Social Affairs and Consumer Protection (Bundesministerium für Arbeit, Soziales und
Konsumentenschutz)
BoD burden of disease
BOLD Burden of Obstructive Lung Disease
CBZ Slovenian Central Data-base of Medicines (Centralna baza zdravil)
CEA cost-effectiveness analysis
CoI cost of illness
COPD chronic obstructive pulmonary disease CPAP continuous positive airway pressure CRD chronic respiratory disease
DRG diagnosis related groups
EHIS European Health Interview Survey FEV
1forced expiratory volume in one second
FVC forced vital capacity
GDP gross domestic product
GOLD Global Initiative for Chronic Obstructive Lung Disease
HC healthcare functions in SHA
HP healthcare providers in SHA
HV Main Association of Austrian Social Security Institutions
(Hauptverband der österreichischen Sozialversicherungsträger) ICD International Statistical Classification of Diseases and Related
Health Problems
javno zdravje)
OECD Organisation for Economic Co-operation and Development,
OÖGKK regional health insurance fund of Upper Austria (Oberösterreichische Gebietskrankenkasse)
PAF population attributable fraction PVFE present value of future earnings
PRIKRAF Austrian Private Hospitals Financing Fund (Privatkrankenanstaltenfinanzierungsfonds)
PV present value
SHA System of Health Accounts
SURS Statistical Office of Republic of Slovenia (Statistični urad Republike Slovenije)
WHO World Health Organisation
ZPIZ Pension and Disability Insurance Institute of Slovenia (Zavod za pokojninsko in invalidsko zavarovanje Slovenije)
YPLL years of potential life lost
ZZZS Health Insurance Institute of Slovenia (Zavod za zdravstveno
zavarovanje Slovenije)
Tables
Table 1: Chronic lower respiratory diseases according to the ICD-10 classification ... 2
Table 2: GOLD classification of severity of airflow limitation in COPD (based on post- bronchodilator FEV
1) ... 3
Table 3: Number of patients with COPD registered in the offices of primary care physicians in Slovenia in 1997-2001 ... 25
Table 4: Number of deaths due to COPD in Slovenia according to Debeljak (2003) ... 29
Table 5: Cost categories used in the cost-of-illness study ... 35
Table 6: Annual costs of COPD in the Netherlands according to van Boven et al. (2013), population aged 45-64, 2009 ... 37
Table 7: Annual costs of COPD per patient by disease severity in Germany according to Nowak et al. (2004), population aged ≥40 years, 2001 ... 38
Table 8: Annual costs of asthma in the UK according to Mukherjee et al. (2016), financial year 2011-2012 ... 40
Table 9: Annual costs of asthma in Germany according to Stock et al. (2005), 1999 ... 40
Table 10: Four costs models split by time horizon and type of reference value, explained on the basis of invalidity pensions... 45
Table 11: Cost factors in curative and rehabilitative care from System of Health Accounts (SHA) in million EUR, 2014 ... 66
Table 12: Costs of hospital care in Slovenia (million EUR) ... 79
Table 13: Number of visits to outpatient physicians in Slovenia in thousands, 2014 ... 81
Table 14: Cost of outpatient care in Slovenia in million EUR, 2014 ... 81
Table 15: Value and volume split of R03 drugs used for COPD and asthma in Slovenia ... 83
Table 16: Number of disability pension beneficiaries and pay-outs in million EUR in Slovenia, 2014 ... 85
Table 17: Number of old-age pension beneficiaries and pay-outs in million EUR in Slovenia, 2014 ... 85
Table 18: Number of widow/family beneficiaries and pay-outs in million EUR in Slovenia, 2014 ... 86
Table 19: Number of disability and assistance allowances beneficiaries and pay-outs in million EUR in Slovenia, 2014 ... 86
Table 20: Active population of working age in Slovenia ... 87
Table 21: Estimated total labour costs in Slovenia ... 87
Table 22: Costs of chronic respiratory disease (CRD) in Austria according to one-period model and life-cycle model, 2014 ... 90
Table 23: Costs of COPD and asthma in Slovenia according to one-period model and life- cycle model, 2014 ... 95
Table 24: Results of the sensitivity analysis of the Austrian life-cycle model ... 100
in 2014, by gender and age ... 115
Table 27: Estimated life expectancy gains in months without COPD and asthma of the
Slovenian population in 2014, by gender and age ... 123
Figures
Figure 1: GOLD classification based on symptoms, breathlessness, spirometric classification
and risk of exacerbations ... 4
Figure 2: Prevalence of airflow obstruction (FEV
1/FVC < LLN) in selected sites of the BOLD
study by sex, population ≥ 40 years ... 9
Figure 3: Prevalence of COPD from Continuing to Confront COPD International Patient
Survey 2012/2013 by sex, population ≥ 40 years ... 10
Figure 4: Prevalence of chronic respiratory diseases (excl. asthma) from European Health
Interview Survey (EHIS) 2014 by sex, population ≥15 years ... 12
Figure 5: Prevalence of asthma according to different definitions among children aged 13-14
years in EU countries from ISAAC study ... 14
Figure 6: Prevalence of asthma according to different definitions in EU countries from WHO
World Health Survey 2002-2003, population 18-45 years ... 16
Figure 7: Prevalence of asthma from European Health Interview Survey (EHIS) 2014 by sex,
population ≥15 years ... 17
Figure 8: Prevalence of COPD according to different definitions from BOLD study by sex and
age group, 2004/2005 ... 19
Figure 9: Prevalence of chronic respiratory diseases (excl. asthma) from Austrian Health
Interview Survey (ATHIS) 2014 by sex and age, percentage per age group and moving
average (MA) ... 20
Figure 10: Prevalence of measured lung dysfunction compared to doctor diagnosed COPD
from Austrian LEAD Study by age groups, 2012-2016 ... 21
Figure 11: Deaths caused by chronic respiratory diseases (CRD, J40-J47) in % of all deaths
in Austria, decomposed into COPD (J44) and CRD other than COPD (J40-J43, J45-J47),
2014 ... 22
Figure 12: Prevalence of asthma according to different definitions among children aged 6-7
years and 13-14 years in Austria from ISAAC study, 2002/2003 ... 23
Figure 13: Prevalence of asthma from Austrian Health Interview Survey (ATHIS) 2014 by sex
and age, percentage per age group and moving average (MA) ... 24
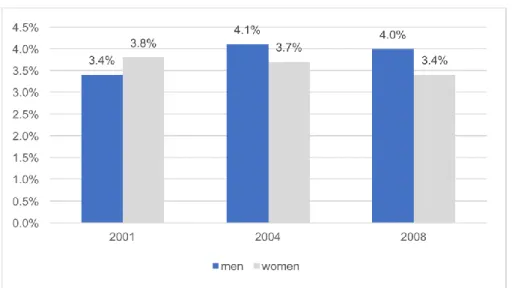
Figure 14: Self-reported COPD, chronic bronchitis and emphysema prevalence in the
Slovenian population of 25-64 years old by gender, CINDI, Health Monitor 2001-2004-2008
... 26
Figure 15: Self-reported COPD, chronic bronchitis and emphysema prevalence in the
Slovenian population of 25-64 years old by age groups, CINDI, Health Monitor 2001-2004-
2008 ... 26
Figure 16: Prevalence of COPD, chronic bronchitis and emphysema by gender and age,
Slovenian Chapter of EHIS 2014 ... 27
Figure 17: Number of patients with COPD, chronic bronchitis and emphysema by gender
and age, Slovenian Chapter of EHIS 2014 ... 28
Figure 18: Number of deaths due to COPD in Slovenia by gender and age in 2014 ... 28
Figure 21: Prevalence of asthma by gender and age, Slovenian Chapter of EHIS 2014 ... 32 Figure 22: Number of patients with asthma by gender and age, Slovenian Chapter of EHIS 2014 ... 32 Figure 23: Number of deaths due to asthma in Slovenia by gender and age in 2014 ... 33 Figure 24: Visual representation of approaches to measure direct medical costs ... 61 Figure 25: Decomposition of current expenditure on health excl. long-term care expenditure in Austria, 2014 ... 67 Figure 26: Total Health Care Expenditures in Slovenia by sources of funding in million EUR, 2014 ... 78 Figure 27: Total Health Care Expenditures in Slovenia by health care provider in million EUR, 2014 ... 78 Figure 28: ATC R03 drugs in Slovenia split between COPD and asthma ... 83 Figure 29: Annual average population pyramid in Austria in 2014 by gender and age ... 113 Figure 30: Share and number of deaths attributable to CRD, COPD and asthma in Austria in 2014 by age ... 114 Figure 31: Number of deaths attributable to COPD in Austria in 2014, by gender and age 114 Figure 32: Absolute gains in conditional 5x5 mortality probabilities attributable to CRD in Austria in 2014 by gender and age ... 115 Figure 33: Relative gains in conditional 5x5 mortality probabilities attributable to CRD in Austria by gender and age, in % ... 115 Figure 34: Relative gains in conditional 5x5 survival probability function S(t,a) attributable to CRD for males in Austria in 2014 by age, in % ... 116 Figure 35: Share of COPD, asthma and remainder of CRD in % of CRD group in Austria in 2014 with respect to hospital stays, hospital days and LKF points ... 116 Figure 36: Estimated per capita costs of hospitals (HC.1xHP.1) attributable to CRD (J40-J47) in Austria in 2014 by age and gender ... 117 Figure 37: Estimated annuities of hospital costs (HC.1xHP.1) attributable to CRD (J40-J47) in Austria in 2014 by age and gender ... 117 Figure 38: Estimated per capita costs of inpatient rehabilitative care provided by hospitals (HC.2.1xHP.1) attributable to CRD (J40-J47) in Austria in 2014 by age (males+females) .. 117 Figure 39: Estimated per capita costs of outpatient care provided by medical practices (HC.1.3.1xHP.3.1.1) attributable to CRD (J40-J47) in Austria in 2014 by age and gender.. 118 Figure 40: Per capita costs* of prescribed medicines ATC-Code R03 in Austria in 2014 by age and gender ... 118 Figure 41: Estimated new beneficiaries of care allowances attributable to CRD (J40-J47) in Austria in 2014 by age and gender ... 119 Figure 42: Estimates sick leave days attributable to CRD (J40-J47) in Austria in 2014 by
age and gender 119
Figure 43: Estimated costs of sick leave allowances attributable to CRD (J40-J47) paid by
social insurance institutions in Austria in 2014 by age and gender ... 119
Figure 44: Estimated new beneficiaries of invalidity pension attributable to CRD (J40-J47) in
Austria in 2014 by age and gender ... 120
Figure 45: Estimated annuities of old-age, widow/widower, and invalidity pensions
attributable to CRD (J40-J47) in Austria in 2014 by age ... 120
Figure 46: Estimated annuities of indirect costs (productivity costs) attributable to CRD (J40-
J47) in Austria in 2014 by age and gender ... 120
Figure 47: Population pyramid in Slovenia as of 01/07/2014 by gender and age ... 121
Figure 48: Share and number of deaths attributable to COPD and asthma in Slovenia in
2014 by age ... 121
Figure 49: Number of deaths attributable to COPD in Slovenia in 2014, by gender and age
... 122
Figure 50: Absolute gains in conditional 5x5 mortality probabilities of COPD and asthma in
Slovenia in 2014 by gender and age ... 122
Figure 51: Relative gains in conditional 5x5 mortality probabilities of COPD and asthma in
Slovenia in 2014 by gender and age ... 123
Figure 52: Relative gains in conditional 5x5 survival probability function S(t,a) of CRD for
males in Slovenia in 2014 by age, in % ... 124
Figure 53: Hospital care costs in Slovenia in 2014, base reference (EUR) ... 124
Figure 54: Hospital care costs in Slovenia in 2014, asthma and COPD (EUR) ... 125
Figure 55: Rehabilitation costs in rehabilitation centers in Slovenia in 2014, base reference
(EUR) ... 125
Figure 56: Rehabilitation costs in rehabilitation centers in Slovenia in 2014, asthma and
COPD (EUR) ... 126
Figure 57: Value of all prescribed medicines (all ATC groups) in Slovenia in 2014 ... 126
Figure 58: Value of medicines prescribed for asthma and COPD in Slovenia in 2014 ... 127
Figure 59: Value of medicines prescribed for asthma and COPD in Slovenia in 2014, by
gender ... 127
Figure 60: Value of allowances paid by ZZZS for sick leaves and nursing in Slovenia in 2014,
base reference (EUR) ... 128
Figure 61: Value of allowances paid by ZZZS for sick leaves and nursing in Slovenia in 2014,
asthma and COPD (EUR) ... 128
Figure 62: Estimated annuities of old-age and widow/widower pensions attributable to COPD
and asthma in Slovenia in 2014 by age ... 129
Figure 63: Estimated annuities of indirect costs (productivity costs) attributable to COPD and
asthma in Slovenia in 2014 by age and gender ... 129
Executive summary
The usual method for evaluating the financial burden of a particular disease is to isolate and figure out the public medical and non-medical costs of a particular reference year. The data for the implementation of such one-period models are either at an aggregated level or an individual level (patients’ records). The usual burden-of-disease models describe the realized costs of the morbidity effects of a particular disease in the status quo but do not consequently take into account the counter-factual effect of a reduced mortality translating into an increased longevity and hence into increased life span costs. Generally, the cost effects of morbidity and mortality are counter-running. Whether the overall effect will turn out to be positively valued depends on the relative dominance of morbidity gains, and vice versa.
In this study we tried to estimate the economic burden of chronic respiratory diseases CRD (ICD-10: J40-J47) in two European countries, namely Austria and Slovenia, in the year 2014. The two dominant CRD are COPD (J44) and asthma (J45-J46). For Slovenia we restricted the analysis to COPD and asthma.
We applied a life-cycle model (see chapter 6.2) in order to account for the longevity effects and the heterogeneity of age- and gender-specific distributions of the particular cost categories. In our variant of the life-cycle model, each cohort of the status quo population hypothetically lives to the end of life under improved morbidity and mortality conditions. The output of the life-cycle model gives present values of the cost effects of CRD over the whole time span of the age cohorts. The main scenario of the model assumed a discounting factor of 3%. In order to display these cost effects on an annual basis, we transformed the present values into equivalent constant cash flows over the time horizon, the so-called annuities.
For reasons of comparison we additionally calculated the usual one-period model ignoring mortality effects.
We estimated the following cost categories: direct medical, direct non-medical and indirect costs (see chapter 4). Because data on an individual level have not been available for the purpose of our study, we build up our data set from publicly accessible data sources.
In the case of the category direct medical costs we retrieved – whenever possible – the age- and gender-specific cost-profiles for each subcategory (i.e. health expenditures of hospitals, rehabilitation, medical practices, prescribed medicines, patient transportation, and therapeutic appliances). We applied a bottom-up approach and quantified the total medical costs by summing up over the subcategories.
The subcategories of the medical costs in Austria and Slovenia were built up by orientating
towards the System of Health Accounts (SHA). We recommend this classification of
medical costs in the frame-work of cost-benefit-analysis and cost-of-illness studies, because
it renders a better comparability of international results by looking at the ratio of the estimated costs to the standardized SHA category as reference base. We extrapolated wherever justifiable the primary data in order to meet the SHA values published by the national statistical offices, which are usually higher than the totals of the primary data. In case of Slovenia, we refrained from this procedure due to considerable differences between the primary data totals and the published costs of the corresponding SHA categories.
Instead, the reference base of each subcategory is taken from the total of the primary data (i.e. data categorised according to the system of health data collection established by the National Institute of Public Health in Slovenia), and, contrary to Austria, the base reference of the overall medical costs is the sum of the subcategories’ totals (EUR 1,438 million) and not the official total health expenditures in Slovenia according to SHA (EUR 2,265 million), explaining the considerable deviations between the two countries in relative terms.
We estimated the overall medical costs of CRD in Austria in terms of annuities at EUR 266.7 million or 0.9% of the current total health expenditures excluding long-term care, according to SHA (see Table 22, p.90). The per capita costs were quantified at EUR 31 and the per patient costs at EUR 365, assuming a prevalence rate of CRD of 8.6%.
The major subcategories of medical costs are hospitals, medical practices, and prescribed medicines. In terms of annuities, the costs of curative care provided by Austrian hospitals (HC.1 x HP.1) are negative in the base scenario and amount to EUR -4.5 million (or 0.0% of the corresponding base value), resulting from the dominating effect of improved longevity over the morbidity gains. In contrast, the costs of curative care provided by medical practices (HC.1.3.1. x HP.3.1.1 & HC.3.1.3 x HP.3.1.3) are estimated at EUR 40.4 million (or 1.3%). The one-period estimates are in both subcategories substantially higher stemming from the counter-running effects of improved mortality. In contrast, the life-cycle model estimated the costs of prescribed medicines (HC.5.1.1) at EUR 162.8 million (or 5.0%) being slightly above the one-period estimates (4.9% of the base value).
In Slovenia, the overall medical costs of COPD add up to EUR 13.6 million or EUR 160 per patient, and the costs of asthma to EUR 17.1 million or EUR 165 per patient. In total, costs of the two respiratory diseases were estimated at EUR 30.6 million or 2.2% of the base value (see Table 23, p.95) or EUR 15 per capita or EUR 163 per COPD/asthma- patient, assuming a prevalence rate of 9.1%.
The major subcategories of medical costs in Slovenia were quantified in terms of annuities at EUR 3.24 million (or 0.52% of the corresponding base value) for hospitals, EUR 1.80 million (or 0.63%) for medical practices, and EUR 24.98 million (or 5.78%) for prescribed medicines. The one-period results give 0.99%, 3.61%, and 4.93%, respectively.
The category direct non-medical costs comprises sick benefits, care allowances, and
invalidity pensions. In addition, we incorporated in our life-cycle model old-age and
widow/widower pensions. These cost items are at first glance unrelated to the disease under investigation. But the hypothetical extinction of a specific disease generates non-medical costs by increased longevity of a counter-factual population. These so-called unrelated future costs should be included from a theoretical point of view.
Due to data restrictions, care allowances and invalidity pensions were not included in the Slovenian part of the analysis.
Applying the life-cycle model, the overall non-medical costs of CRD were positive for Austria and negative for Slovenia, namely in terms of annuities EUR 3.5 million (or 0.01% of the reference base) and EUR -1.05 million (or 0.03%), respectively, because the old-age pension effects in Slovenia dominate the other cost items in this category. This means that without adapting the actual retirement age the increased longevity of the model’s population would burden the pension system with additional costs in Slovenia. For Austria, the net effects of the direct non-medical costs are marginally positive because the costs of invalidity pensions have been considered.
The category indirect costs represents the economic costs of productivity losses due to sick leaves, invalidity, and premature mortality of the working force. We implemented a life-cycle model of the human capital approach. Hence, the calculated costs are opportunity costs.
The economic costs of CRD in terms of annuities are quantified at EUR 237.9 million (or 0.07% of GDP) and EUR 4.7 million (or 0.012% of GDP) for Austria and Slovenia, respectively. The effects of invalidity are not included in the Slovenian model, because in Slovenia the official numbers of invalidity and care allowance beneficiaries with COPD and asthma are very small and their impact on the results are expected to be neglectable.
Summing up all cost categories, the burden of CRD in terms of annuities was estimated at EUR 508.1 million (or 0.15% of GDP) in Austria. This translates into per capita costs of EUR 59 or per CRD-patient costs of EUR 695.
Comparing with the one-period model, which ignores the mortality effects, we calculate the burden of CRD at EUR 643.6 (or 0.19% of GDP) and the per patient costs at EUR 881. We conclude that the mortality effects of CRD calculated by both methods are substantial for Austria.
The total costs of COPD and asthma in terms of annuities in Slovenia amount to EUR 15.2
million and EUR 19.0 million, respectively. This translates into EUR 179 per COPD-patient
and EUR 184 per asthma-patient. In total, the two diseases cause annual costs of EUR 34.2
million (or 0.09% of GDP) or EUR 17 per capita or EUR 182 per COPD/asthma-patient.
The one-period model for Slovenia similarly estimated the burden of COPD/asthma at EUR 35.7 (or 0.10% of GDP) and the per COPD/asthma-patient costs at EUR 189.
In contrast to Austria, the Slovenian outcomes of the life-cycle and the one-period model do not differ much in the case of the medical costs. The overall morbidity gains are more or less compensated by the mortality gains in the Slovenian life-cycle model. One reason for this is the lower relative mortality of COPD/asthma in 2014: approx. 2% of all deaths in Slovenia compared to 3.4% CRD-attributable deaths in Austria.
In summary, the chronic respiratory diseases, led by COPD, have a substantial impact on medical expenses in the investigated countries Austria and Slovenia. Especially the 5%
share of the CRD costs of prescribed medicines is a major cost component, whereas the
share of hospital costs is below 1% and these costs mainly accrue in elder age cohorts. It
seems that COPD and asthma in particular are diseases whose progression is successfully
stabilized by the out-patient care provided by medical practices and the therapeutic
administration of pharmaceuticals.
1. Introduction
Chronic respiratory diseases (CRD) are among the most widespread chronic diseases and causes of death. In 2015, CRD accounted for approx. 3.9 million deaths worldwide (WHO, 2016a). Two of the most common CRD are chronic obstructive pulmonary disease (COPD) and asthma. COPD is currently the fifth leading cause of death worldwide and is predicted to become the fourth leading cause of death by 2030 (Mathers and Loncar, 2006). Asthma is the most common chronic disease among children and also increases in prevalence (WHO, 2013). These developments pose a significant challenge to health systems worldwide.
In order to get a better understanding of the burden of disease, this study aims to analyse, quantify and compare monetary effects of chronic respiratory diseases with a focus on COPD and asthma for the year 2014. The analysis covers two Central European countries, namely Austria and Slovenia, and is the first of its kind for either of these two countries. The study goes beyond the perspective and methodical standards applied in international literature by conducting calculations within the framework of a life-cycle model. This is a more holistic approach compared to a one-period model which merely estimates cross- sectional morbidity costs of a disease. In contrast to a multi-period life-cycle model, the monetary effects of CRD are observed over the entire life-cycle of a specific age cohort or even a whole reference population, capturing lagged health effects of altered morbidity and in addition mortality.
The cost categories analysed are direct medical costs, direct non-medical costs and indirect costs. Medical as well as economic costs of CRD are added up with increased expenditures for old-age and surviving dependants pensions due to improved longevity. For the sake of comparability with previous international studies, figures from the one-period model are provided in addition, ignoring these unrelated future costs of pensions.
The report at hand is structured as follows. Section 2 provides medical background information on chronic respiratory diseases. In section 3, evidence regarding the epidemiology of CRD is presented. Section 4 describes the cost categories that are commonly investigated in studies on burden of disease and are used in this study as well. In section 5, existing international evidence on the economic burden of CRD is reviewed.
Section 6 provides information on the method applied, in particular the life-cycle model.
Section 7 describes the various data sources used for the study. In section 8, the results of
the analysis are presented for Austria and Slovenia. Section 9 discusses the results of a
performed non-probabilistic simulation analysis of the Austrian model.
2. Background information on chronic respiratory diseases
The WHO defines CRD as chronic diseases of the airways and other structures of the lungs.
A number of diseases can be categorised under the umbrella term of CRD. The focus of this study is on chronic lower respiratory diseases, which are listed in the ICD-10 (International Statistical Classification of Diseases and Related Health Problems, 10
thRevision) classification under the codes J40 to J47. The corresponding conditions can be found in Table 1.
Table 1: Chronic lower respiratory diseases according to the ICD-10 classification J40 Bronchitis, not specified as acute or chronic
J41 Simple and mucopurulent chronic bronchitis J42 Unspecified chronic bronchitis
J43 Emphysema
J44 Other chronic obstructive pulmonary disease J45 Asthma
J46 Status asthmaticus J47 Bronchiectasis Source: WHO (2016b)
The two most common among these conditions are COPD (J44) and asthma (J45-J46). A particular focus will therefore be placed on these two conditions in the course of the analysis.
In the following, background information on COPD and asthma is provided.
2.1. COPD
The Global Initiative for Chronic Obstructive Lung Disease (GOLD) defines COPD as follows:
“Chronic Obstructive Pulmonary Disease (COPD), a common preventable and treatable
disease, is characterized by persistent airflow limitation that is usually progressive and
associated with an enhanced chronic inflammatory response in the airways and the
lung to noxious particles or gases. Exacerbations and comorbidities contribute to the
overall severity in individual patients.” (GOLD, 2016: 2)
The best-studied and most important risk factor for COPD is cigarette smoking. Further risk factors include exposure to particles other than cigarette smoke (e.g. occupational exposures, other types of tobacco, severe air pollution), genetic predisposition and poor lung growth. Chronic inflammation of the respiratory tract in response to exposure to noxious particles or gases may cause pathologic changes: emphysema, as a result of destruction of parenchymal tissue, as well as small airway fibrosis, as a result of disruption of normal repair and defence mechanisms. Together, these lead to air trapping and progressive airflow limitation, causing breathlessness and other symptoms characteristic to COPD. (GOLD, 2016: 4 ff.)
The disease can be classified by several degrees of severity. For this purpose, the GOLD Initiative developed a classification based on post-bronchodilator spirometry (see Table 2). It divides airflow limitation into four stages. This classification, which is often referred to as GOLD I-IV, has been widely used in epidemiological literature. An alternative classification, which is similar to GOLD I-IV, is the lower-limit-of-normal (LLN) definition. Instead of a fixed unique value, age-dependent cut-off values below the lower fifth percentile of the FEV
1/FVC ratio are derived from the general population. While the GOLD criteria tend to over-diagnose COPD, definition via LLN tends to lead to under-diagnosis (Güder et al., 2012).
Table 2: GOLD classification of severity of airflow limitation in COPD (based on post- bronchodilator FEV
1)
In patients with FEV
1/FVC < 70%:
GOLD I Mild FEV
1≥ 80% predicted
GOLD II Moderate 50% ≤ FEV
1< 80% predicted GOLD III Severe 30% ≤ FEV
1< 50% predicted GOLD IV Very severe FEV
1< 30% predicted Notes: FEV
1= forced expiratory volume in one second
FVC = forced vital capacity Source: GOLD (2016: 14)
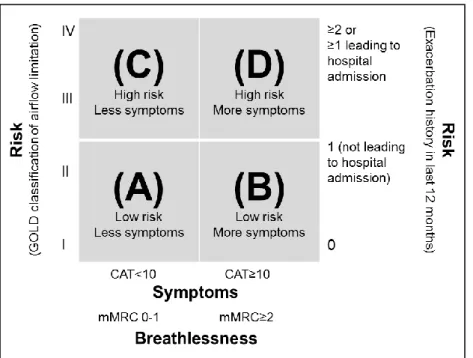
However, based on the insight that forced expiratory volume, symptoms of the disease and
impairment of health-related quality of life are only weakly correlated, an alternative
classification was recently developed by the GOLD Initiative (see Figure 1). The new
classification, which is often referred to as GOLD A-B-C-D, allows for measuring risk either
by spirometry results or exacerbation history, and combines this with the patient’s
symptomatic assessment.
Figure 1: GOLD classification based on symptoms, breathlessness, spirometric classification and risk of exacerbations
Notes: CAT = COPD Assessment Test
mMRC = Medical Research Council Dyspnea Scale Source: GOLD (2016: 15)
A noteworthy publication in the context of COPD is the report of the European COPD Audit by the European Respiratory Society (ERS, 2012). The COPD Audit was a cross-sectional, multi-centre study covering 13 European countries, including Austria (but not Slovenia). It collected data about care provision for COPD in hospitals, as well as clinical data on the process of care and outcomes for COPD patients admitted to hospital with an exacerbation.
The report includes data on, e.g., equipment of hospitals, organisation of care, length of stay, mortality, readmission, smoking history of COPD patients, comorbidities and the general health state of COPD patients. Several conclusions could be drawn from the audit, e.g. that there is considerable variation in COPD-related equipment and treatment of COPD in hospitals, as well as treatment and rehabilitation options after discharge across Europe.
Length of stay ranged from 5 to 14 days with a median of 8 days. A high proportion of admitted patients were current smokers, and the most common comorbidities were cardiovascular diseases and diabetes. 5% of COPD patients died in hospital, a further 6% in the 90 days after discharge and 35% of survivors were readmitted within this period.
In Austria, 49 hospitals and 823 patients participated in the audit. Hospital mortality of COPD patients was found to be below the European average (4.1%) and 90-day mortality approx.
equal to the European average (6.1%). The readmission rate, however, was found to be
relatively high at 39.7%. Median length of stay was 9 days. The availability of rehabilitation
and early/supported discharge programmes is relatively low in Austria when compared to the other countries included in the audit.
2.2. Asthma
The WHO defines asthma as follows:
“Asthma attacks all age groups but often starts in childhood. It is a disease characterized by recurrent attacks of breathlessness and wheezing, which vary in severity and frequency from person to person. In an individual, they may occur from hour to hour and day to day. This condition is due to inflammation of the air passages in the lungs and affects the sensitivity of the nerve endings in the airways so they become easily irritated. In an attack, the lining of the passages swell causing the airways to narrow and reducing the flow of air in and out of the lungs.” (WHO, n.d.)
Both genetic and non-genetic factors affect development and symptoms of asthma. In this context, it is important to distinguish between the underlying causes of the disease and the triggers of attacks. The underlying causes are not yet fully understood, but genetic predisposition, allergy and certain environmental factors are agreed to play a role in the development of asthma. Common triggers of asthma attacks are, however, well-studied and widely recognised. They include upper respiratory tract infections, physical exercise, inhalation of allergens (e.g. dust mites, animal dander, pollens, moulds) or other irritants (e.g.
cigarette smoke, fumes) and certain medications. (Global Asthma Network, 2014: 39 ff.)
3. Epidemiology of chronic respiratory diseases
In the following, epidemiological data for COPD and asthma are presented. A subsection containing methodological considerations is followed by further subsections on international evidence and evidence from Austria and Slovenia, respectively.
3.1. Considerations on methodology in epidemiological studies on chronic respiratory disease
A large number of studies have been carried out internationally to determine the prevalence of COPD and asthma. However, these vary widely with regard to data sources, definitions, prevalence measures and observed populations.
The most commonly used data sources are
(1) data from medical examinations, in particular spirometric data, (2) medical records and
(3) survey data.
Data from medical examinations are in general reliable, but are in case of COPD often based on spirometry only. As mentioned above, airflow limitation alone is not regarded a sufficient indicator for COPD anymore. Survey data take into account the respondents’ own perspective, but are reliable only to a limited extent. Limited knowledge and awareness with respect to COPD among patients – and possibly also among the physicians treating them – may lead to underreporting in surveys, resulting in prevalence rates that are too low. For asthma, a common problem with survey data is stigma associated with the disease, also possibly leading to underreporting. Furthermore, Torén et al. (2006) found that survey respondents with mild asthma were less likely to report their disease at all.
Medical records rely on the accuracy of diagnostics. Evidence from several countries,
however, suggests that especially COPD diagnoses may be subject to misclassification and
underestimation. Evidence in this regard has not only been found with respect to medical
records, but also for mortality statistics. Romanelli et al. (2016) investigated the reliability of
COPD prevalence in several administrative databases in Italy (hospital discharge register,
clinical charts, cause-specific mortality register). According to their analysis, 17% of COPD
cases were misclassified. A similar study was conducted by Thomsen et al. (2011) in
Denmark, who investigated COPD diagnoses in the Danish National Patient Registry. They
found a positive predictive value for COPD of 92%, i.e, 92% of registered COPD diagnoses
were confirmed after review. The negative predictive value of COPD among patients coded
with pneumonia or respiratory failure but not COPD was found to be 81%, i.e. 19% of these
patients also had COPD. Johansson et al. (2009) compared death certificates and hospital discharge diagnostic data in Sweden and found a particularly large discrepancy for COPD.
Potential reasons for misclassification and underestimation of COPD are that acute events might be prioritised over chronic conditions in hospital records or mortality statistics (and COPD therefore only recorded as a secondary diagnosis), as well as the difficulty in distinguishing COPD from other (chronic) respiratory diseases.
Definitions of COPD and asthma in epidemiological studies are most commonly based on (1) definition based on medical examination (COPD: GOLD I-IV/LLN/GOLD A-B-C-D), (2) previous physician diagnosis,
(3) symptoms or
(4) combinations of the above.
Again, definition of COPD based solely on spirometry is generally regarded too narrow. The accuracy of physician diagnosis as an indicator for COPD or asthma depends on the physician’s knowledge and, if asked in the course of a survey, on the patient’s awareness and memory. Determining CRD prevalence on the basis of symptoms asked in a questionnaire might be insufficiently accurate, as symptoms could also be caused by respiratory conditions other than COPD or asthma. Some studies use combinations of the above criteria, most commonly medical examination together with a questionnaire on symptoms. Furthermore, some questionnaires simply include questions like Do you have/Have you ever had COPD/asthma? and do therefore not use a specific defining criterion. Another aspect to be taken into account in the context of definitions is the degree of disease severity used as a cut-off point (e.g. GOLD I or GOLD II for COPD).
Prevalence measures generally used in epidemiological literature are (1) point prevalence,
(2) period prevalence (most commonly 12-month prevalence) and (3) lifetime prevalence.
Point prevalence measures the proportion of a population suffering from a condition at a certain point in time. In most cases, this refers to the time of data collection, i.e. the time of a medical examination or a survey (e.g. Do you currently have COPD/asthma?). Period prevalence measures the proportion of a population suffering from a condition in a defined period of time. A commonly used period is the 12 months preceding a survey (e.g. Have you had COPD/asthma over the past 12 months?). Lifetime prevalence measures the proportion of a population who have suffered from a condition at least once over their lifespan (e.g.
Have you ever had COPD/asthma?).
Epidemiological studies can also be distinguished by which populations they observe. In the case of studies on COPD prevalence, common target populations are
(1) certain age groups (COPD: commonly elderly persons; asthma: commonly children), (2) COPD: (former) smokers or non-smokers and
(3) populations of certain geographical regions.
Since COPD predominantly occurs in elderly populations, epidemiological studies often restrict their target population by age, e.g. only observe persons over the age of 40.
Similarly, epidemiological studies on asthma often exclusively target children. Some studies investigate the prevalence of COPD in (former) smokers, or alternatively in non-smokers, due to the close link between smoking and COPD. Furthermore, some studies on COPD or asthma focus on populations of certain cities or regions, e.g. urban areas with high levels of air pollution. In international comparisons based on survey data, it should also be considered that specific diseases may be underdiagnosed in some countries compared to others.
When considering epidemiological data obtained from different studies, it is necessary to take into account the variations listed above. Different definitions and methodologies might be suitable for different research purposes, and results might therefore not be entirely comparable.
3.2. International epidemiological data on chronic respiratory diseases
3.2.1. COPD Prevalence
A particularly comprehensive international epidemiological study in the context of COPD is the BOLD (Burden of Obstructive Lung Disease) study. The BOLD initiative collects country-specific data on prevalence, risk factors and social and economic burden of COPD based on standardised methods. In addition, its aims include assessing the appropriateness of care provided, facilitating future longitudinal studies and making standardised methods available also to low and middle income countries.
1Prevalence rates of COPD collected in the course of the BOLD study are point prevalence rates based on spirometry and pertain to the population aged 40 years and older. Burney et al. (2014) give a global overview of results from various BOLD sites, using the LLN for age and sex as the defining criterion for COPD (see Figure 2 for selected sites).
1
See http://www.boldstudy.org/sop.html.
While the COPD prevalence among Austrian men (13.4%) lies around the average, Austrian women exhibit the highest rate of all BOLD sites in Western countries (20.7%). No data from Slovenia are available within the BOLD framework. In general, there is a high degree of variation in the epidemiological data, with prevalence rates ranging from around 5% to around 20% in the selected Western countries. In four sites (Austria, USA, Iceland, Australia), prevalence is higher for women than for men. In the remaining sites, men have higher rates. In view of the strong causality between smoking and COPD, and the higher smoking prevalence rates of men throughout the majority of countries, higher female COPD prevalence rates of the BOLD study should be taken with caution. One explanation for that phenomenon could be gender-specific over- and underreporting in some countries.
Figure 2: Prevalence of airflow obstruction (FEV
1/FVC < LLN) in selected sites of the BOLD study by sex, population ≥ 40 years
Notes: sites and dates of fieldwork in brackets
FEV
1= forced expiratory volume in one second FVC = forced vital capacity
LLN = lower limit of normal for age and sex
Source: Burney et al. (2014: 467), illustration by IHS (2018)
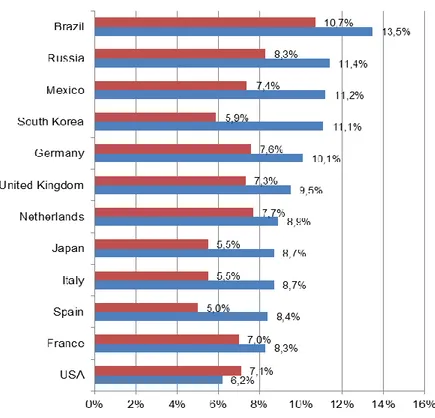
Results of the Continuing to Confront survey are presented by Landis et al. (2014) (see
Figure 3). Austria and Slovenia are not included in the survey. Except for the USA,
prevalence rates in all countries are higher for men than for women. Prevalence rates for
men range from 6.2% in the USA to 13.5% in Brazil, rates for women range from 5.0% in
Spain to 10.7% in Brazil. When comparing prevalence rates from countries that participated
in both the BOLD study and the Continuing to Confront survey, considerable discrepancies can be observed. In the United Kingdom, the Netherlands and the USA, prevalence rates from the BOLD study are about twice as high as from the Continuing to Confront survey; in Germany, they are slightly lower. These discrepancies may be due to the different definitions and methodologies, as well as the restricted geographical focus of the BOLD study.
However, they also make clear that epidemiological data on COPD in general should be interpreted with caution.
Figure 3: Prevalence of COPD from Continuing to Confront COPD International Patient Survey 2012/2013 by sex, population ≥ 40 years
Source: Landis et al. (2014: 601), illustration by IHS (2018)
The Continuing to Confront COPD International Patient Survey is another comprehensive epidemiological study on COPD. It was conducted in 12 countries in 2012/2013 as an update of the Confronting COPD International Survey from 1999/2000.
Similarly to the BOLD study, the Continuing to Confront survey only included the population aged 40 years and older. Respondents were classified as COPD cases when they met one of the following conditions:
physician diagnosis of COPD, chronic obstructive airway disease, or emphysema,
and either regularly used medication to treat these conditions or had chronic cough
with phlegm most days
physician diagnosis of chronic bronchitis and either regularly used medication to treat this condition or had chronic cough with phlegm most days
chronic bronchitis defined by symptomatology (cough and sputum production on most days for at least 3 months in the year for at least 2 consecutive years) and either regularly used medication to treat this condition or had chronic cough with phlegm most days
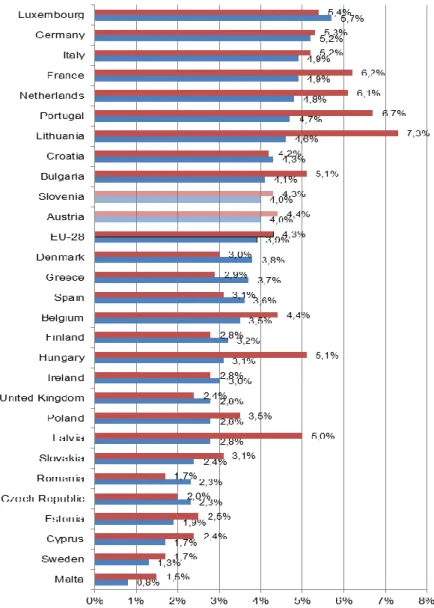
Epidemiological data on various diseases can also be drawn from the European Health Interview Survey (EHIS). EHIS consists of four modules (health status, health care use, health determinants, socio-economic background variables) and is planned to be conducted every 5 years in all EU member states, as regulated by Commission legislation. The second wave was conducted in 2014. The survey targets the population aged 15 years and older.
2Prevalence rates for chronic diseases are based on a question about the occurence of the respective disease in the past 12 months (During the past 12 months, have you had any of the following diseases or conditions?). The survey does not contain a question related specifically to COPD, but rather to “chronic bronchitis, COPD, emphysema”. The corresponding prevalence rates are presented in Figure 4.
Although the question covers a broader spectrum of diseases, the prevalence rates from EHIS are considerably lower than from both the BOLD study and the Continuing to Confront survey. The reason for this lies in the age groups covered by the studies: while BOLD and Continuing to Confront exclusively target populations aged 40 years and older, the lower age limit for EHIS is 15 years. Since COPD predominantly occurs in older populations, prevalence rates for the entire population are necessarily lower. Interestingly, according to EHIS, prevalence rates are higher for women than for men in the majority of EU countries as well as in the EU-28 as a whole (4.3% vs. 3.9%). Rates for men range from 0.8% in Malta to 5.7% in Luxembourg, and rates for women range from 1.5% in Malta to 7.3% in Lithuania.
Both Austria (4.4% for women, 4.0% for men) and Slovenia (4.3% for women, 4.0% for men) exhibit prevalence rates close to the EU average. Once again, there are discrepancies between the results of EHIS and the previously mentioned studies regarding the relative magnitude of prevalence rates. For example, while prevalence rates in Germany were found to be considerably lower than in the UK in the BOLD study, the opposite is the case in EHIS.
2
See http://ec.europa.eu/eurostat/web/microdata/european-health-interview-survey.
Figure 4: Prevalence of chronic respiratory diseases (excl. asthma) from European Health Interview Survey (EHIS) 2014 by sex, population ≥15 years
Notes: Prevalence rates based on the question During the past 12 months, have you had any of the following diseases or conditions? – Chronic bronchitis, chronic obstructive pulmonary disease, emphysema
Source: Eurostat (2017), illustration by IHS (2018)
Mortality
According to WHO Global Health Estimates, COPD accounted for 3.17 million deaths
worldwide in 2015, corresponding to 5.6% of all deaths. This makes it the fourth leading
cause of death worldwide after ischaemic heart disease, stroke and lower respiratory
infections. COPD is a more common cause of death in wealthier regions: while the crude
mortality rate amounted to 42.6 and 50.4 deaths per 100,000 population in high-income and
upper-middle-income economies (according to World Bank income groups), respectively, it amounts to merely 16.7 in low-income economies. (WHO, 2016a)
3.2.2. Asthma Prevalence
A wide range of epidemiological data on asthma in children can be drawn from the International Study of Asthma and Allergies in Childhood (ISAAC). ISAAC was an international epidemiological research programme investigating asthma, rhinitis and eczema in children in more than 100 countries, based on a standardised methodology. The study aimed at developing environmental measures and disease monitoring with a particular focus on developing countries. The ISAAC programme was formally terminated in 2012, but its work is continued by the Global Asthma Network, which was founded in the same year.
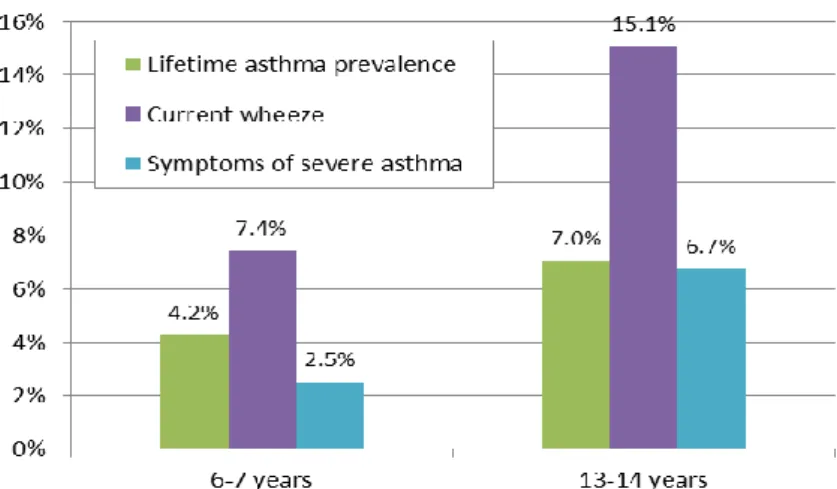
3In the course of the study, schoolchildren aged 6-7 years and 13-14 years were surveyed by means of a written questionnaire, which was completed by parents of the children in the younger age group. 233 sites in 97 countries collected data for the 13-14 year age group, 144 sites in 61 countries collected data in the 6-7 year age group. Different definitions of asthma – namely lifetime prevalence of asthma, current wheeze (12-month prevalence) and symptoms of severe asthma (12-month prevalence) – are considered in the study. Results from all global sites were published by Lai et al. (2009). Results for the 13-14 year age group from the participating EU countries are presented in Figure 5.
Lifetime prevalence rates range from 2.5% in Lithuania to 25.1%, i.e. ten times as high, in the United Kingdom. The United Kingdom also exhibits the highest prevalence rate of severe asthma at 10.5%. Current wheeze appears to be only weakly correlated with lifetime prevalence of asthma, as it exceeds lifetime prevalence considerably in some countries (e.g.
Romania, Finland), while it lies below lifetime prevalence in others (e.g. Italy, Spain). In Austria, lifetime prevalence was found to be relatively low at 7.0%; current wheeze (15.1%) and symptoms of severe asthma (6.7%) are around average among the depicted countries.
Slovenia was not included in the ISAAC survey.
3
See http://isaac.auckland.ac.nz/.
Figure 5: Prevalence of asthma according to different definitions among children aged 13-14 years in EU countries from ISAAC study
Notes: Lifetime asthma prevalence: based on the question Have you/has your child ever had asthma?
Current wheeze: wheeze in the past 12 months
Symptoms of severe asthma: frequent or severe episodes of wheeze in the past 12 months (≥4 attacks of wheeze or ≥1 night per week sleep disturbance from wheeze or wheeze affecting speech)
Source: Lai et al. (2009), illustration by IHS (2018)
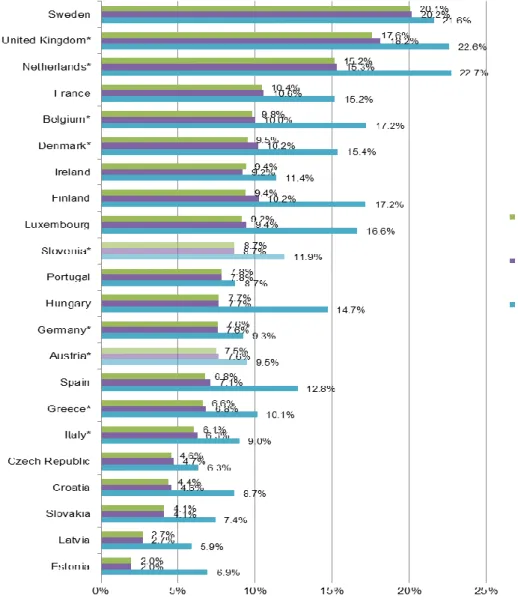
Epidemiological data on asthma in adult populations were collected in the course of the WHO World Health Survey, which was conducted in 2002-2004 in 70 countries worldwide.
Its aim was to strengthen national capacity to monitor critical health outcomes and health
system by providing a valid, reliable and comparable household survey instrument. It
targeted the population aged 18 years or older and includes data on, e.g., household health
expenditure, health state descriptions and valuation, risk factors, health care utilisation and
chronic conditions.
4With regard to asthma, similarly to the ISAAC study, three definitions are considered: doctor diagnosed asthma (lifetime prevalence), clinical asthma (lifetime prevalence) and symptoms of asthma (12-month prevalence). To et al. (2012) present global asthma prevalence rates collected in the World Health Survey (see Figure 6 for results from EU countries). In order to avoid confusion between asthma and COPD, they limit the sample to the population aged 18-45 years.
Prevalence rates for doctor diagnosed asthma are very close to prevalence rates for clinical asthma in all countries. This is hardly surprising, since persons diagnosed with asthma are also likely to receive treatment for their condition. The rates range from 2.0% in Estonia to 20.2% in Sweden. The prevalence of wheezing symptoms is higher than for doctor diagnosed and clinical asthma in all depicted countries, ranging from 5.9% in Latvia to 22.7%
in the Netherlands. Prevalence rates for this definition appear to be correlated with the other definitions to a relatively high degree. Doctor diagnosed asthma and clinical asthma occur in approx. 7.5% of the population, while 9.5% suffer from wheezing symptoms. In Slovenia, prevalence rates according to the World Health Survey are slightly higher, with 8.7% for doctor diagnosed or clinical asthma and 11.9% for wheezing symptoms. Once again, the absolute as well as relative magnitude of prevalence rates in EU countries differs from those observed in the ISAAC study. This may be partly due to the different age groups and different definitions. However, a common pattern is that asthma prevalence tends to be relatively high in Western and North-Western European countries, and relatively low in Baltic and Eastern European countries.
4
See http://apps.who.int/healthinfo/systems/surveydata/index.php/catalog/whs/about.
Figure 6: Prevalence of asthma according to different definitions in EU countries from WHO World Health Survey 2002-2003, population 18-45 years
Notes: *No sample weights available.
Doctor diagnosed: based on the question Have you ever been diagnosed with asthma?
Clinical asthma: based on the questions Have you ever been treated for asthma? or Have you been taking any medications or treatment for asthma during the last 2 weeks?
Wheezing symptoms: based on the question During the last 12 months have you experienced attacks of wheezing or whistling breath?
Source: To et al. (2012), illustration by IHS (2018)
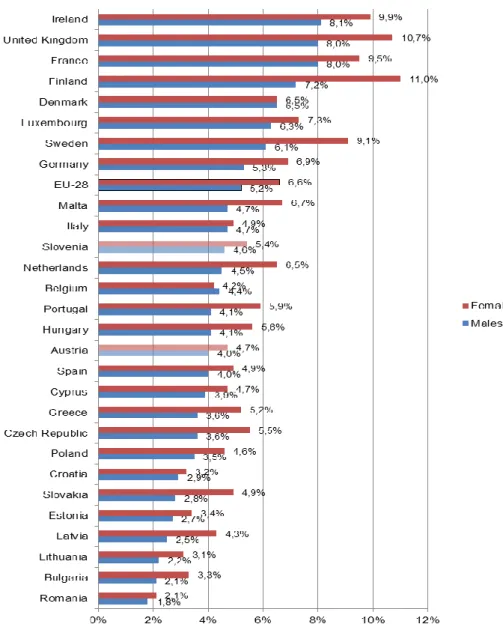
Figure 7: Prevalence of asthma from European Health Interview Survey (EHIS) 2014 by sex, population ≥15 years
Notes: Prevalence rates based on the question During the past 12 months, have you had any of the following diseases or conditions? – Asthma (allergic asthma included)
Source: Eurostat (2017), illustration by IHS (2018)
Asthma is also covered in the chronic diseases section of EHIS (see section 3.2.1 for further information on this survey). The corresponding prevalence rates are presented in Figure 7.
Asthma prevalence rates according to EHIS range from 1.8% in Romania to 8.1% in Ireland
for men and from 2.1% in Romania to 11.0% in Finland for women. Women exhibit higher
prevalence rates than men in almost all EU countries. On average, 6.6% of women and
5.2% of men suffer from asthma in the EU-28. Both Austria (4.7% for women, 4.0% for men)
and Slovenia (5.4% for women, 4.6% for men) have prevalence rates below the EU-28
average. The pattern of Baltic and Eastern European countries having relatively low asthma prevalence rates and Western and North-Western having higher rates also prevails in EHIS.
The overview of prevalence data on COPD and asthma presented above highlights that CRD are a widespread health problem in Western countries. However, considerable discrepancies across the different sources – which particularly arise in the case of COPD – make clear that obtaining reliable and comparable data is a difficult task. Discrepancies may be due to the variations in methodology described above, i.e. different data sources, definitions, prevalence measures and/or observed populations. Moreover, the individual methodological approaches may not yield accurate measures of prevalence. The data presented above as well as in the following subsection should therefore be interpreted with caution.
Mortality
The mortality of asthma is considerably lower than the mortality of COPD. In 2015, 380,000 deaths worldwide were caused by asthma. This corresponds to 0.7% of all deaths. In contrast to COPD, asthma as a cause of death is more common in low-income regions: the crude mortality rate of asthma amounts to 1.6 and 2.6 per 100,000 population in high-income and upper-middle-income economies, respectively, but reaches 7.5 in low-income economies. (WHO, 2016a)
3.3. Epidemiological data on chronic respiratory diseases in Austria
3.3.1. COPD Prevalence
In a review study for the Main Association of Austrian Social Security Institutions (Hauptverband der Österreichischen Sozialversicherungsträger, HV), Gothe (2012) investigated available prevalence data on COPD for Austria. He identifies publications related to the BOLD study as the sole sources of prevalence data for Austria. Furthermore, he concludes that determining COPD prevalence from administrative data of the social health insurance is difficult, due to the lack of diagnostic data from the outpatient sector and the problem of distinguishing COPD from other (chronic) respiratory diseases based on pharmaceutical prescription data.
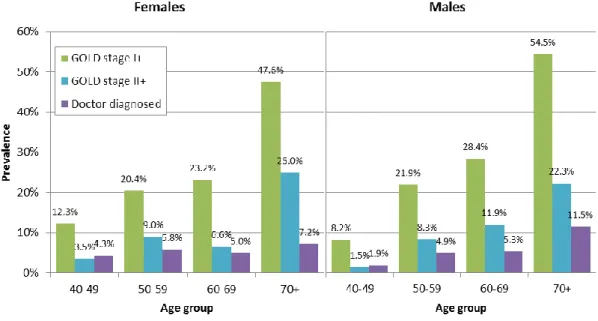
Austrian prevalence data from the BOLD study were published by Schirnhofer et al. (2007)
and are presented in Figure 8 for three definitions: GOLD stage I or higher, GOLD stage II or
higher and doctor diagnosed. Total prevalence is 26.1% (26.6% men, 25.7% women) for
GOLD stage I or higher, 10.7% (10.3% men, 11.0% women) for GOLD stage II or higher and 5.6% (5.6% both men and women) for doctor diagnosed chronic bronchitis, emphysema or COPD according to the BOLD study. This suggests that a large share of COPD cases remain undiagnosed. For example, in the age group over 70 years, around one half are classified as GOLD stage I or higher and around one quarter as GOLD stage II or higher, while only around 10% report previous diagnosis by a physician. The large differences between prevalence rates according to the three definitions highlight the significance of the definition chosen when reporting COPD prevalence.
Figure 8: Prevalence of COPD according to different definitions from BOLD study by sex and age group, 2004/2005
Notes: GOLD stage I+: FEV
1/FVC ratio of <0.7
GOLD stage II+: FEV
1/FVC ratio of <0.7 and FEV
1of <80% predicted FEV
1= forced expiratory volume in one second
FVC = forced vital capacity
Doctor diagnosed: Self-reported physician's diagnosis of chronic bronchitis, emphysema, or COPD
n=1,258
Source: Schirnhofer et al. (2007), illustration by IHS (2018)
As mentioned in section 3.2.1, prevalence of CRD was also determined in the Austrian
branch of EHIS 2014, the Austrian Health Interview Survey (ATHIS). Detailed results by
sex and age are presented in Figure 9. Aggregate prevalence rates according to ATHIS are
4.0% for men and 4.4% for women. The actual prevalence rates observed in the data
fluctuate strongly in higher age groups. Therefore, a moving average was calculated. For
men, the moving average increases consistently with age and reaches approx. 12% for
individuals over 85 years of age. Women exhibit higher rates than men in younger age
groups – leading to a higher total prevalence rate for women –, but lower rates in older age
groups. The moving average for women reaches its highest value at approx. 9% for individuals over 85 years of age. Overall, prevalence rates according to ATHIS are relatively close to those of doctor diagnosed COPD/chronic bronchitis/emphysema in the corresponding age groups in the BOLD study.
Figure 9: Prevalence of chronic respiratory diseases (excl. asthma) from Austrian Health Interview Survey (ATHIS) 2014 by sex and age, percentage per age group and moving average (MA)
Notes: Prevalence rates based on the question During the past 12 months, have you had any of the following diseases or conditions? – Chronic bronchitis, chronic obstructive pulmonary disease, emphysema
Moving average: average of previous and following data points; 3-year MA for age groups up to 45-49, 5-year MA for age groups from 50-54 onwards
n=15,771
Source: Statistics Austria (2014), illustration by IHS (2018)
Considering the problems associated with survey data as a source for epidemiological data (see section 3.1), additional data would be desirable in order to measure COPD prevalence more accurately. The Austrian LEAD (Lung, hEart, sociAl, boDy) Study is a promising initiative in this context. The LEAD study is a long-term study on respiratory health in Austria that aims at identifying causes and risk factors of respiratory diseases, developing innovative treatment approaches and avoiding respiratory diseases in the future.
5It has was initiated in 2012 and is planned to continue for 12 years. In order to determine prevalence of respiratory diseases, comprehensive medical examinations and surveys are conducted in a sample of around 11,000 individuals aged between 6 and 80 years in Lower Austria and Vienna in intervals of four years. Lung function is tested via spirometry and body plethysmography.
5
See https://www.leadstudy.at/en/.
0%
2%
4%
6%
8%
10%
12%
14%
15-1 9 20-2 4 25-2 9 30-3 4 35-3 9 40-4 4 45-4 9 50-5 4 55-5 9 60-6 4 65-6 9 70-7 4 75-7 9 80-8 4 85+
Pr ev al en ce
Age
Males
Females
Males MA
Females MA