• Keine Ergebnisse gefunden

Modulating Mitochondrial Biogenesis in Caenorhabditis elegans

N/A
N/A
Protected

Academic year: 2021

Aktie "Modulating Mitochondrial Biogenesis in Caenorhabditis elegans"

Copied!
144
0
0

Wird geladen.... (Jetzt Volltext ansehen)

Volltext

(1)

Identification of Genes

Modulating Mitochondrial Biogenesis in Caenorhabditis elegans

Inaugural–Dissertation zur

Erlangung des Doktorgrades

der Mathematisch-Naturwissenschaftlichen Fakultät der Universität zu Köln

vorgelegt von Victor Pavlenko aus Novorossiysk, Russland

Köln, 2015

(2)

Berichterstatter/in: Prof. Dr. Aleksandra Trifunovic Prof. Dr. Adam Antebi

Tag der mündlichen Prüfung: 27.11.2015

(3)

Table of Contents

Table of Contents ... iii

List of Figures ... vi

List of Tables ... viii

Abbreviations ... ix

Abstract ... xiii

Zusammenfassung ... xiv

1 Introduction ... 1

1.1 Mitochondria ... 1

1.1.1 Discovering mitochondria ... 1

1.1.2 Mitochondrial architecture and function ... 2

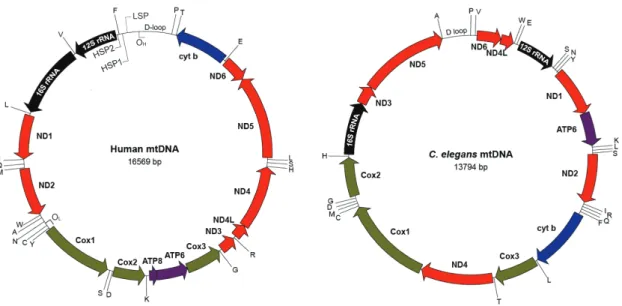
1.1.3 Mitochondrial genome ... 7

1.1.3.1 Organization ... 7

1.1.3.2 mtDNA transcription ... 9

1.1.3.3 mtDNA replication ... 10

1.2 Aging ... 12

1.2.1 Mitochondrial Free Radical Theory of Aging ... 14

1.2.2 The mtDNA mutator mouse ... 14

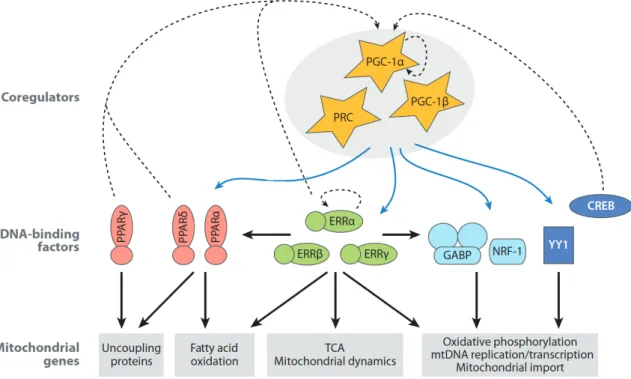
1.3 Regulation of mitochondrial biogenesis in mammals ... 15

1.3.1 Nuclear transcription factors ... 16

1.3.2 Nuclear coactivators ... 19

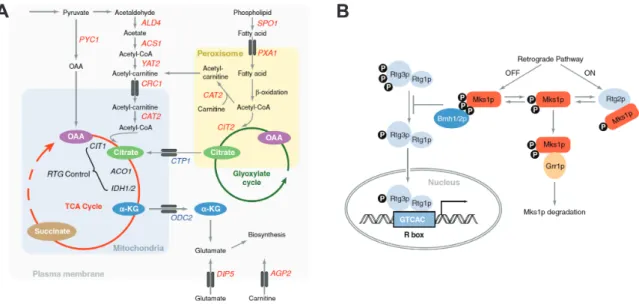
1.4 Retrograde response ... 21

1.4.1 … in yeast ... 22

1.4.2 … in mammals ... 25

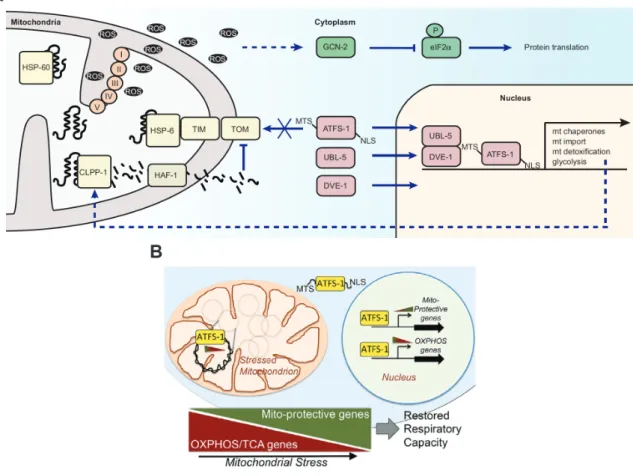
1.4.3 … in C. elegans ... 27

1.5 Objectives ... 30

2 Materials and Methods ... 31

2.1 Chemicals and biological materials ... 31

2.2 Worm experiments ... 32

(4)

2.2.1 Maintenance of C. elegans ... 32

2.2.2 Nematode strains ... 33

2.2.3 Generating synchronized worm population ... 33

2.2.4 Biosorter ... 34

2.2.5 Crossing of C. elegans strains ... 34

2.2.6 Lifespan assays ... 34

2.2.7 Oxygen consumption ... 34

2.3 Molecular biology and biochemistry ... 35

2.3.1 RNAi ... 35

2.3.2 Cloning ... 35

2.3.3 Single worm lysis ... 37

2.3.4 Determination of mtDNA copy number ... 37

2.3.5 Quantification of nucleic acids ... 38

2.3.6 Analysis of gene expression ... 38

2.3.7 RNA-seq ... 39

2.3.8 Protein isolation ... 40

2.3.9 Western Blot analysis ... 40

2.4 Computer analyses and microscopy ... 41

2.4.1 Photomicrographs ... 41

2.4.2 Statistical analyses and graphical representation ... 41

3 Results ... 42

3.1 Transcription factors RNAi screen using mtss-1

pr

::gfp ... 42

3.2 Knockdowns of sptf-3, gei-17 and W04D2.4 decrease lifespan ... 44

3.3 Endogenous mtss-1 transcripts are reduced upon sptf-3 and W04D2.4 knockdown ... 45

3.4 W04D2.4 localizes to the nucleus at 25°C ... 46

3.5 W04D2.4 is involved in the regulation of genes with mitochondrial function ... 48

3.6 sptf-3 is the only sptf gene affecting mtss-1

pr

::gfp expression ... 52

3.7 sptf-3 knockdown affects induction of reporter constructs representing TCA cycle and mtDNA transcription ... 53

3.8 sptf-3 knockdown promotes mitochondrial hyperfusion without significantly affecting mitochondrial mass ... 54

3.9 sptf-3 knockdown reduces mtDNA copy number but does not affect respiration ... 57

3.10 SPTF-3 is a broad-spectrum transcription factor ... 59

3.11 mtss-1

pr

::gfp suppressor screen ... 62

(5)

3.12 From factors involved in cytoplasmic translation only knockdown of ribosomal protein genes

induces mtss-1

pr

::gfp expression ... 66

3.13 SPTF-3 is the only transcription factor able to alter rps-22 knockdown mediated mtss-1

pr

::gfp induction ... 69

3.14 rps-22 knockdown effect is not mediated via GCN-2 kinase ... 71

3.15 sptf-3 knockdown impairs UPR

mt

induction ... 74

3.16 sptf-3 function is required specifically for UPR

mt

induction ... 78

4 Discussion ... 82

4.1 C. elegans specific regulation of mitochondrial biogenesis is largely unknown ... 83

4.2 W04D2.4 a novel, nematode specific regulator of mitochondrial biogenesis? ... 84

4.3 SPTF-3 regulates expression of genes with mitochondrial function in C. elegans ... 85

4.4 Knockdown of cytosolic ribosomal protein genes induces mtss-1 expression in specific, sptf-3 mediated manner ... 88

4.5 SPTF-3 function is required for the UPR

mt

activation ... 92

4.6 Conclusions ... 95

5 References ... 96

6 Appendix ... 119

Acknowledgements ... 126

Erklärung ... 129

Curriculum Vitae ... 130

(6)

Figure 1.1 Mitochondrial architecture ... 4

Figure 1.2 Respiratory chain ... 5

Figure 1.3 Fluid, solid and plasticity models of OXPHOS complexes organization ... 6

Figure 1.4 Structures of human and C. elegans mtDNA ... 9

Figure 1.5 Mitochondrial biogenesis regulatory framework in mammals ... 21

Figure 1.6 Metabolic events modulating retrograde response and the RTG pathway ... 24

Figure 1.7 Mitochondrial stress signaling in C. elegans ... 29

Figure 3.1 Experimental outline to detect genes involved in mitochondrial biogenesis ... 43

Figure 3.2 Lifespan assays upon inhibition of candidate genes ... 44

Figure 3.3 Transcript and protein levels of genes with mitochondrial function upon sptf-3 knockdown ... 46

Figure 3.4 W04D2.4 transcriptional reporter ... 47

Figure 3.5 Localization of W04D2.4-mCherry ... 48

Figure 3.6 RNA-seq transcriptome analysis after W04D2.4 knockdown. ... 49

Figure 3.7 Only sptf-3 knockdown prevents mtss-1

pr

::gfp induction ... 52

Figure 3.8 sptf-3 knockdown affects mitochondrial reporters ... 54

Figure 3.9 Mitochondrial network morphology upon sptf-3 knockdown ... 55

Figure 3.10 Mitochondrial mass upon sptf-3 knockdown ... 56

Figure 3.11 mtDNA copy number upon sptf-3 knockdown ... 58

Figure 3.12 Respiration capacity and brood size upon sptf-3 knockdown ... 58

Figure 3.13 Transcript and protein levels of genes with mitochondrial function upon sptf-3 knockdown ... 62

Figure 3.14 Reducing cytoplasmic ribosomes activates mtss-1

pr

::gfp reporter ... 65

Figure 3.15 CeTOR signaling and rps-22 knockdown ... 69

Figure 3.16 SPTF-3 is required for mtss-1

pr

::gfp expression induced by rps-22 knockdown . 70 Figure 3.17 gcn-2(ok871) and ife-2(ok306) impact on mtss-1

pr

::gfp ... 72

Figure 3.18 mtss-1

pr

::gfp induction in gcn-2(ok871) and ife-2(ok306) mutants ... 73

Figure 3.19 Effect of sptf-3 knockdown on stress reporters ... 75

Figure 3.20 Effect of sptf-3 knockdown on induced hsp-6

pr

::gfp expression ... 76

(7)

Figure 3.21 Effect of sptf-3 knockdown on induced hsp-60

pr

::gfp expression ... 77 Figure 3.22 Effect of sptf-3 knockdown on constitutively induced hsp-6

pr

::gfp expression in

isp-1(qm150); ctb-1(qm189) background ... 78

Figure 3.23 sptf-3 knockdown effect on induced UPR

er

and oxidative stress response ... 80

Figure 3.24 Effect of sptf-3; rps-22 double knockdown on UPR

mt

induction ... 81

(8)

Table 2.1 Chemicals and biological materials used in this study ... 32

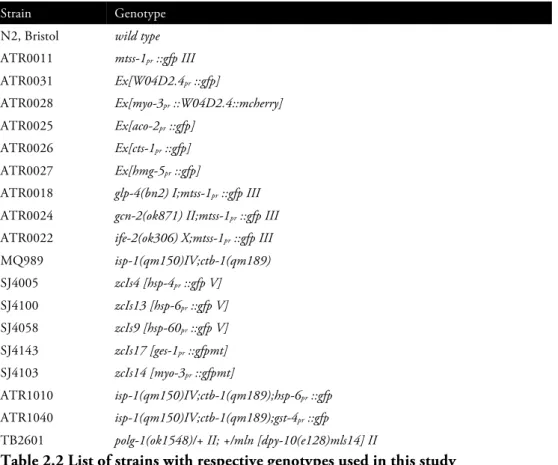
Table 2.2 List of strains with respective genotypes used in this study ... 33

Table 2.3 Oligonucleotides used for cloning ... 37

Table 2.4 Oligonucleotides used for genotyping ... 37

Table 2.5 Oligonucleotides used for qPCR-based gene expression analysis ... 39

Table 2.6 Antibodies used in this study ... 41

Table 3.1 Candidates from RNAi screen conducted at 25°C ... 43

Table 3.2 Lifespan summary ... 45

Table 3.3 RNA-seq results for genes involved in RC, mtDNA expression and UPR

mt

... 51

Table 3.4 Putative transcriptional targets of SPTF-3 ... 61

Table 3.5 Candidates from the suppressor screen conducted at 20°C ... 64

Table 3.6 List of factors related to translation and their knockdown effect on mtss-1

pr

::gfp expression ... 68

Table 6.1 RNA-seq based list of annotated mitochondria-related genes, with altered

transcript levels upon W04D2.4 knockdown ... 125

(9)

% percent

°C degrees Celsius

~ approximately

2D AGE two-dimensional agarose gel electrophoresis 3' three prime end of nucleotide sequence

3D three-dimensional

4E-BP eukaryotic translation initiation factor 4E binding protein 5' five prime end of nucleotide sequence

A adenine

acetyl-CoA acetyl coenzyme A

AD Alzheimer's disease

ADP adenosine dihosphate

α

-KG alpha ketoglutarate

AMP adenosine monophosphate

AMPK AMP activated kinase

ANT1 adenine nucleotide translocase 1 ARE antioxidant response elements

ATFS-1 bZip activating transcription factor associated with stress 1

ATP adenosine triphosphate

bp base pair

bZip basic leucin zipper

C cytosine

C-terminus carboxyl terminus C. elegans Caenorhabditis elegans

C/EBP CAAT/enhancer-binding protein

CaMK IV calcium/calmodulin-dependent protein kinase IV

cAMP cyclic AMP

cDNA complementary DNA

CeTOR C. elegans TOR

ChIP-seq chromatin immunoprecipitation followed by deep sequencing

CHOP C/EBP homologous protein

CI/II/III/IV/V complex I/II/III/IV/V

CIT1 mitochondrial citrate synthase CIT2 peroxisomal citrate synthase

CoQ Coenzyme Q10

COX cytochrome c oxidase

CR caloric restriction

CREB cAMP response element-binding protein

CytC cytochrome c

DNA deoxyribonucleic acid

DVE-1 homolog of Defective proVEntriculus

(10)

e.g. exempli gratia

eIF2

α

eukaryotic initiation factor 2 alpha eIF4E eukaryotic initiation factor 4E

ER endoplasmatic reticulum

ERR estrogen related receptor ETC electron transport chain

FADH

2

flavin adenine dinucleotide, hydroquinone form

FAO fatty acid oxidation

Fe/S iron-sulfur

G guanine

g gram

g gravitational force

GABP GA-binding protein

GCN-2 general control non-derepressible-2 kinase GFP green fluorescent protein

GST-4 Glutathione S-Transferase H-strand heavy strand

H

+

proton

H

2

0 water

HMG high mobility group

HSF-1 heat shock factor 1

HSP heavy strand promoter

HSP heat shock protein

IDH isocitrate dehydrogenase IGF insulin-like growth factor

IMM inner mitochondrial membrane

IMS intermembrane space

IRE-1 inositol-requiring 1 protein kinase (homolog) IRES internal ribosome entry site

kb kilo base pairs

KLF Kruppel-like factor

L-strand light strand L1/2/3/4 larval stage 1/2/3/4

LSP light strand promoter

mAAA matrix ATPases Associated with diverse cellular Activities MAPK mitogen activated protein kinase

Mb mega base pairs

MEF mouse embryonic fibroblast

MFRTA mitochondrial free radical theory of aging

mm millimeter

mRNA messenger RNA

MSR mitochondrial stress responses

mtDNA mitochondrial DNA

MTERF mitochondrial transcription termination factor

mTOR mammalian TOR

(11)

MTS mitochondria targeting sequence

MTSS-1 mitochondrial single-stranded DNA binding protein

n sample size

N-terminal amino terminus

N2 wild type Bristol C. elegans strain

NAD

+

nicotinamide adenine dinucleotide, oxidized NADH nicotinamide adenine dinucleotide, reduced

nDNA nuclear DNA

NFE2L2 nuclear factor (erythroid-derived 2)-like 2

NGM nematode growth medium

NLS nuclear localization signal

nm nanometer

NRF nuclear respiratory factor

O

H

origin of heavy strand replication O

L

origin of light strand replication

OMM outer mitochondrial membrane

OXPHOS oxidative phosphorylation P-eIF2

α

phosphorylated eIF2alpha

PCR polymerase chain reaction

PD Parkinson's disease

PDI-3 protein disulfide isomerase

PGC-1 PPARY coactivator 1

P

i

inorganic phosphate

POL

γ

mitochondrial DNA polymerase Y

POLRMT mitochondrial DNA-directed RNA polymerase PPAR peroxisome-proliferator activated receptor PTM post-translational modifications

qPCR quantitative PCR

RC respiratory chain

RFU relative fluorescence units

RITOLS RNA incorporation throughout the lagging strand

RNA ribonucleic acid

RNA-seq RNA sequencing

RNAi RNA interference

ROS reactive oxygen species

RPG ribosomal protein gene

rRNA ribosomal RNA

RTG retrograde

RXR retinoid X receptor

SEM standard error of mean

SIRT1 sirtuin 1

SP specificity protein

SPG7 spastic paraplegia 7

SSBP-1 mitochondrial single-stranded DNA binding protein 1

T thymine

(12)

TCA cycle tricarboxylic acid cycle

TFAM mitochondrial transcription factor A TFB1M/2M mitochondrial transcription factor B 1/2 TIM translocase of inner membrane

TOM translocase of outer membrane

TOMM20L translocase of outer mitochondrial membrane 20 homolog (yeast)-like

TOR target of rapamycin

tRNA transfer RNA

U Unit

UBL-5 ubiquitin-like protein 5

UCP1 uncoupling protein 1

UPR

er

endoplasmatic reticulum unfolded protein response UPR

mt

mitochondrial unfolded protein response

UV ultraviolet

VDAC1 voltage-dependent anion channel 1

vs. versus

YY1 Ying Yang 1

µm micrometer

(13)

Abstract

Since Altmann recognized ubiquitously distributed "bioblasts" in 1890, understanding of mitochondria has evolved from "elementary organisms" living inside cells and carrying out vital functions, over the Harman's "free radical theory" in 1956, to one of the driving forces of aging and cause of multiple associated diseases impacting society today. While a tremendous amount of work has contributed to the understanding of mitochondrial biology in different model organisms, the precise molecular mechanisms of basic mitochondrial function have yet to be deciphered.

By employing an RNA interference mediated screen in Caenorhabditis elegans, we identified two transcription factors: SPTF-3, a member of Sp1 family, and an uncharacterized, nematode specific W04D2.4. We propose that both proteins modulate expression of many genes with regard to mitochondrial function including mitochondrial single-stranded binding protein encoded by mtss-1, whose promoter was used as transcriptional reporter in the screen. Further, RNA sequencing data indicate that W04D2.4 indirectly regulates expression of mitochondrial DNA via control of genes functionally related to mitochondrial replication and translation machineries. We also demonstrate that from all interventions targeting cytosolic translation, MTSS-1 levels are elevated only upon knockdown of genes encoding cytosolic ribosomal proteins. Reduction of ribosomes leads to increased sptf-3 translation, most likely in an internal ribosome entry side (IRES) mediated manner, eventually inducing mtss-1 expression. Moreover, we identify a novel role for SPTF-3 in the regulation of mitochondrial unfolded stress response (UPR

mt

) activation, but not endoplasmatic reticulum or oxidative stress responses.

Taken together, this study identifies two transcription factors

previously not associated with mitochondrial biogenesis and UPR

mt

in C. elegans, establishing

a basis for further investigation of mito-nuclear interactions.

(14)

Zusammenfassung

Seit der deutsche Pathologe Richard Altmann im Jahr 1890 Mitochondrien fälschlicherweise als Elementarbauteile der Zelle bezeichnet hatte, trug der unaufhaltsame technische und wissenschaftliche Fortschritt dazu bei, dass den Mitochondrien heutzutage eine zentrale Rolle im Alterungsprozess und bei diversen Pathologien zugeschrieben wird. Trotz beachtlich vieler Erkenntnisse über die Funktionsweise und Aufbau der Mitochondrien, existieren immer noch Wissenslücken über grundlegende Funktionen des Organells. In der vorliegenden Arbeit konnten wir mit Hilfe von Screens, basierend auf dem RNA-Interferenz Mechanismus, zwei Transkriptionsfaktoren identifizieren: SPTF-3, Mitglied der Sp1-Familie und den bis dato nicht charakterisierten, nematodenspezifischen W04D2.4. Unsere Studie deutet darauf hin, dass beide Proteine die Expression von vielen Genen mit mitochondrialer Funktion regulieren. Dazu gehört auch das Gen mtss-1, welches das mitochondriale Einzelstrang-bindende Protein kodiert und dessen Promoterregion wir im Transkriptionsreporterkonstrukt verwendet haben. Außerdem deuten die Ergebnisse der RNA-Sequenzierung darauf hin, dass W04D2.4 die Expression der mitochondrialen DNA indirekt reguliert, indem es Transkription von Genen kontrolliert, welche Replikations- und Translationsvorgänge in Mitochondrien bestimmen.

Des Weiteren konnten wir demonstrieren, dass ein Knockdown von ribosomkodierenden

Genen zu erhöhter sptf-3 Translation führt, voraussichtlich begünstigt durch interne

ribosomale Eintrittsstelle in der RNA-Sequenz. Darauffolgend führen erhöhte SPTF-3-

Proteinmenge zu verstärkter Expression von mtss-1, was anhand entsprechender RNA- und

Proteinmengen festgestellt wurde. Darüberhinaus deuten unsere Ergebnisse an, dass SPTF-3

eine Funktion in der Regulierung der mitochondrialen Antwort auf ungefaltete Proteine

(mitochondrial unfolded protein response, UPR

mt

) erfüllt. Abschließend ist festzuhalten, dass

wir zwei Transkriptionsfaktoren identifiziert haben, welche zuvor nicht mit der Regulation

der mitochondrialen Biogenese und UPR

mt

im Fadenwurm Caenorhabditis elegans assoziiert

wurden und somit neue Möglichkeiten eröffnen, Interaktionen zwischen Mitochondrien

und Zellkern zu untersuchen.

(15)

1 Introduction

1.1 Mitochondria

1.1.1 Discovering mitochondria

At the end of the 19th century, new histological methods and advancing microscopy allowed Richard Altmann to detect “granular bodies” within various types of plant and animal cells (Altmann, 1890). These granular bodies, initially-called

“bioblasts” or life germs, displayed staining properties of bacteria. Therefore, these organelles (later termed “mitochondria") were interpreted as autonomous, bacteria like structures.

Moreover, Altmann mistakenly assumed that bioblasts were elementary building blocks

within eukaryotic cells, which was predominantly the reason why his observations were

largely neglected. Fifteen years later, Russian botanist Constantin Mereschkowsky

hypothesized that plastids were once free-living cyanobacteria, which were incorporated by

heterotrophic cells during the course of evolution (Mereschkowsky, 1905). In his follow-up

publications he suggested that plant cells are animal cells that incorporated cyanobacteria (for

review, see (Kutschera and Niklas, 2005)). Interestingly, he accepted Altmann’s idea that the

nuclei of cells are simply accumulations of mitochondrial “granules”, without considering

their bacterial origin. However, scientists mainly rejected theories about the bacterial origin

of plastids and mitochondria, favoring “autogenous” theory, implying that the organelles

evolved de novo within eukaryotes. Though Mereschkowsky’s hypothesis provides the basis

for the endosymbiotic theory, it was revived only when, in 1970, Lynn Margulis presented

her theory on the origin of plastids and mitochondria in the context of arising cell and

molecular biology in Origin of Eukaryotic Cells. She postulated that both organelles were at

some point engulfed by a protoeukaryote host and reduced to ensure energy supply. The first

experimental evidence supporting endosymbiotic theory was delivered by molecular

phylogenetic analysis of ferredoxins, 5S ribosome RNAs and c-type cytochromes between

diverse types of bacteria, green algae and organelles of eukaryotes (Schwartz and Dayhoff,

1978). That study revealed shared recent ancestry between chloroplasts and cyanobacteria,

and between mitochondria and respiring photosynthetic bacteria, supporting bacterial origin

(16)

of eukaryotic organelles. Moreover, temporal mapping of these events suggested that mitochondria and chloroplasts became endosymbionts at two distinct stages around 2 and 1.1 billion years ago, respectively. Since these discoveries, an ever expanding field of genomic sequencing and computational methods of phylogenetic inference have been shaping the evolutionary tree, generating models for eukaryotic origins (for review, see (Embley and Martin, 2006)). More recent analyses supporting endosymbiotic theory suggest that mitochondria evolved from free-living ancestors of the Alphaproteobacteria SAR11 clade, sister order to the Rickettsiales (Thrash et al., 2011).

Though being engulfed, mitochondria retained its genome.

Mitochondrial DNA (mtDNA) was observed for the first time in chick embryo in 1963 (Nass and Nass, 1963). Two decades later, mitochondrial genome sequencing began with samples from human and murine cells and to this day mtDNA from over 6.000 organisms (http://www.ncbi.nlm.nih.gov/genome) has been successfully sequenced (Anderson et al., 1981; Bibb et al., 1981). This massive data flood revealed that mtDNA is highly diverse not only in the number and size of chromosomes but also in the number of protein-coding genes: whereas mammalian mtDNA is around 16 kb and harbors 13 protein-coding genes, the size of mtDNA from Silene conica, flowering plant, is around 11 Mb, encoding 25 proteins (Sloan et al., 2012). Notably, the mitochondrial genome is highly reduced compared to extant Alphaproteobacteria. Computational inference studies of Alphaproteobacteria genome evolution suggest that their ancestors contained 3.000-5.000 genes indicating endosymbiotic gene transfer from the protomitochondrial genome to the nucleus (Boussau et al., 2004). Remarkably, out of 800 human genes with Alphaproteobacteria signature, only 200 are found in the mitochondrial proteome, suggesting that eukaryotic cell evolution was affected by proto-mitochondrial genes beyond mitochondrial function (for review, see (Gray, 2012)).

1.1.2 Mitochondrial architecture and function

Mitochondria are organized in a highly dynamic, readily growing,

dividing and fusing network, which cannot be synthesized de novo and therefore must be

distributed between dividing cells. Mitochondria are composed of two lipid bilayers that

subdivide the organelle into two aqueous compartments. Mammalian mitochondria contain

(17)

around 3.200 predicted, with currently 1.098 experimentally validated proteins, but mtDNA harbors only 13 protein-coding genes (Pagliarini et al., 2008; Richly et al., 2003). Therefore, the vast majority of mitochondrial proteins are nuclear DNA (nDNA) -encoded, synthesized in the cytosol and eventually transported into the organelle. The outer (OMM) and the inner mitochondrial membranes (IMM) possess distinct permeability, ensuring compartment specific content of intermembrane space (IMS) and matrix (Figure 1.1). Low molecular weight molecules can passively cross OMM through transmembrane channels called porins, thus IMS content is comparable to that of the cytosol. By contrast, protein rich IMM composition is characterized by four times higher cardiolipin content, a mitochondria specific lipid, which makes it highly impermeable to ions and solutes (Gebert et al., 2009;

Zinser et al., 1991). Therefore, sophisticated transport machineries, translocase of outer (TOM) and translocase of inner membrane (TIM) complexes, actively facilitate movement of proteins into OMM, IMS, IMM and matrix. Many mitochondrial proteins contain mitochondrial targeting signals that can be present as cleavable N-terminal matrix targeting sequence (MTS) or an internal targeting signal, which direct proteins to the IMS or the IMM (Neupert and Herrmann, 2007). The TOM complex is considered to be the entry gate for virtually all mitochondrial proteins of cytosolic origin.

Mitochondria are broadly known as the power plants of the cell, supplying them with energy in the form of adenosine triphosphate (ATP) generated by oxidative phosphorylation (OXPHOS). On a regular day humans use the amount of ATP equal to their own weight, largely due to brain and muscle activity. Since the human body contains only around 250 g of ATP at a time, a highly efficient ATP recovery system is a prerequisite. Nevertheless, in addition to supplying energy via oxidative phosphorylation,

β

-oxidation (catabolism of fatty acids) and tricarboxylic acid cycle (TCA cycle, also known as Krebs cycle), mitochondria are important for calcium homeostasis, apoptosis, cellular differentiation, and heme and iron-sulfur (Fe/S) cluster synthesis (Alberts et al., 2002).

Notably, Fe/S proteins of mitochondrial origin are indispensible for nDNA maintenance and

cytosolic translation, emphasizing the importance of mitochondria for cell survival (Stehling

and Lill, 2013).

(18)

Figure 1.1 Mitochondrial architecture

Schematic representation of mitochondria, enveloped by two separate lipid bilayers: inner (IMM) and outer mitochondrial membranes (OMM). Thus, two distinct compartments are formed, each containing specific set of molecules. Mitochondrial DNA (mtDNA) resides in the matrix; translocase of outer (TOM) and translocase of inner membrane (TIM) complexes facilitate movement of proteins from cytosol into mitochondria. Cristae are invaginations of IMM into the matrix, that increase total surface of IMM and serve as primary site of action for oxidative phosphorylation (OXPHOS) complexes (Vogel et al., 2006).

The mitochondrial OXPHOS system is unique as all five multiprotein complexes of the OXPHOS system reside in the IMM, whereas its around 90 components are encoded by two distinct genomes, nuclear and mitochondrial DNA.

Thirteen mtDNA-encoded proteins are translated in the matrix in close proximity to the

IMM, where they are assembled into functional complexes together with around 80

imported nDNA-encoded proteins. The electron transport chain (ETC) consists of four

complexes: complex I (CI, NADH:ubiquinone oxidoreductase, EC 1.6.5.3), II (CII,

succinate:ubiquinone oxidoreductase, EC 1.3.5.1), III (CIII, ubiquinol:ferricytochrome c

oxidoreductase, EC 1.10.2.2), and IV (CIV, cytochrome c oxidase, COX, EC 1.9.3.1) (for

review, see (Fernandez-Vizarra et al., 2009)) (Figure 1.2). ETC receives electrons from two

donors: NADH and FADH

2

. Whereas NADH is produced in the course of glycolysis, TCA

cycle and

β

-oxidation, FADH

2

stores the energy from oxidation of succinate to fumarate, two

intermediates in the TCA cycle. This redox-reaction is facilitated by complex II, functionally

connecting TCA cycle with ETC. The donated electrons enter the ETC at complexes I and

II, facilitating sequential oxidoreductase reactions that culminate in the reduction of

molecular oxygen to water by complex IV. Electron flow through the ETC provides energy,

enabling complexes I, III and IV to pump H

+

ions across the IMM into the IMS. (for review,

(19)

see (Lodish et al., 2000)). The difference in H

+

concentration between the matrix and IMS builds up a proton-motive force across the IMS. Eventually complex V exploits flow back of protons into the matrix to generate ATP from adenosine diphosphate (ADP) and phosphate group (P

i

).

Figure 1.2 Respiratory chain

Schematic representation of oxidative phosphorylation, with complexes I-IV functionally grouped into electron transport chain (ETC). Electrons from NADH and FADH

2

are passed from complexes I and II by Coenzyme Q

10

(CoQ) to complex III, further by cytochrome c (CytC) to complex IV resulting in reduction of molecular oxygen to water. The energy from the electron flow is driving proton pumping activity of complexes I, III and IV, generating a proton gradient across the IMM.

Flowing back into matrix, protons are exploited by complex V to generate ATP from ADP and P

i

.

The efficiency of the OXPHOS system depends on many factors,

one of which is the spatial distribution of single complexes, as electrons are passed down

from CI and CII, via CIII to CIV. Though for the sake of clarity, OXPHOS is presented as

strung-together complexes. There are two distinct models explaining organization of

complexes in the IMM (Figure 1.3).

(20)

Figure 1.3 Fluid, solid and plasticity models of OXPHOS complexes organization

Representation of single complexes and electron carriers is indicated in the fluid model.

Supercomplex formation in the plasticity model includes single complexes of each type, although the actual stoichiometry may vary (Enriquez and Lenaz, 2014). Illustration from (Acin-Perez et al., 2008).

The “solid model” was based on experimental co-isolation of complexes I and III, and on observations that once the electron transport system has been formed, single complexes do not dissociate upon dilution or centrifugation (Hatefi et al., 1962a; Hatefi et al., 1962b). Therefore, it was postulated that respiratory activity is based on solid supercomplex formation enabling fast intra- and inter-complex electron transfer (Green and Tzagoloff, 1966). The second, “random collision model” or “fluid model” suggests that the mitochondrial inner membrane is rather a fluid-state layer and that all membrane proteins, including the OXPHOS complexes, are freely and independently diffusing and colliding within this layer (Hackenbrock et al., 1986). Moreover, single complexes do not interact physically with electrons transported by CoQ and CytC between the complexes.

Therefore, diffusion rates have controlling capacity on the electron transport kinetics. As is often the case, the truth most likely lies somewhere in between. A third, “plasticity model”

suggests that two other models are extremes of the dynamic organization of complexes. In

this model, single complexes form supercomplexes and so called respirasomes

(supercomplexes additionally containing electron carriers CoQ or CytC, therefore able to

(21)

respire) (Acin-Perez et al., 2008). Whereas every complex can also be found freely in the IMM, mostly complex I seems to associate with other complexes in various combinations and proportions: CI+CIII, CI+CIII+CV, CI+CII+CIII+CIV or CI+CIII+CIV. However, the organization and physiological relevance of supercomplexes in vivo is still to be deciphered (for review see, (Enriquez and Lenaz, 2014)).

1.1.3 Mitochondrial genome 1.1.3.1 Organization

Given their common evolutionary origin, it is not surprising that mitochondria reveal similar genetic and cellular functions among eukaryotes. The most radical common development of mitochondrial genomes across taxa is that the majority of their native genes were transferred to the nucleus, where they are expressed to drive mitochondrial biogenesis or further cellular processes. Whereas the transfer event is indicated by the presence of protomitochondrial genes within the nuclear genome, it still remains unclear when, how and how often it occurred (Timmis et al., 2004). An extreme example of genome reduction can be observed in mitochondrion-related organelles, hydrogenosomes and mitosomes, which entirely lack mtDNA (for review see, (Gray, 2012)).

In all organisms that contain mitochondria, the initial mtDNA coding capacity was strongly downscaled with time. However, the outcome of this reduction shows remarkable variations in size, organization and expression among eukaryotes. In most animals it exists as a single, circular, double-stranded DNA molecule, but there are many examples of mtDNA organized as one or multiple, circular or linear chromosomes (for review, see (Gray et al., 1999; Nosek et al., 1998)). For example, mtDNA of Polytomella piriformis, colorless green alga, is divided into two linear chromosomes, the mitochondrial genome of Pediculus capitis, human head louse, is distributed on 20 circular chromosomes, each containing one to three genes (Shao et al., 2012; Smith et al., 2010). Further, the size of the chromosomes can be as small as 6 kb in protists from the Apicomplexa phylum, or as large as 1.6 Mb in Cucumis sativus, cucumber (Alverson et al., 2011; Hikosaka et al., 2010).

Following variations in size, also the gene content differs between species. Freshwater protist

(22)

Reclinomonas Americana leads the field with 97 mitochondrial genes, of which 65 are protein-coding (Lang et al., 1997).

In mammals, nuclear DNA is diploid. On the contrary, the maternally inherited mitochondrial content of a single cell can vary between 1.000 and 10.000 DNA molecules, especially high in energy demanding tissues like brain and skeletal muscles (Bogenhagen and Clayton, 1974; Masuyama et al., 2005; Miller et al., 2003). This polyploidy is governed by excessive mtDNA replication, potentially resulting in two states:

“heteroplasmy” and “homoplasmy”. While homoplasmic state implicates only identical mtDNA molecules within one cell, heteroplasmic cells harbor at least two different mtDNA variants. In principle, mtDNA molecules can be replicated multiple times or not at all, potentially allowing clonal expansion of a mutated mtDNA, outnumbering wild type variant. However, mutated mtDNA molecules have to exceed a certain threshold, usually 60%-90%, to become pathogenic (Trifunovic et al., 2004; Tuppen et al., 2010).

There are no histones in mitochondria to pack and protect the DNA as there are in the nucleus. Instead, mtDNA forms nucleoprotein complexes (nucleoids), with, inter alia, mitochondrial transcription factor A (TFAM), a high-mobility group-box (HMG) containing protein. Beyond its pivotal role in transcription and replication, TFAM bends mtDNA in a U-shape manner at unspecific sequences, thus protecting the otherwise naked DNA and providing structural basis for expression activities (for review, see (Kukat and Larsson, 2013)). Superresolution experiments estimated the approximate size of a nucleoid at 100nm, prevalently containing a single copy of mtDNA (Kukat et al., 2011).

The double helix contains two differently denoted strands, “heavy”

(H) and “light” (L). The nomenclature is based on the proportion of heavier G+T nucleotides leading to different sedimentation in denaturating alkaline cesium chloride gradients. Mammalian mtDNA contains 13 protein-coding genes, all subunits of OXPHOS system, 2 ribosomal rRNAs and 22 tRNAs, part of mitochondrial translation machinery (Figure 1.4). Notably, complex II subunits are exclusively encoded by nDNA. Intriguingly, whereas in the cytosol over 30 tRNAs are required to ensure amino acid specificity, in mitochondria only 22 tRNAs are used. This is due to the relaxed codon usage, when many mitochondrial tRNAs recognize any of the four nucleotides in the third anticodon position.

Moreover, the “universal” code is altered in mitochondria leading to different “meanings” in

4 out of 64 codons (Alberts et al., 2002).

(23)

Dense gene packing and absence of introns characterize animal mtDNA, with few exceptions in some Cnidaria species (Beagley et al., 1996). Since coding sequences directly follow each other, little room is left for DNA regulatory sequences (Alberts et al., 2002). The major non-coding region is the 1kb large displacement loop (D-loop) that harbors important regulatory elements for replication and transcription. It contains promoters for light (LSP) and heavy strand (HSP) transcription, origins of heavy strand replication (O

H

) and termination-associated sequences (for review, see (Falkenberg et al., 2007)).

Figure 1.4 Structures of human and C. elegans mtDNA

Human genome contains 37 genes: 13 protein-coding genes, subunits of Complex I (ND1, ND2, ND3, ND4L, ND4, ND5, ND6), III (cyt b), IV (Cox1, Cox2, Cox3) and V (ATP6, ATP8), 2 ribosomal RNAs (12S rRNA, 16rRNA) and 22 tRNAs, indicated by single letter code for corresponding amino acid. The “D-loop” region contains replication and transcription promoter sequences. C. elegans mtDNA differs by the arrangement of the genes and the lack of ATP8. Images courtesy of Ivana Bratic Hench.

1.1.3.2 mtDNA transcription

In mammals there are three main transcription promoters: LSP and

HSP1, residing around 150 bp from each other in the D-loop region, and HSP2 located

between HSP1 and 12S rRNA gene (Figure 1.3). Transcription from LSP and HSP2 results

in polycistronic precursor RNAs covering the entire coding portion of the light and heavy

strand respectively. Thus, the HSP2 initiated transcript corresponds to 2 rRNA, 12 protein-

coding and 14 tRNA genes, while LSP1 to 1 protein-coding and 8 tRNA genes. However,

(24)

HSP1 was found to be terminated at the end of the 16S rRNA gene, predominantly generating 12S and 16S rRNA (Montoya et al., 1983). The “tRNA punctuation” model implies that tRNA genes flank all protein and ribosomal genes, therefore their excision from polycistronic transcripts is necessary to produce mature mRNAs and rRNAs (Ojala et al., 1981).

The mammalian basic transcription machinery requires a specific set of proteins that is different from that of nuclear DNA. It includes mitochondrial DNA- directed RNA polymerase (POLRMT), TFAM and one of the two mitochondrial transcription factor B paralogs (TFB1M or TFB2M), all necessary and sufficient for transcription (Falkenberg et al., 2002; Shi et al., 2012). TFAM not only unspecifically wraps mtDNA but also specifically binds upstream of LSP and HSP1 transcription promoters (Fisher et al., 1987; Gaspari et al., 2004). The exact position of the binding sites within promoter region may imply that TFAM binding results in partial unwinding of mtDNA allowing transcription. The C-terminal tail region of TFAM interacts with the heterodimeric POLRMT:TFB2M(TFB1M) complex, thereby recruited to the initiation site. TFB1M and TFB2M additionally function as rRNA methyltransferases, whereas TFB1M is suggested to be highly active as methyltransferase and TFB2M as a transcription factor (for review, see (Falkenberg et al., 2007)).

Further mtDNA transcription is regulated by a family of mitochondrial transcription termination factor (MTERF) proteins: MTERF1-4. MTERF1 and MTERF2 are unique to vertebrates, while MTERF3 and MTERF4 are highly conserved among different phyla and can be also found in C. elegans (Linder et al., 2005). Initially MTERF1 was proposed to regulate mitochondrial ribosome biogenesis due to its binding downstream of rRNA genes and MTERF3 to generally repress transcription initiation (Fernandez-Silva et al., 1997; Park et al., 2007). However, a more recent study suggests that MTERF1 does not regulate heavy strand promoter activity but rather reduces light strand transcription to prevent transcriptional interference at the LSP (Terzioglu et al., 2013).

1.1.3.3 mtDNA replication

Mitochondrial DNA can be replicated independent of cell cycle and

in non-dividing cells (Bogenhagen and Clayton, 1974). Similar to transcription machinery,

(25)

replication machinery is also specific to mitochondria. In vitro studies of minimal mammalian mtDNA replisome revealed three proteins required for sufficient replication:

mitochondrial DNA polymerase γ (POL γ ), mitochondrial TWINKLE helicase and mitochondrial single-stranded DNA binding protein (SSBP1 or mtSSB) (Korhonen et al., 2004). POL γ and TWINKLE are capable of using a double stranded template and generating DNA molecules of 2kb length. While TWINKLE unwinds the mtDNA duplex in an ATP dependent manner, SSBP1 coats the single strands in tetrameric fashion facilitating the opening and unwinding. Addition of SSBP1 further stimulates TWINKLE helicase activity leading to products of 16 kb of size, which corresponds to the full-length mtDNA (Korhonen et al., 2003).

Studies in mice revealed that RNA primers generated during LSP transcription are simultaneously required for replication at O

H

, suggesting that the initiation process for replication and transcription is the same and that the mechanism distinguishing DNA or RNA synthesis is subject to downstream events (Brown et al., 2008; Chang et al., 1985). The initial “strand displacement” or “asynchronous” model implicates that the unidirectional replication from O

H

displaces the parental heavy strand and after approximately two-thirds of the molecule exposes the origin of light strand replication (O

L

) on the displaced H-strand, so that lagging strand synthesis is initiated in the opposite direction (Kasamatsu and Vinograd, 1973). The model suggests that the lagging strand synthesis is continuous, without repeated priming (Larsson, 2010). The O

L

resides in a 30 bp region within five tRNAs genes and is therefore called WANCY region (Figure 1.4). The segregation of daughter molecules occurs once H-strand synthesis is finished, leaving one daughter cell intermediate with an incompletely synthesized L-strand (Robberson et al., 1972).

On the contrary, the “strand coupled” model suggests that H- and

L- strands are replicated simultaneously, initiated near the O

H

in the D-loop region (Holt et

al., 2000; Yang et al., 2002). Discovery of multiple RNA:DNA hybrids, representing

ribonucleotide incorporation on the replicating lagging strand, gave rise to the RITOLS

(ribonucleotide incorporation throughout the lagging strand) replication mode, suggesting

that the lagging strand is initially incorporated RNA, before subsequent conversion to DNA

(Yang et al., 2002; Yasukawa et al., 2006). Data for this model was gained from employing

neutral/neutral two-dimensional agarose gel electrophoresis (2D AGE), allowing for DNA

(26)

molecules to be distinguished according to size and strand configuration. Later, 2D AGE was used to reexamine the “asynchronous” model, suggesting that the RNA:DNA represent alternative replication origins for L-strand synthesis and that the “strand displacement” is the predominant mode of mtDNA replication (Brown et al., 2005). Overall it is not fully clear which is the mtDNA replication mode in mammals, possibly a combination of the two described or even more. Furthermore, little is known about the termination mechanism beyond its location or the precise relationship between replication and transcription.

Eventually, discovery of new enzymes is expected to shed light onto mtDNA replication mechanics (Holt and Reyes, 2012).

However, so far investigation of mtDNA replication mechanisms was largely conducted in mammals. A recently published study in C. elegans suggests that in nematodes the replicating mtDNA appears as a lasso like structure with concatemeric (containing multiple DNA copies) tails, which are predicted to be eventually resolved in monomeric circles (Lewis et al., 2015). This replication mechanism is similar to the one from phages and given that POL γ and TWINKLE are believed to be derived from bacteriophages, among metazoans C. elegans may represent the ancestral mtDNA replication mode (for review, see (Shutt and Gray, 2006)).

1.2 Aging

“How old would you be if you didn’t know how old you are?”

- Leroy Robert “Satchel” Paige, baseball player, July 9, 1948

“Aging” and “senescence” are terms universally used to describe what happens to an organism in the course of time. However, there is still no uniform scientific definition of “aging” and no consensus which components the definition should consider and which it should exclude. One of the phrasings describes aging as “deteriorative changes with time during post maturational life that underlie an increasing vulnerability to challenges, thereby decreasing the ability of the organism to survive” (Masoro, 1997).

Though aging is broadly perceived as a function of time, time itself only imperfectly

correlates with the physiological processes involved in aging and therefore should become an

(27)

independent parameter in biogerontology (Arking and Dudas, 1989). This seems reasonable, when for example two individuals from the same species and of the same chronological age reveal two different physiological states. Instead, three main conditions were suggested to characterize aging: they must be (i) deleterious, (ii) progressive and (iii) intrinsic (Strehler, 1982). There are only two basic ways in which aging can occur: according to a predetermined genetically driven program or due to random, accidental events (Hayflick, 2007). This duality gave rise to two major sets of aging theories: stochastic and systemic ones.

Stochastic theories describe aging in the light of thermodynamics.

Condensed energy tends to disperse and to reach the state of energetic equilibrium within the system. Living organisms are constantly but randomly attacked by a variety of degenerative events and processes increasing entropy that may negatively affect functionality of biological molecules. This can be antagonized by cellular internal mechanisms and repair systems. Therefore, the aging process occurs because the energetic level of molecules shifts towards inactive or malfunctioning, and internal repair systems fail to counteract energy dispersal any more (Hayflick, 2007). Various theories suggest different explanations for aging, like increased somatic DNA mutations, telomere loss or accumulation of damaged proteins, just to name a few (for review, see (Kirkwood, 2005)).

However, systemic theories describe aging as a genetically programmed process. Whereas the theories vary in the number of specific genes and mechanisms driving aging, they all have in common the genetic basis of senescence.

Nevertheless, they are not entirely deterministic as environmental impact is considered to

some extent (Arking, 1998). It also becomes more obvious that organisms are programmed

to survive rather than to die (Kirkwood, 2005). Still, multiple genetic interventions were

shown to modulate lifespan of different organisms: inhibition of insulin/insulin-like growth

factor 1 (IGF1), target of rapamycin (TOR) signaling and modest inhibition of respiration

all increased lifespan in worms, flies and mice (for review, see (Kenyon, 2010)). Though

these interventions prolong lifespan, they do not give an answer to the question of what

causes aging. Deciphering mechanisms responsible for lifespan determination rather

contribute to our understanding of longevity that is not equal to aging, as length of life

describes its endpoint rather than the age-associated changes (Hayflick, 2007).

(28)

1.2.1 Mitochondrial Free Radical Theory of Aging

Almost 60 years ago Denham Harman proposed the free radical theory of aging, suggesting that aging, as well as the associated degenerative diseases, could be attributed to the deleterious effects of reactive oxygen species (ROS) on various cell compartments (Harman, 1956). As ROS are mainly produced just off the mitochondrial electron transport chain, mitochondria were later declared as a prime target for oxidative damage (Harman, 1972). Hence the free radical theory evolved into mitochondrial free radical theory of aging (MFRTA).

In the course of time, substantial evidence has emerged from various studies to lend support to this theory. It has been shown that mitochondria become larger and less numerous with age, accumulating vacuoles and cristae abnormalities (Frenzel and Feimann, 1984). In aging humans the oxidative phosphorylation capacity has been reported to decline in skeletal muscle, liver, heart and brain (Cottrell and Turnbull, 2000). Potential differences in enzymatic activities of single ETC complexes could negatively affect oxidative phosphorylation and hence promote ROS production (Kwong and Sohal, 2000). Studies in flies, worms and mammals have shown that aging is associated with increased amounts of mtDNA deletions and/or point mutations (Gadaleta et al., 1992; Lee et al., 1993; Melov et al., 1995; Piko et al., 1988; Yui et al., 2003). These mtDNA rearrangements appear to occur principally in post-mitotic tissues and their accumulation with age is a consistent feature of senescent multicellular animals (Melov et al., 1999).

More recent studies have shown that the accumulation of mitochondrial dysfunctions in aging tissues is not uniform and it is generally believed, that just a subset of cells accumulate mtDNA mutations over the threshold levels. For example the number of COX deficient cells progressively increases in skeletal and cardiac muscle and brain of elder individuals (Cottrell et al., 2001; Muller-Hocker, 1989, 1990). However, the relevance of mtDNA mutations in aging organisms is still controversial, as most of these data have been seen as a consequence rather than a driving force of aging.

1.2.2 The mtDNA mutator mouse

The first causative link between mtDNA point mutations and an

(29)

aging phenotype in mammals was provided by the mtDNA mutator mouse model, which expresses a proofreading deficient form of the nDNA-encoded mitochondrial DNA polymerase γ (Trifunovic et al., 2004). POL γ is uniquely responsible for both mtDNA replication and repair (Kaguni, 2004). Moreover, it has been shown that it is absolutely essential for mammalian embryogenesis (Hance et al., 2005). The proofreading deficiency was introduced to promote progressive, random accumulation of mtDNA mutations during the course of mitochondrial biogenesis and such homozygous knock in mice developed a mtDNA mutator phenotype with a three to fivefold increase in the levels of point mutations.

The mtDNA mutator mice developed normally from birth to early adolescence but subsequently acquired some features of premature aging such as weight loss, reduced subcutaneous fat, alopecia, kyphosis, osteoporosis, anemia with progressive decrease in circulating red blood cells, reduced fertility, cardiomyopathy and sarcopenia (Trifunovic et al., 2004). In contrast to the mitochondrial theory of aging, mutator mice did not reveal increased ROS production or increased oxidative stress (Trifunovic et al., 2005). According to the “Vicious cycle” theory, mtDNA mutations accumulate exponentially during life, leading to impaired oxidative phosphorylation activity (Bandy and Davison, 1990). However mutator mice accumulated mutations proportionally and their load was already substantial very early in embryonic life, most likely due to extensive mtDNA replication (Trifunovic et al., 2005). The linear fashion of mtDNA mutation accumulation suggests no involvement of a vicious cycle as proposed by the mitochondrial theory of aging. It seems that the onset of premature ageing is not accompanied by a large de novo accumulation of mtDNA mutations, but is rather due to cumulative physiological damage caused by the high mutation load during adult life, and/or to segregation or clonal expansion of specific mutations. Still, it is possible that the mutation load might be an underestimate because cells with the highest levels of deleterious mutations may be lost due to cell death and/or replicative disadvantage.

1.3 Regulation of mitochondrial biogenesis in mammals

Mitochondrial biogenesis represents complex physiological process

that implicates growth of pre-existing mitochondria, requiring synthesis and for the vast

majority also import of mitochondrial proteins into the organelle, delivery of lipids to

(30)

mitochondrial membranes and mtDNA replication. Notably, mitochondrial mass, organization and function vary between different cell types and are dynamically adapted to environmental and intracellular stimuli. While mitochondrial biogenesis serves as long-term adaptation, transient energetic or metabolic requirements can be met by adjusted expression of a corresponding subset of nDNA-encoded mitochondrial genes (Hock and Kralli, 2009).

As the nuclear genome harbors most of the genes with regard to mitochondrial function, nuclear factors are designated to orchestrate their expression. In 1989, analysis of mammalian cytochrome c promoter revealed specific nuclear factor binding sites. The corresponding nuclear respiratory factor 1 (NRF-1) was proposed to control expression of nDNA-encoded mitochondrial genes in addition to housekeeping transcription factors (Evans and Scarpulla, 1989). Ever since further genes and factors were identified to be involved in regulation of mitochondrial biogenesis, some of which are presented below (for review, see (Kelly and Scarpulla, 2004; Scarpulla, 2008)).

1.3.1 Nuclear transcription factors

NRF-1/2: Palindromic binding sites of NRF-1 are most frequently found in proximal promoters of ubiquitously expressed genes, however presence of regulatory elements does not necessarily means biological relevance (FitzGerald et al., 2004). Human NRF-1 was found to occupy promoter elements of 691 genes, many of which are mitochondria-related, representing OXPHOS enzymes, mitochondrial translation, transcription and import machineries (Cam et al., 2004). More recent analysis employing Chromatin ImmunoPrecipitation followed by deep sequencing (ChIP-seq) identified 2.470 NRF-1 target genes in human neuroblastoma cells, underlying its central role in regulation of mitochondrial biogenesis, but also extra-mitochondrial processes such as cell cycle progression, DNA damage repair or RNA metabolism (Satoh et al., 2013). NRF-1 exerts its positive regulatory activity on transcription as a homodimer, with multiple phosphorylatable serine residues, which enhance its binding and trans-activation functions (Gugneja and Scarpulla, 1997). Phosphorylation of NRF-1 is induced in quiescent fibroblasts upon serum exposure and in hepatoma cells upon exposure to exogenous oxidants (Herzig et al., 2000;

Piantadosi and Suliman, 2006).

(31)

Human NRF-2 (homolog of murine GA-binding protein (GABP)) acts as heterodimer consisting of two α and two β subunits. Initially it was shown to bind essential elements in the gene encoding the cytochrome oxidase subunit IV (COXIV). Later NRF-2, along with NRF-1, was proposed to regulate all 10 nDNA-encoded COX subunits (Ongwijitwat and Wong-Riley, 2005). Neuronal stimulation by depolarization is suggested to induce NRF-2 translocation from the cytoplasm to the nucleus, thereby facilitating its transcriptional activity (Yang et al., 2004; Zhang and Wong-Riley, 2000). Apart from regulation of COX genes, NRF-2 binding elements were discovered in cis-regulatory elements of other nDNA-encoded mitochondrial genes, e.g. complex II subunits and mtDNA transcription machinery. Whereas both, NRF-1 and NRF-2 binding sites, can frequently be found in the proximal promoters of mitochondrial genes, some genes reveal either NRF-1 or NRF-2, which can also differ between rodents and humans (for review, see (Kelly and Scarpulla, 2004)). Together NRF-1 and NRF-2 directly control expression of nDNA- encoded OXPHOS subunits and genes involved in mitochondrial transcription, offering a mechanism for bigenomic transcriptional control (Figure 1.5).

PPAR α / β (or δ )/ γ : Peroxisome-proliferator activated receptor α (PPAR α) was the first nuclear receptor, shown to regulate mitochondrial metabolism.

Originally implicated in peroxisomal fatty acid oxidation (FAO), now PPARs are known to transcriptionally control mitochondrial FAO enzymes (for review, see (Madrazo and Kelly, 2008)). FAO enzymes act within the mitochondrial matrix, oxidizing fatty acids to Acetyl Coenzyme A (Acetyl-CoA), which is fed into the TCA cycle, generating energy-rich intermediates, which provide electrons for the ETC. PPAR α is predominantly enriched in tissues with high FAO capacity such as heart, liver or brown adipose tissue. The PPAR family is completed by ubiquitously expressed PPAR β (also known as δ ) also participating in FAO and adipose-enriched PPAR γ that directs programs involved in adipocyte differentiation and fat storage (Figure 1.5). PPARs reveal different but overlapping spatial and temporal expression patterns. Upon binding their ligand, PPARs form heterodimers with retinoid X receptor (RXR) and occupy cognate DNA response elements. Next to ligand-mediated activation, PPARs are activated by endogenously produced ligands regulated by transcriptional coactivators and corepressors.

ERR α / β / γ : The second family of nuclear receptors consists of

estrogen related receptors (ERR). Structural characteristics have determined their

(32)

nomenclature, however classic estrogens do not activate them. Similar to PPARs, high levels of ERR α were initially shown to activate expression of FAO enzymes in oxidative tissues like heart, kidney and brown fat (Sladek et al., 1997; Vega and Kelly, 1997). Later, studies on heart and skeletal muscle revealed that ERRs regulate the expression of genes involved in effectively all mitochondrial energy producing pathways (Huss et al., 2004) (Figure 1.5). As nonobligatory heterodimers ERR α and ERR γ occupy promoters of genes involved in TCA, FAO and OXPHOS, which additionally reveal NRF-1 and cAMP response element-binding protein (CREB) binding sites (Dufour et al., 2007).

CREB, SP1 and YY1: In addition to the NRF-1 binding site, cytochrome c gene revealed recognition sites for common transcriptional activators:

specificity protein 1 (SP1) and CREB (Evans and Scarpulla, 1989). Phosphorylation of CREB determines its activity and is critical for its interaction with PRC and NRF-1 (Vercauteren et al., 2006). It appears that CREB function is required for rapid cytochrome c response to cyclic adenosine monophosphate (cAMP) and to serum-stimulated cell growth (Gopalakrishnan and Scarpulla, 1994; Herzig et al., 2000). However CREB binding sites do not represent common promoter elements of nDNA-encoded mitochondrial genes (Scarpulla, 2008) (Figure 1.5).

Next to cytochrome c, SP1 is involved in transcriptional regulation of cytochrome c

1

(subunit of complex III) and adenine nucleotide translocase 1 (ANT1), both lacking NRF binding sites (Li et al., 1996a; Li et al., 1996b). The number and organization of GC box binding sites for SP1 determine its contribution to transcriptional activity, which can also be repressing (Zaid et al., 1999). More recent studies in mice show Sp1 family members mediated transcriptional regulation of all thirteen genes encoding cytochrome c oxidase subunits (Dhar et al., 2013; Johar et al., 2013). Similar to NRFs, transcriptional regulation of the three mtDNA-encoded COX genes is indirect via expression of control genes involved in mtDNA transcription.

The ubiquitous Ying Yang 1 (YY1) transcription factor was initially

reported to be involved in regulation of mammalian COX gene expression (Figure 1.5). The

promoter region of murine Cox5b contains three YY1 binding elements and appears to be

suppressed by the presence of YY1 (Basu et al., 1997). However, the minimal promoter of

bovine COX7B contains two YY1 binding elements, which are essential for promoter activity

(Seelan and Grossman, 1997). Yet it remains to be deciphered, which mechanisms underlie

(33)

the dual function of YY1. Nevertheless, more recent studies not only show that YY1 binding motifs are enriched in a variety of mitochondrial genes regulated by rapamycin and PGC-1 α , but also that YY1 function is required for mammalian TOR-mediated control of mitochondrial function (Cunningham et al., 2007). Moreover skeletal-muscle-specific YY1 knockout mice reveal decreased levels of nDNA-encoded mitochondrial gene transcripts resulting in bioenergetics deficiencies, accompanied by reduced OXPHOS protein levels and impaired respiratory activity (Blattler et al., 2012).

1.3.2 Nuclear coactivators

Over the years accumulating data suggests that a manageable number of transcription factors, including the aforementioned ones, directly regulate expression of nDNA-encoded mitochondrial genes. Moreover, they appear to indirectly regulate mtDNA expression and maintenance by activating transcription of nuclear genes composing respective machineries. Consequently the question arises, how activities of various transcription factors are coordinated to enable mitochondrial biogenesis regulation. The discovery of PGC-1 family of coactivators has offered one possible mechanism integrating physiological stimuli and orchestration of transcription activity in vertebrates.

Initially, the name giving interaction of PPAR γ coactivator-1 α

(PGC-1 α ) with PPAR γ was observed in murine brown adipose tissue, pointing toward cold-

induced PGC-1 α activity as a requirement for adaptive thermogenesis (Puigserver et al.,

1998). In this study PGC-1 α was shown to induce expression of uncoupling protein-1

(Ucp-1), indicating promoted uncoupled respiration to generate heat. Soon after, PGC-1 α

was reported to coactivate NRF-1, NRF-2 and PPAR α (Vega et al., 2000; Wu et al., 1999)

(Figure 1.5). Based on the structural similarity to PGC-1 α , identification of PGC-1 β and

PGC-related coactivator (PRC) has completed the PGC-1 family (Andersson and Scarpulla,

2001; Kressler et al., 2002; Lin et al., 2002). Generally, PGC-1 family members bind to the

respective transcription factor, and are thereby recruited to the transcription site of the target

gene. At the same time PGC-1 recruits histone acetyltransferases and the Mediator complex

to enhance transcription initiation (Hock and Kralli, 2009). The critical feature of these

coactivators is their high versatility in interacting with distinct transcription factors,

including NRF-1/2, PPARs, ERRs and YY1 (Figure 1.4). This allows them to activate

(34)

different biological programs in a tissue specific manner (for review, see (Lin et al., 2005)).

In mitochondria-rich tissues like heart, brown fat and muscles, expression of PGC-1 α is strongly induced upon cold exposure and short-term exercise, resulting in increased expression of mitochondrial genes (Baar et al., 2002; Lehman et al., 2000; Wu et al., 1999).

Importantly, mice lacking only PGC-1 α or only PGC-1 β are viable, showing modest decrease in mitochondrial gene expression (Lelliott et al., 2006; Lin et al., 2004). However PGC-1 αβ double knockout animals die shortly after birth, with severe cardiac dysfunction and abnormalities in brown adipose tissue, suggesting at least partial functional redundancy between PGC-1 α and PGC-1 β (Lai et al., 2008).

This level of mitochondrial-nuclear communication integrates distinct physiological stimuli like cold exposure, caloric intake or exercise, which stimulate mitochondrial biogenesis through PGC-1 activity. Transcriptional and posttranscriptional control mechanisms of PGC-1 α add further plasticity to the biogenic response (for review, see (Ryan and Hoogenraad, 2007)). External temperature decrease can be sensed by β - adrenergic receptors, which transduce the signal via cAMP pathway, eventually leading to transcriptional activation of PGC-1 α (Puigserver et al., 1998). Another case of mitochondrial biogenesis upregulation can be observed in long-term exercising mice. Muscular energy deprivation is sensed by AMP activated kinase (AMPK) which activates calcium/calmodulin- dependent protein kinase IV (CaMK IV), eventually enhancing Pgc-1 α expression (Schaeffer et al., 2004; Zong et al., 2002). On the posttranscriptional level, for example, mitogen- activated protein kinases (MAPK) transmit extracellular signals, such as chemical and physical stress, into intracellular responses (for review, see (Cargnello and Roux, 2011)). One member of MAPK family, p38 MAPK, has been shown to stabilize PGC-1 α by phosphorylation, thereby extending its half-life from ~2 to ~6 hours (Knutti et al., 2001;

Puigserver et al., 2001). In response to cytokines, p38 MAPK activated PGC-1 α targeted nDNA-encoded mitochondrial gene expression in muscle cells (Puigserver et al., 2001).

Another example is the lysine deacetylase sirtuin 1 (SIRT-1) that is induced in response to

fasting signals and consequently acetylates PGC-1 α (Rodgers et al., 2005). Notably, in

contrast to p30 MAPK, SIRT-1 regulates PGC-1 α activity targeting genes with

gluconeogenic but not mitochondrial function. The mentioned examples by far do not cover

all facets of how PGC-1 family members are regulated on genetic and protein levels.

Abbildung

Figure 1.1 Mitochondrial architecture
Figure 1.2 Respiratory chain
Figure 1.3 Fluid, solid and plasticity models of OXPHOS complexes organization
Figure 1.4 Structures of human and C. elegans mtDNA
+7

Referenzen

ÄHNLICHE DOKUMENTE

Consistently, we found that 38 deletion mutants lack- ing genes required for mitochondrial protein synthesis failed to maintain a functional [ARG8 m ] genome – this is by far

die Möglichkeit eines vermehrten Parasitenwachstums auch unter Inhibition in Betracht gezogen werden musste, wurde für diese Versuche eine niedrigere Toxoplasmenzahl von 2,5x10 4

Figure 51| Mechanism of lysosomal-mitochondrial crosstalk in Pompe’s disease – Chronic lysosomal malfunction impairs iron homeostasis resulting in functional iron deficiency, which

The germline of Caenorhabditis elegans has been used as a model system to study the control of pluripotency in germ cells: through the mean of a genetic screen, from which most of

In mammalian cells, mTOR positively regulates protein synthesis in part by modulating the activities of components of the translational machinery, including the 40S

Mitochondrial respiration in Antarctic octopods has never been analysed, and other studies on cephalopod mitochondrial capacities are scarce (but see Mommsen and Hochachka,..

The mechanisms, whereby the PD-related mitochondrial kinase Pink1 initiates the autophagic removal of defective mitochondria via the recruitment and activation of Parkin,

Figure 2: Mitochondrial complex I deficiency results in increase of branching of C. elegans sensory neurons. a) Representative confocal images (left panel) and their