Records statistics
beyond the standard model -
Theory and applications
Inauguraldissertation
zur Erlangung des Doktorgrades der
Mathematisch-Naturwissenschaftlichen Fakult¨ at der Universit¨ at zu K¨ oln
vorgelegt von
Gregor Wergen
aus K¨ oln
K¨ oln 2013
Prof. Dr. Alexander Altland
Prof. Dr. Thomas Guhr
(Universit¨at Duisburg-Essen)
Tag der m¨undlichen Pr¨ufung: 15.01.2013
iii Diese Dissertation wurde gem¨aß der Promotionsordnung der Mathematisch-
Naturwissenschaftlichen Fakult¨at der Universit¨at zu K¨oln in kumulativer
Form angefertigt. Eine Liste der Ver¨offentlichungen, die in diese Dissertation
eingebunden sind, ist auf Seite ix abgedruckt. Weiterhin findet sich auf Seite
281 eine Zusammenfassung meiner Beteiligungen zu diesen Ver¨offentlichungen.
v
Zusammenfassung
Die Statistik von Rekordereignissen ist in den letzten Jahren auf ste- tig wachsendes Interesse sowohl von Seiten der Wissenschaft als auch der gesamten ¨ Offentlichkeit gestoßen. Nicht nur im Sport und in der Klimatologie wird das Setzen und Brechen neuer Rekorde beobachtet, auch in der Natur und in der Wirtschaft sorgen sie immer wieder f¨ ur Aufmerksamkeit. Diese kumulative Dissertation ist der Studie von Rekordereignissen gewidmet und fasst eine Reihe von Arbeiten zur Theorie und Anwendung der Rekordstatistik zusammen. Sie besteht, im Wesentlichen, aus f¨unf Teilen. Im ersten Teil wird die Statistik von Rekorden in unkorrelierten Zufallszahlen aus zeitabh¨angigen Vertei- lungen untersucht. Insbesondere wird ein einfaches Modell von Zu- fallszahlen mit einem linearen Drift im Mittelwert vorgestellt und ausf¨uhrlich in Hinblick auf Rekorde untersucht. Weiterhin gehen wir auf die Rolle von Diskretheitseffekten in der Rekordstatistik von Messdaten ein. Anschliessend, in Teil zwei, werden diese Arbeiten angewendet um das Auftreten von Rekordtemperaturen und deren Zusammenhang mit dem Klimawandel zu erkl¨aren. Aufbauend auf unser einfaches Modell von Zufallszahlen mit linearem Drift wird de- monstriert, dass die globale Erw¨armung einen signifikanten Einfluß auf die Zahl und die Auspr¨agung von Hitze- und K¨alterekorden hat.
Der dritte Teil befasst sich mit Rekorden in korrelierten Prozessen,
sogenannten Random Walks. Es werden verschiedene Random-Walk-
artige Prozesse untersucht, die Rekordstatistik dieser Prozesse ist er-
staunlich vielf¨altig und interessant. Die vorgestellten Resultate sind
wiederum wichtig um die Rekordstatistik von Finanzdaten verstehen
zu k¨onnen, die im vierten Teil diskutiert wird. Random Walks sind
ein hilfreiches Mittel um Rekorde in B¨orsendaten zu beschreiben,
wir finden jedoch auch signifikante Abweichungen von diesem Mo-
dell und betrachten kompliziertere Prozesse um die Modellierung zu
verbessern. Im abschließenden, f¨unften Teil werden die j¨ungeren Ent-
wicklungen auf dem Gebiet der Rekordstatistik von zeitabh¨angigen
und korrelierten Zufallszahlen in einem Review zusammengefasst.
vii
Abstract
In recent years, there was a surge of interest in the statistics of
record-breaking events, not only from scientists, but also from the
general public. In sports and in climatology, but also in nature and
in economy, observers are interested in the setting and breaking of
new records. This cumulative dissertation is dedicated to the study
of record-breaking events. It concludes a series of published and
hitherto unpublished articles on theory and applications of record
statistics. This work mainly consists of five parts. The first part is
about the statistics of records in uncorrelated random variables sam-
pled from time-dependent distributions. In particular, we present a
simple model of random variables with a linearly growing mean value
and discuss its record statistics thoroughly. Furthermore, the effects
of rounding on the occurrence of records in series of independent
and identically distributed random variables are considered. Then,
in part two, these results are applied to explain and model record
temperatures in the context of climatic change. Using our minimal
model of random variables with a linear drift, we show that global
warming has in fact a significant effect on the occurrence and the
values of heat and cold records. The third part focuses on records
in correlated processes, in particular random walks. A number of
different random walk processes are presented and analyzed. We
find that their record statistics are surprisingly interesting and man-
ifold. The results derived in this part are important to understand
the occurrence of records in financial data, which will be discussed
in the fourth part. There it is demonstrated that random walks are
helpful to model records in stock data, nevertheless we find signifi-
cant deviations from the analytical results and propose an alterna-
tive model, which describes the stock data more accurately. The
final, fifth part is a general review of the recent developments in the
study of record-breaking events in time series of time-dependent and
correlated random variables.
ix
Published contributions
The following contributions in this thesis are hitherto published in peer-reviewed journals (in chronological order of their publication):
1. Jasper Franke, Gregor Wergen and Joachim Krug, Records and sequences of records from random variables with a linear trend,
J. Stat. Mech.: Theor. Exp. P10013 (13 October 2010) Chapter 3, pp. 27
2. Gregor Wergen and Joachim Krug,
Record-breaking temperatures reveal a warming climate, EPL 92, 30008 (29 November 2010)
Chapter 7, pp. 81
3. Gregor Wergen, Miro Bogner and Joachim Krug, Record statistics for biased random walks, with an application to financial data, Phys. Rev. E 83, 051109 (9 May 2011) Chapter 9, pp. 117
4. Gregor Wergen, Jasper Franke and Joachim Krug, Correlations between record events in sequences of random variables with a linear trend,
J. Stat. Phys. 144, 1206 (5 August 2011) Chapter 4, pp. 47
5. Jasper Franke, Gregor Wergen and Joachim Krug, Correlations of record events as a test for heavy-tailed distributions,
Phys. Rev. Lett. 108, 064101 (7 February 2012) Chapter 5, pp. 63
6. Gregor Wergen, Satya N. Majumdar and Gr´egory Schehr, Record statistics for multiple random walks,
Phys. Rev. E 86, 011119 (18 July 2012) Chapter 11, pp. 173
7. Satya N. Majumdar, Gr´egory Schehr and Gregor Wergen, Record statistics and persistence for a random walk with a drift, J. Phys. A: Math. Theor. 45, 355002 (15 August 2012)
Chapter 10, pp. 129
8. Gregor Wergen, Daniel Volovik, Sidney Redner and Joachim Krug, Rounding effects in record statistics,
Phys. Rev. Lett. 109, 164102 (19 October 2012)
Chapter 6, pp. 71
xi
Additional unpublished contributions
Except for the introductory part (chapters 1 and 2), as well as the summary (chapter 14) of this dissertation the following contributions are unpublished at the time of publication of this thesis:
1. Gregor Wergen, Andreas Hense and Joachim Krug, Record occurrence and record values in daily and monthly temperatures,
(submitted to Climate Dynamics, arXiv:1210.5416) Chapter 8, pp. 93
2. Gregor Wergen,
Modeling record-breaking stock prices (in preparation)
Chapter 12, pp. 205 3. Gregor Wergen,
Record statistics beyond the standard model - Theory and applications
(submitted to J. Phys. A.: Math. Theor., arxiv:1211:6005)
Chapter 13, pp. 231
xiii
Contents
Kurzzusammenfassung (deutsch) iii
Abstract v
List of contributions ix
1 Introduction 1
1.1 Record statistics of i.i.d. RV’s . . . . 5
1.2 Record statistics of symmetric random walks . . . . 12
1.3 Recent theoretical progress & applications . . . . 14
2 Outline 17 2.1 Part I - Records in uncorrelated random variables . . . . 17
2.2 Part II - Record-breaking temperatures . . . . 19
2.3 Part III - Record statistics of random walks . . . . 20
2.4 Part IV - Records in finance . . . . 22
2.5 Part V - Record statistics - A review . . . . 23
I Records in uncorrelated random variables 25 3 Records and sequences of records from random variables with a linear trend 27 3.1 Introduction. . . . 28
3.2 General theory and an exactly solvable example . . . . 30
3.3 Record statistics for small drift . . . . 32
3.4 Record statistics for large drift . . . . 39
3.5 Conclusions . . . . 41
4 Correlations between record events in sequences of random variables with a linear trend 47 4.1 Introduction. . . . 48
4.2 General theory . . . . 49
4.3 Explicit examples . . . . 54
4.4 Conclusion . . . . 60
5 Correlations of record events as a test for heavy-tailed distributions 63 5.1 Introduction. . . . 64
5.2 Record statistics and record correlations . . . . 64
5.3 Description of the test . . . . 66
5.4 Fluctuations. . . . 67
5.5 Application . . . . 67
5.6 Summary . . . . 68
6 Rounding effects in record statistics 71
6.1 Introduction. . . . 72
6.2 General theory, asymptotic results. . . . 73
6.3 Small-∆ regime . . . . 74
6.4 Large-∆ regime . . . . 75
6.5 Conclusions . . . . 76
II Record-breaking temperatures 79 7 Record-breaking temperatures reveal a warming climate 81 7.1 Introduction. . . . 82
7.2 Theory . . . . 83
7.3 European data . . . . 83
7.4 American data and discreteness effects . . . . 88
7.5 Re-analysis data . . . . 89
7.6 Conclusions . . . . 89
8 Record occurrence and record values in daily & monthly temperatures 93 8.1 Introduction. . . . 94
8.2 Theory: Record occurrence in the presence of linear drift . . . . 96
8.3 General introduction of the data . . . . 98
8.4 Occurrence of records in daily and monthly temperatures . . . . 101
8.5 Theory: Distributions of record values . . . . 103
8.6 Distributions of record values in European temperature recordings . . . 105
8.7 Discussion and conclusion . . . . 111
III Record statistics of random walks 115 9 Record statistics for biased random walks, with an application to financial data 117 9.1 Introduction. . . . 118
9.2 Survival probabilities & first passage times . . . . 119
9.3 Gaussian random walks with drift . . . . 121
9.4 Record statistics of stock prices in the S&P 500 . . . . 124
9.5 Summary . . . . 126
10 Record statistics and persistence for a random walk with a drift 129 10.1 Introduction. . . . 130
10.2 Record statistics for random walks: Review & new results . . . . 132
10.3 Record number distribution via renewal property . . . . 139
10.4 Asymptotic behavior of persistence Q(n) for large n . . . . 141
10.5 Asymptotic record number distribution P (R, n) for large n. . . . 147
10.6 Extreme statistics of the age of a record . . . . 157
10.7 Conclusion . . . . 167
11 Record statistics for multiple random walks 173 11.1 Introduction. . . . 174
11.2 The model & the main results . . . . 176
11.3 Mean number of records for multiple walkers . . . . 178
11.4 The distribution of the number of records for finite σ
2. . . . 184
11.5 Numerical simulations . . . . 187
11.6 Comparison to stock prices . . . . 191
11.7 Conclusion . . . . 193
Contents xv
IV Records in finance 203
12 Modeling record-breaking stock prices 205
12.1 Introduction. . . . 206
12.2 Records in i.i.d. RV’s & symmetric random walks . . . . 207
12.3 Records in biased Gaussian random walks . . . . 209
12.4 Records in autoregressive processes . . . . 211
12.5 Analysis of single stocks . . . . 212
12.6 Record statistics of N stocks . . . . 223
12.7 Weekly distributions of records . . . . 225
12.8 Summary and conclusions . . . . 226
V Records statistics - A review 229 13 Record statistics beyond the standard model - Theory and applications 231 13.1 Why records? . . . . 232
13.2 Classical theory of records . . . . 233
13.3 Records in uncorrelated and time-dependent RV’s . . . . 235
13.4 Discreteness, rounding and ties . . . . 241
13.5 Records in correlated processes . . . . 246
13.6 Applications. . . . 255
13.7 Summary and outlook . . . . 260
14 Summary & Conclusions 265 14.1 Part I - Records in uncorrelated random variables . . . . 265
14.2 Part II - Record-breaking temperatures . . . . 267
14.3 Part III - Record statistics of random walks . . . . 268
14.4 Part IV - Records in finance . . . . 269
14.5 Closing remarks & bigger picture . . . . 270
Bibliography for chapters 1, 2 & 14 271
Acknowledgements 277
Anhang gem¨ aß der Pr¨ ufungsordnung (deutsch) 279
Zusammenfassung meiner Beteiligungen zu den Publikationen 281
Erkl¨ arung zur Selbstst¨ andigkeit 283
Lebenslauf 285
1
Chapter 1
Introduction
I think sometimes I guess you see records, say you want to get there and use that as motivation.
In a way, it’s kind of cool if there is a possibility to rewrite history and be up there with the greats of Olympic history.
Michael Phelps, eighteen-fold Olympic Gold medalist The inability to predict outliers implies the inability to predict the course of history, given the share of these events in the dynamics of events.
Nicholas Nassim Taleb, The Black Swan:
The Impact of the Highly Improbable
In our performance-oriented society it is sometimes all about being the best, about achieving more than anybody could ever achieve before. Whether it is a new 100 metre world record, a new record-high skyscraper, or a painting of Edward Munch getting sold for a record-breaking prize, accomplishments, for instance in sports or engineering, but also in business, biology, or in other areas of science are noticed and remembered if they outperform everything that has been accomplished before. On the other hand, events in nature, climatology or also astronomy are considered particularly important and noteworthy if they exceed all previous observations. Scientists and also the general public care a lot about record-breaking storms, heatwaves or earth-quakes. Unfortunately, in this context, records are usually the most dangerous and devastating events.
These are only a few of the reasons why records are of great importance and of general interest. Fig 1.1 shows a few examples of particularly attention-grabbing records that were established by humans, nature or the financial markets. The word ’record’ descends from the Latin verb recordari - to recall, to remind and everybody has a basic understanding of what a record event is. One has learned that a new record is something relevant that will be remembered. Therefore quite a few people are fascinated by setting and thereupon breaking new and spectacular records, making the famous book ’Guinness World Records’
1[1] itself a record-holder as the best-selling copyrighted book in history. As a matter of fact, the book is also among the most frequently stolen books from public libraries. From the technical point of view a record is an entry in a series of measurements that exceeds all previous entries. The fact that they fall out of the range that has been covered before makes them interesting.
1
until 2000 known as ’The Guinness Book of Records’
Figure 1.1: Record-breaking events are interesting in many different areas: Top left: Death Valley, United States, where, with 56.7
◦C, the hottest temperature ever recorded was measured in July 1913 (Photo: Jon Sullivan). Top right: Felix Baumgartner is an Austrian extreme sportsman who performed a record-breaking jump from a helium balloon in October 2012. He fell with a record-breaking speed of more than 1300km/h from a height of over 39km (Photo:
Alexandre Inagaki, Image rights: Creative Commons). Bottom left: In 2009, the Jamaican sprinter Usain Bolt set a new world-record over 100m dash in Berlin. He ran this distance in 9.58s and, with that, broke his own world record for the second time (Photo: Erik van Leeuwen, Image rights: GNU Free Documentation License). Bottom right: The stock of Apple set various records in recent years, it has an all time high market capitalization of 607.5 billion U.S. Dollars (Image rights: GPL).
On a personal note, for a sports fanatic who always dreamed of setting new world records in his youth
2, it was a great pleasure and also a redemption to have the opportunity to study records from a scientific point of view. My studies on records were initially motivated by an interest in a deeper understanding of the role of global warming on the occurrence of record-breaking temperatures. In recent years, I considered many different aspects and applications of the theory of records. This cumulative dissertation summarizes my work on the subject of record statistics and is, in this course, also supposed to give a survey of recent developments in this field of research. It turned out that records are more than just interesting for the observer. From the mathematical point of view their behavior is particularly rich and, by analyzing records in measured data, there is a lot that one can learn about the underlying dynamical system generating the measurements. Especially in the last decade, researchers made progress in modeling record events in observational data by comparing them to various elementary stochastic processes. In this context, this thesis discusses several stochastic models, which improve our understanding of records in climate and finance, in particular.
2
Apparently the author never succeeded and studied physics instead, which, in turn, ultimately resulted
in this thesis.
3 Throughout this work, we consider time series of random numbers X
1, X
2, ..., X
n, which may represent any kind of measurement, such as temperatures, sport results or stock prizes. In such a series, an entry X
nis an upper record if it exceeds all previous en- tries X
1, X
2, ..., X
n−1. Analogously, one can also define a lower record, as an entry that is smaller than all previous ones. In the theory of records and especially in this thesis, two quantities are of particular importance: The probability
P
n:= Prob [X
n> max { X
1, X
2, ..., X
n−1} ] (1.1) that the nth event X
nof a time series is a record and the number of records R
nthat occurs until time n. In the following, P
nis often called the record rate.
The classical theory of records in time series of independent and identically distributed (i.i.d.) random variables (RV’s) sampled from continuous distributions is well established.
In a series of RV’s, which were all drawn from the same continuous probability density f (x), the nth entry is a record with probability P
n=
n1. The first entry, X
1, is a record with probability P
1= 1, the second one, X
2, with P
2= 1/2 and so on. With this, one can infer that, for large n, the average h R
ni of the number of records in such a time series grows logarithmically with n. As we will soon discuss in more detail, this mean record number h R
ni is just the sum over the record rate P
n. By now, a lot more is known about this classical model, which is particularly important because of its strong universality. The occurrence of records in time series of i.i.d. RV’s is entirely independent from the choice of the underlying distribution.
More recently there has been a surge of interest in the record statistics of processes beyond this standard model. A lot of progress was made towards a better understanding of the statistics of records in time series of time-dependent and correlated random variables.
Several research groups studied how the classical results alter if one considers time series of independent RV’s sampled from a distribution that changes in time. Additionally, it was possible to compute the record statistics of time series with correlated entries. These efforts were motivated by applications in various different areas of life and science. Records have been studied extensively in climatology, but also in sports, in biology, in physics and in finance.
In this work, various different stochastic processes with both time-dependent and corre- lated entries are considered. A model of independent RV’s with an increasing mean value is introduced and used to predict the occurrence of temperature records in the context of global warming. Furthermore, the record statistics of some simple correlated processes are computed. The findings are useful to describe record-breaking events in financial markets.
This thesis consists of a series of articles that were published, together with various co-workers, in several peer-reviewed journals along with some additional, hitherto unpub- lished chapters that are either under review or in preparation. The total number of 11 contributions can be arranged in four different groups, which form the four main parts of this thesis and an overall review that shapes a fifth part.
The first part, which contains the chapters 3 to 6, discusses various aspects of the record statistics of uncorrelated random variables. A key role in most of these contributions is played by the so-called Linear Drift Model of record statistics. The main question treated in the chapters 3 and 4 is how the occurrence of records is affected by a linearly increasing mean value. We discuss series of RV’s from shifting probability densities f
k(x) = f
0(x − ck) with a common shape f
0(x). It is demonstrated how strongly quantities like the record rate P
nor the correlations between record events are affected by such a constant drift.
In chapter 5, we present a possible application of our findings as a record-based test for
extremal properties of observational data. While the Linear Drift Model is the dominating
topic in this part, there is also a contribution concerning the problem of rounding, which
is found in any measurement process. In chapter 6, it is discussed how the statistics of
records, the record rate P
nand the mean record number h R
ni change if one allows record
values to get tied in a discrete setting. We show that rounding up or down of originally continuous RV’s can significantly alter the record process.
The second part, with chapters 7 and 8, describes the most important application of the theory developed in part I. There it is demonstrated how the effect of global warming on the statistics of record-breaking temperatures can be quantified by a simple model of uncorrelated RV’s sampled from a distribution with a time-dependent mean value. In chap- ter 7 it is shown that such a minimal model for the record rate P
nis capable of describing the occurrence of record temperatures in historical temperature data from Europe and the United States. It turns out that the frequency in which new hot and cold records occur today is already significantly influenced by the changing climate. This analysis is substan- tially extended in chapter 8, where also the statistics of the values of record temperatures are modeled and discussed.
Main subject of part III is the record statistics of random walks. We focus on discrete- time random walks where each entry X
iis obtained as the sum of the previous entry X
i−1and an i.i.d. RV. In contrast to the models introduced in the first part, the entries of such a random walk are correlated and therefore their record statistics differs systematically from the i.i.d. case. In the chapters 9 and 10 the manifold properties of record events in random walks with a constant drift (bias) are studied in detail. Again, the record rate P
nand the distribution of the record number R
nare computed and discussed. While chapter 9 is focused on biased Gaussian random walks and compares them with record-breaking stock prizes, chapter 10 gives a complete description of the asymptotic record statistics of biased random walks and L´evy flights. Chapter 11 is about the record statistics of the maximum of ensembles of multiple independent random walkers.
The main application of the results derived in part III is found in the financial sciences and is subject of the subsequent part IV (chapter 12). This part consists of a detailed study of record-breaking stock prizes in the American Standard and Poors 500 stock index. It is discussed how well the record-breaking daily stock returns and stock prizes can be described using simple stochastic models like independent random numbers or random walks.
In the fifth part, an attempt of a general review of the recent developments in the field of record statistics is presented. Chapter 13 summarizes both recent theoretical findings and, more briefly, the progress made in the different applications of the theory of records.
We introduce and illustrate various elementary stochastic models and discuss them with respect to their record processes. Following this, chapter 14 summarizes and discusses the contributions in this thesis in a few words.
The following section 1.1 gives of a brief summary of the most important ’classical’
findings in the history of record statistics of independent and identically distributed random
variables. Furthermore, in section 1.2, some important, much newer findings for the record
statistics of symmetric random walks are presented, because of their particular importance
for the parts III and IV of this thesis. In this introduction, the relevant quantities that
will be of interest in the following chapters are defined and some fundamental results are
presented, which form the bedrock of most of the recent studies in this area. These new
developments are summarized briefly in the remainder of chapter 1 (section 1.3). The most
relevant publications of the last decades and their importance for applications also in other
areas of research are described and discussed. This introduction can be seen as a starting
point for all the individual contributions in this work. In the subsequent chapter 2, the four
main parts of this thesis are then introduced in more detail.
1.1. Record statistics of i.i.d. RV’s 5
1.1 Record statistics of i.i.d. RV’s
Most of the classical literature on record statistics discusses the properties of records in time series of independent and identically distributed (i.i.d.) random variables (RV’s) (see for instance [2–4]). A comprehensive summary can be found in the book of Arnold et al. [4], which contains a lot of the results presented in this chapter.
Let us consider a time series of i.i.d. RV’s X
1, X
2, ..., X
n,
3all sampled from the same continuous distribution with probability density function (pdf) f (x). As already mentioned, an entry X
nin such a time series is an upper record if
X
n> max { X
1, X
2, ..., X
n−1} (1.2) and X
1is, by definition, the first record. Of course, one can also consider lower records and X
nis a lower record if X
n< min { X
1, X
2, ..., X
n−1} . Fig. 1.2 illustrates the evolution of upper and lower records in a time series of i.i.d. RV’s.
number of events n Position X
n1
2 3 4 5 6
1 2
3 4 5
Figure 1.2: Sketch of the record process of i.i.d. RV’s. The red (blue) balls mark the upper (lower) records. Here, one has a total number of six upper and five lower records. Of course, the
first entry X
1is both, the first upper and the first lower record.
Probably the most important and most frequently mentioned quantity in this work is the probability P
nthat a certain entry n in such a series is a record. We often refer to P
nas the (upper or lower) record rate. For i.i.d. RV’s P
nis completely universal for all continuous distributions, which means that it is entirely independent from the choice of the underlying pdf f (x). One finds that
P
n= 1
n , (1.3)
as already mentioned above. This can be seen as follows: Since all n RV’s are sampled from the same distribution, every one of them is equally likely to be the largest. Therefore also the last entry X
nis the largest with the same probability. Now, an arbitrary entry is the largest in one of n cases and thus the last one is a record with a probability P
n= 1/n.
Despite the simplicity of this so-called stick-shuffling argument, it is worth noticing that the record rate can also be derived using a more systematic approach. Since the probability for a RV sampled from a distribution with pdf f (x) to be smaller than some value x is given by the cumulative distribution function (cdf) F (x) := R
xdxf (x), P
ncan be computed by evaluating the integral
P
n= Z
dx f (x) F
n−1(x) . (1.4)
3
Occasionally, in this thesis we consider time series of RV’s with entries X
0, X
1..., X
n.
This is just the probability density of a record with value x in the nth step integrated over all possible values x. Partial integration yields
P
n= 1 − (n − 1) Z
dx f (x) F
n−1(x) = 1 − (n − 1) P
n, (1.5) which leads directly to P
n= 1/n as in Eq. 1.3.
As a direct corollary of this result, one can also compute the average of the number of records R
nthat one expects up to the nth step. This mean record number h R
ni is obtained by summing up the record rate from one to n: h R
ni = P
1+ P
2+ ... + P
n. Using a well known result for the large n behavior of the harmonic numbers H
n:= P
nk=1
1/k [5] one finds that
h R
ni =
n
X
k=1
P
k=
n
X
k=1
1
k ≈ ln n + γ, (1.6)
where γ ≈ 0.577215... is the Euler-Mascheroni constant. This result is interesting simply because it diverges. The probability for a new record never goes to zero and there is no upper bound to the total number of records in the i.i.d. case.
The other way around, the fact that the mean record number h R
ni matches the nth Harmonic number H
n:= P
nk=1 1
k
can be used to prove that the Harmonic series H
∞= P
∞k=1 1
k
diverges [2]. If one assumes that there is never an ultimate record and every record value gets exceeded eventually, the mean record number for n → ∞ must diverge and therefore also the Harmonic series.
1.1.1 Correlations between records from i.i.d. RV’s
A very important feature of the record statistics of i.i.d. RV’s is the fact that the individual record events are uncorrelated. The probability P
nfor a record in the nth entry is com- pletely independent from the probability P
mfor a record in another entry m 6 = n. In other words, the probability P
n,mfor a record both in the nth and the mth step factorizes:
P
n,m= Prob [X
nand X
mare both records ] = P
n· P
m. (1.7) For two consecutive entries n and m = n+1 this can be shown as follows: With an argument similar to the one that leads to Eq. 1.4, the probability P
n,n+1for the entries n and n + 1 to be records in the same time series is given by
P
n,n+1= Z
dx
n+1f (x
n+1)
xn+1
Z
dx
nf (x
n) F
n−1(x
n)
= Z
du f (u) F
n(u) − (n − 1) Z
du f (u)
u
Z
dvf (v) F
n−1(v)
= P
n+1− (n − 1) P
n,n+1. (1.8)
With this one finds that
P
n,n+1= P
nP
n+1= 1
n (n + 1) . (1.9)
This derivation can be easily generalized to prove that also the probabilities for records in the nth and the (n + k)th step are uncorrelated. Additionally, it is straightforward to show that also multi-point correlations vanish. The joint record rate of a set of i integer and pairwise different numbers n
1, ...n
ifactorizes:
P
n1,...,ni= P
n1P
n2· ... · P
ni. (1.10)
1.1. Record statistics of i.i.d. RV’s 7
1.1.2 Full distribution of the record number R n
Knowing that the individual record events are uncorrelated, one can compute the variance and also the full distribution of the record number R
n. For that purpose it is helpful to introduce a set of (uncorrelated) indicator random variables (cf. [4]), I
1, I
2, ..., I
n, as follows:
I
n:=
( 1, if X
nis a record,
0, else. (1.11)
In this notation, the record rate P
nis just the probability Prob [I
n= 1] = h I
ni and, because of Eq. 1.10, the joint probability for a set of entries X
n1, X
n2, ..., X
nito be records is given by
Prob [I
n1= 1, I
n2= 1, ..., I
ni= 1] = 1 n
11
n
2· ... · 1 n
i. (1.12)
In terms of the indicator random variables, the record number R
nis obtained as the sum R
n= P
nk=1
I
k, and one can reobtain the result for the mean record number h R
ni (Eq. 1.6) as follows:
h R
ni =
n
X
k=1
h I
ki =
n
X
k=1
1
k ≈ ln n + γ (1.13)
Thanks to the new notation, one can now also compute the variance Var (R
n) of the mean record number. With Var (R
n) = h (R
n− h R
ni )
2i = P
nk=1
Var (I
k) one finds that Var (R
n) =
n
X
k=1
1 k − 1
k
2≈ ln n + γ − π
26 . (1.14)
In the second step one has to use lim
n→∞
P
nk=1
1/k
2= π
2/6 [5]. Apparently, in the large n limit, the variance of the record number behaves like the mean record number minus a constant: Var (R
n) = h R
ni − π
2/6 and the asymptotic standard deviation of the mean record number grows proportionally to √
ln n.
Using the so-called Stirling numbers of the first order (cf. [5]), the full distribution of the record number R
ncan be described in terms of its probability generating function h z
Rni [6]. With help of the indicator functions, h z
Rni can be expressed as
h z
Rni = h z
Pnk=1Iki =
n
Y
k=1
h z
Iki =
n
Y
k=1
z j +
1 − 1
j
, (1.15)
where, in the last step, one uses that z
Ijis z with probability 1/j and one with a probability of 1 − 1/j. Therefore, h z
Iji is given by z/j + (1 − 1/j). The probability of having R
n= k records in n steps can now be computed using the kth derivative of the generating function h z
Rni :
Prob [R
n= k] = 1 k!
d
kdz
kh z
Rni|
z=0(1.16)
The k-fold derivation of h z
Rni is quite complicated and we will not discuss it in detail.
It was shown in [4] that Eq. 1.16 can be reduced to Prob [R
n= k] = S
knn! , (1.17)
where S
nkis an unsigned Stirling number of the first order [5]. S
nk=
n kgives the number
of permutations of a set of n elements that has k disjoint cycles [5]. As a simple example,
the Stirling number S
32=
32
is given by 3, since there are 3 ways to permutate the set { 1, 2, 3 } into two cycles: { (1) , (2, 3) } , { (1, 2) , (3) } and { (1, 3) , (2) } .
Since all indicator functions I
khave a finite variance (it is straightforward to show that Var (I
k) ≤
14for all possible values of k), it is a consequence of the central limit theorem that, for n → ∞ , the distribution of the record number R
napproaches a Gaussian form. This limiting distribution must have a mean value µ ≈ h R
ni a standard deviation of σ ≈ p
h R
ni . Therefore, one finds that the rescaled mean record number (R
n− h R
ni ) / p
h R
ni has a standard normal distribution in the large n limit:
R
n− ln n
√ ln n
−−−−→
nd→∞
N (0, 1) . (1.18)
1.1.3 Record times
The formalism developed above can also be used to compute the distribution of record times. We define T
kas the time at which the kth record occurs and we are interested in the probability Prob [T
k= n] that this happens at time n. As discussed in [4] this probability is given by the joint probability for a record at time n together with a record number of R
n−1= k − 1 at time n − 1. Since these two probabilities are independent, we have
Prob [T
k= n] = 1
n Prob [R
n−1= k − 1] = S
kn−−11n! . (1.19)
With this, one can show an important result for the mean record times: The expectation value of the record time T
kis divergent for all values k > 1:
h T
ki = X
∞n=k
n Prob [T
k= n] = ∞ . (1.20)
Along with this the expectation values of the inter-record times ∆
k:= T
k− T
k−1diverge and
h ∆
ki = h T
k− T
k−1i = ∞ . (1.21) A full proof of these results is complicated and can for instance be found in [7–9]. It can also be shown that the logarithms ln T
kof the waiting times approach a Gaussian distribution with mean k and standard deviation √
k in the limit of large record numbers k. In other words, the rescaled logarithmic waiting times (ln T
k− k) / √
k approach a standard normal distribution:
ln T
k− k
√ k
−−−−→
dk→∞
N (0, 1) . (1.22)
Interestingly, the logarithmic inter-record times have the same asymptotic distribution [4]:
ln ∆
k− k
√ k
−−−−→
k d→∞
N (0, 1) . (1.23)
Furthermore, Glick [2] showed that the ratio ∆
k/T
kis uniformly distributed on the interval (0, 1). On average, the time ∆
kbetween the (k − 1)th record and the kth accounts for half
of the total waiting time T
kof the kth record.
1.1.4 Record values
While all previously introduced quantities are completely universal for arbitrary series of i.i.d. RV’s, this universality gets lost if one considers the values of record-breaking events.
The statistical properties of record values, such as their mean values and their distributions,
1.1. Record statistics of i.i.d. RV’s 9
0 0.2 0.4 0.6 0.8 1
0 2 4 6 8 10
n=1 n=4 n=16 n=64 n=256
0 0.2 0.4 0.6 0.8 1
0 2 4 6 8 10
k=1 k=2 k=3 k=5 k=7
Figure 1.3: Left: The normalized record value distribution of records that occur at fixed times n = 1, 4, 16, 64, 256 in a series of i.i.d. RV’s from an exponential distribution with f (x) = e
−x(and x > 0). The distributions were obtained using Eq. 1.25. Right: The normalized distributions of records with a fixed record number k = 1, 2, 3, 5, 7 (see Eq. 1.30), again for i.i.d. RV’s from the exponential distribution.
depend heavily on the shape of the underlying distribution. There are in principle two important types of record values that one can consider: The values of records that occur in a certain entry n in our time series and the values of records with a fixed record number k.
In Fig. 1.3 the distributions of records with fixed n and fixed k for a simple exponential distribution are illustrated with f (x) = e
−x(for x > 0) and some selected values of n and k.
It is quite simple to give the full distribution of a record that occurs at a fixed time step n in a series of i.i.d. RV’s. One can compute the normalized cumulative distribution function (cdf) Q
n(x) of a record with value n from the integral expression of the probability for a record in the nth event (Eq. 1.4). In this context, Q
n(x) is the probability that the nth entry X
nis larger than all previous entries and smaller than x:
Q
n(x) := P
n−1Prob [X
n> max { X
1, X
2, ..., X
n−1} , X
n< x]
= n
x
Z
f (x) F
n−1(x) . (1.24)
Here, P
n−1= n was used to normalize the cdf. Therefore the pdf f
n(x) of a record that occurs in the nth step is simply given by
f
n(x) = d
dx Q
n(x) = nf (x) F
n−1(x) . (1.25) With this result it is straightforward to compute the mean value as well as arbitrary higher moments of record events with a fixed n. The mean µ
nof a record at time n is
µ
n= n Z
dx xf (x) F
n−1(x) . (1.26)
For an exponential distribution with f (x) = ν
−1e
−x/ν(x > 0 and ν > 0) this leads to µ
(exp)n=
Z
∞0
dx xν
−1e
−xν1 − e
−xνn−1= νH
n≈ ν (ln n + γ) , (1.27) where the integral was evaluated using iterated partial integration. For a Gaussian distri- bution with
f (x) = 1
√ 2πσ
2e
−x2/2σ2, (1.28)
and a standard deviation σ it is more complicated to compute the mean µ
nwhich, in the limit of large n, approaches
µ
(Gauss)n≈ s
ln n
22π
. (1.29)
The derivation of the distribution of record values with a fixed record number k is more difficult. As shown previously, a record with record number k can occur at an arbitrary time n ≥ k. In principle, this would require averaging over all distributions of records with fixed values of n and k. Fortunately, there is an easier method, thanks to a special property of the exponential distribution f (x) = e
−xwith x > 0. This distribution has the so-called lack-of-memory property. This basically means that for any k, the value of the kth record will be given by the value of the (k − 1)st plus an exponential random variable drawn from the same distribution e
−x. With this one can show that a record with record number k has the pdf
f
k(x) = 1
(k − 1)! x
−ke
−x, (1.30)
which is a Gamma-distribution with shape parameter k [5]. One can use this result to compute the distribution of a record with record number k for an arbitrary continuous underlying distribution. In [4] it is shown that the kth record of such an arbitrary distribu- tion can be given as a function of the kth record from the exponential distribution (see also chapter 13). In fact, the kth record in a series of i.i.d. RV’s sampled from the distribution f (x) has the pdf
f
k(x) = f (x)
(k − 1)! ( − ln (1 − F (x)))
k. (1.31)
1.1.5 Limit laws for record values
In the theory of extreme events, it is well known that the distributions of the maximum M
n:= max { X
1, X
2, ..., X
n} (1.32) of a given set X
1, X
2, ..., X
nof i.i.d. RV’s from a continuous pdf f (x) converge to one of three possible limiting distributions [10] (for an introduction see for instance [11, 12]). The Fisher-Tippett-Gnedenko Theorem [11, 12] of classical extreme value theory states that if the total number of i.i.d. RV’s, n, is going to infinity, the limiting distribution of the maximal value can always be rescaled to one of the following three shapes:
I - Weibull distribution: For RV’s with a finite support, the rescaled maximum ap- proaches a (reversed) Weibull distribution. It has the following cdf:
F
I(x) =
( e
−(−x)−κ, for x < 0,
1, for x ≥ 0 , (1.33)
with one free parameter κ < 0.
II - Gumbel distribution: The cdf of the rescaled maximum of a set of RV’s from a distribution with an infinite support that decay faster than any power-law (e.g. with an exponential tail) approaches a distribution of the Gumbel form:
F
II(x) = e
e−x. (1.34)
1.1. Record statistics of i.i.d. RV’s 11 III - Fr´ echet distribution: For RV’s with infinite support and a tail that decays like a power law, the limiting distribution of the rescaled maximal value is of the Fr´echet form:
F
III(x) =
( 0, for x < 0,
e
−x−κ, for x ≥ 0, (1.35)
again with one free parameter κ > 0.
It turns out that these three universality classes are also of importance for the distribu- tions of record values. In fact, these distributions, both with a fixed record number k, as well as the ones that occur at a fixed time n also approach one of three different limiting distributions.
In the case of the record values with a fixed n, the situation is particularly simple. In Eq. 1.24 we already gave an expression for the normalized cdf of a record that occurs in a fixed entry of the series. The cumulative distribution of the maximum M
nof a series of RV’s X
1, ..., X
nhas exactly the same shape:
Prob [M
n< x] = n
x
Z
dx f (x) F
n−1(x) . (1.36) Therefore, the distribution of the record values with a fixed n must approach the same limiting distribution as the maximal value M
n.
In the case of record values with fixed record number k it is more complicated and the record values do not approach the same limiting distributions. However, in 1973, Resnick [13] showed that the distributions of the record values with a record number k obey a limit law of the form:
Φ ( − ln ( − ln (F
i(x)))) , (1.37)
where the functions F
i(x) with i = I, II, III are the limiting distributions of the maximal value and Φ (x) is the cdf of a Gaussian standard normal distribution with
Φ (x) = 1 2π
x
Z
−∞
e
−t2/2dt. (1.38)
With this result Resnick proved that, under proper rescaling, the limiting distribution of a record with record number k approaches one of these three distributions [13]:
I - Negative-log-normal distribution: For RV’s of the Weibull class, with a distri- bution that has a finite support, the (rescaled) record value distribution approaches the following cdf:
Φ
I(x) = ( Φ
ln ( − x)
−κ, for x < 0,
1, for x ≥ 0, (1.39)
with κ < 0.
II - Normal distribution: Record values in series of RV’s from the Gumbel class are normally distributed and can be rescaled to a standard normal distribution:
Φ
II(x) = Φ (x) . (1.40)
III - Log-normal distribution: For RV’s of the Fr´echet type, from distributions that decay like a power-law, the rescaled limiting distribution is of the following form:
Φ
III(x) =
( 0, for x < 0,
Φ (ln (x
−κ)) , for x ≥ 0, (1.41) with κ > 0.
In the following, these findings will be particularly important for our studies of the record statistics of RV’s, which are uncorrelated but time-dependent. They allow us to analyze and discuss the records in our models in the context of the three universality classes of extreme value statistics. It will turn out that these classes are helpful to understand and interpret the record statistics of more complicated and time-dependent stochastic processes.
1.2 Record statistics of symmetric random walks
Mostly because of its importance for the parts III and IV of this thesis we will now introduce a second stochastic process and discuss its record statistics. A discrete-time random walk is a simple example for a process of correlated random variables and is defined as a sum of random steps, which are again independently sampled i.i.d. RV’s as in the previous section
4. The entries X
1, X
2, ..., X
nof a discrete-time and continuous-space random walk can be described as follows:
X
n= X
n−1+ η
n, (1.42)
where the η
i’s are i.i.d. RV’s drawn from a continuous distribution f (η). X
0is the origin of the random walk and usually we will set X
0= 0 without loss of generality (see Fig. 1.4).
number of events n Position x
n1
2 3
4
5 6
Figure 1.4: Sketch of the record process of a discrete-time random walk. The red balls mark the progression of the upper record.
The simplest scenario one can consider is a symmetric random walk with a fully sym- metrical jump distribution f (η) = f ( − η). However, for this case already it turned out that it is much more complicated to obtain quantities like the record rate P
nand mean record number h R
ni than in the case of i.i.d. RV’s. Only a few years ago, in 2008, Majumdar and Ziff [15] computed the full distribution of the record number R
nof a symmetric random walk. Interestingly, this distribution is completely independent from the choice of the sym- metric jump distribution f (η). We will now illustrate how to derive these results following the analysis of Majumdar and Ziff [15].
The main idea behind the derivation of the record statistics of the symmetric random walk is to subdivide a process with n steps and R
n(upper) records into a series of R
n− 1 first-passage and one survival problem
5. Fortunately, the random walk has the so-called
4
An introduction can, for instance, be found in the book by Weiss [14].
5
For a detailed introduction to the theory of these problems see for instance the book by Redner [16].
1.2. Record statistics of symmetric random walks 13 renewal property, which basically states that the process starting from X
nat a given time n is again a random walk with X
nas a new origin that behaves exactly like the original process. With this it is easy to see that the time l
kbetween the kth record and the (k + 1)st record is simply the time required until a random walker starting from the origin (at the time of the kth record) becomes positive for the first time. This duration is also known as the (positive) first-passage time.
Now one can define the (positive) first-passage probability φ (l), which is the probability that the walker crosses the origin for the first time after l steps. Similarly the survival probability q (l) is the probability that a random walk starting at zero stays below (or above) the origin for the first l time steps. It is easy to see that φ (l) and q (l) are connected by φ (l) = q (l − 1) − q (l).
Thanks to a nontrivial theorem by Sparre Andersen [17, 18], it is known that these quantities are entirely universal for symmetric random walks. Sparre Andersen showed that the generating function of the survival probability ˜ q (z) = P
∞l=0
q (l) z
lfor any random walk with a continuous and symmetric jump distribution, is given by
˜
q (z) = 1
√ 1 − z . (1.43)
Similarly the first-passage probability φ (l) has the generating function ˜ φ (z) = 1 − √ 1 − z.
From these results one can obtain q (l) =
2l l
2
−2land φ (l) = 2l
l
2
−2l2l − 1 . (1.44)
Using these findings one can compute the probability for a random walk with R
nrecords and inter-record times l
1, ..., l
Rn(with P
Rnk=1
l
k= n):
P (l
1, ..., l
Rn| n) = φ (l
1) · · · · · φ l
Rn−1q (l
Rn) δ
PRnk=1lk,n
. (1.45) The survival probability q (R
n) and the δ-function are necessary to exclude the possibility of additional records after the one with record number R
n.
Now, to compute the overall probability of R
nrecords in n time steps, one has to sum P (l
1, ..., l
Rn| n) over all possible sets l
1, ..., l
Rnwith P
Rnk=1
l
k= n. This summation was done by Majumdar and Ziff [15] using the generating function of the probability P (l
1, ..., l
Rn| n).
They showed that the joint probability P (R
n| n) for R
nrecords obeys X
∞n=Rn−1
P (R
n| n) z
n= ˜ φ (z)
Rn−1q ˜ (z) = 1 − √
1 − z
Rn−1√ 1 − z . (1.46)
Expanding this result in powers of z, Majumdar and Ziff found the full distribution of the record number R
n. The probability P (R
n| n) of R
nrecords in n steps is given by
P (R
n| n) =
2n − R
n+ 1 n
2
−2n+Rn−1. (1.47)
The mean record number h R
ni can be obtained as the first moment of this distribution.
One finds that
h R
ni = (2n + 1) 2n
n
2
−2nand P
n= 2n
n
2
−2n. (1.48) In the asymptotic limit of large series length (n → ∞ ), the distribution P (R
n| n) approaches a half-Gaussian form:
P (R
n| n) −−−−→
n→∞1
√ nπ exp
− R
2n4n
(1.49)
in contrast to the i.i.d. case, where it was found that the asymptotic record number is distributed according to a Gaussian distribution. In this limit, the mean record number h R
ni is proportional to √
n (and not logarithmically as in the case of i.i.d. RV’s). For n ≫ 1 one obtains
h R
ni ≈ r 4n
π and P
n≈ 1
√ nπ . (1.50)
Apparently, the record rate P
nof the discrete-time random walk decays much slower than for i.i.d. RV’s with P
n= 1/n. Correspondingly, the mean record number h R
ni is much larger than the i.i.d. results of h R
ni ∝ ln n.
1.3 Recent theoretical progress & applications
The results for the record statistics of i.i.d. RV’s discussed before have all been derived at least 30 years ago and can, among other findings, be considered as the classical theory of records. Since then, but especially in the last 10 to 15 years, a lot of research was done towards a better understanding of the record statistics of more complicated stochastic processes, in particular time-dependent and correlated RV’s. Additionally, the old and new theoretical results found many new applications in various areas of science. While a detailed and comprehensive review of these developments is the subject of chapter 13, I will now briefly summarize the important publications in this field to give the reader a better idea of the current state of research. This introduction is supposed to illustrate the general framework in which the contributions in this thesis were developed.
Temperature records
Certainly the most important application of record statistics in the last years was the study of record events in climatology. The evident and probably mostly anthropogenic climatic change [19] that started to increase the global mean temperature in the second half of the last century made scientists and also the general public particularly interested in extreme weather events like severe storms, heavy rainfall, or record-breaking heatwaves. Over the last 30 years, the study of extremes in climate and also the adaptation to them has become a well established branch of research in climatology (cf. [20–26]). Most likely because of the frequent and attention-grabbing media coverage, researchers, including us, have more recently also started to look at the statistics of climate records.
Even though some earlier publications about record-breaking temperatures exist [27–
32], the first comparison between theoretical results in record statistics and temperature measurements was performed a decade ago by Benestad [33, 34]. He analyzed the global monthly mean temperatures and measurements from several Norwegian weather stations.
In 2006, he also considered record-breaking precipitation events [35]. Also in this year, Red-
ner and Petersen considered time series of daily temperature measurements for individual
calendar days that were recorded in Philadelphia [36]. They made many important theo-
retical observations, but, due to the fact that they only considered one individual weather
station, they could not satisfactorily show a connection between global warming and the
occurrence of record temperatures. A few years later, this connection was established by
a series of authors. In 2009, Meehl et al. [37] found that, at that time, more than twice
as many heat records than cold records were measured in the United States. In an inde-
pendent study of European weather stations we showed that the rate of daily heat records
in Europe is significantly increased [38, 39] (see chapter 7). We also proposed to use the
simple Linear Drift Model (LDM) that accurately predicts the effects of global warming
on the statistics of record-breaking temperatures. In the following, these findings were con-
firmed and extended by Newman et al. [40], as well as Elguindi et al. [41] and Rahmstorf
et al. [42]. Both Elguindi et al. and Rahmstorf et al. also considered our simple LDM for
1.3. Recent theoretical progress & applications 15 record temperatures and could, for the most part, confirm its validity. In 2012, we extended this model and analyzed the values of record-breaking temperatures [43] (see chapter 8).
Time-dependent models
The LDM that was employed to model record temperatures proved to be interesting and of importance on its own. It was first introduced by Ballerini and Resnick in 1985 [44, 45], who computed the record rate in the limit of infinite series length. These results were later refined and extended by Borovkov [46]. Motivated by our study of temperature records, we considered this model in 2010 and discussed the behavior of the record rate also for short series length in the context of the three universality classes of extreme value statistics [47]
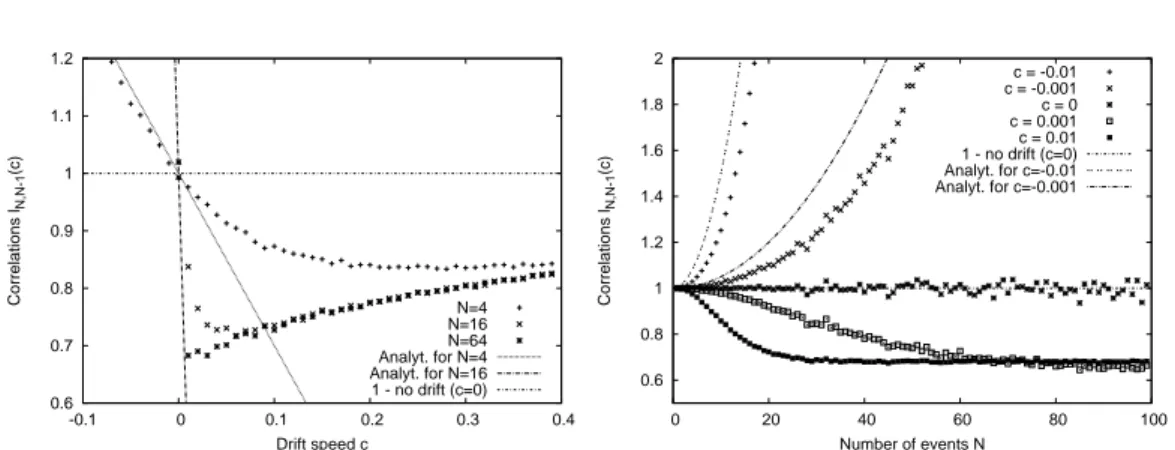
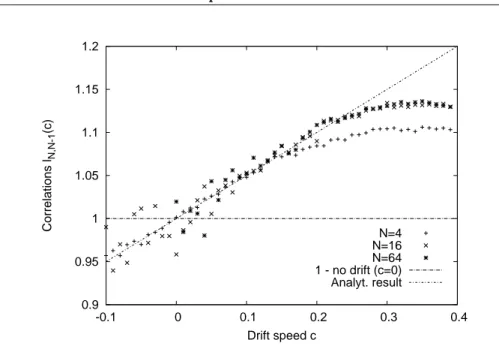
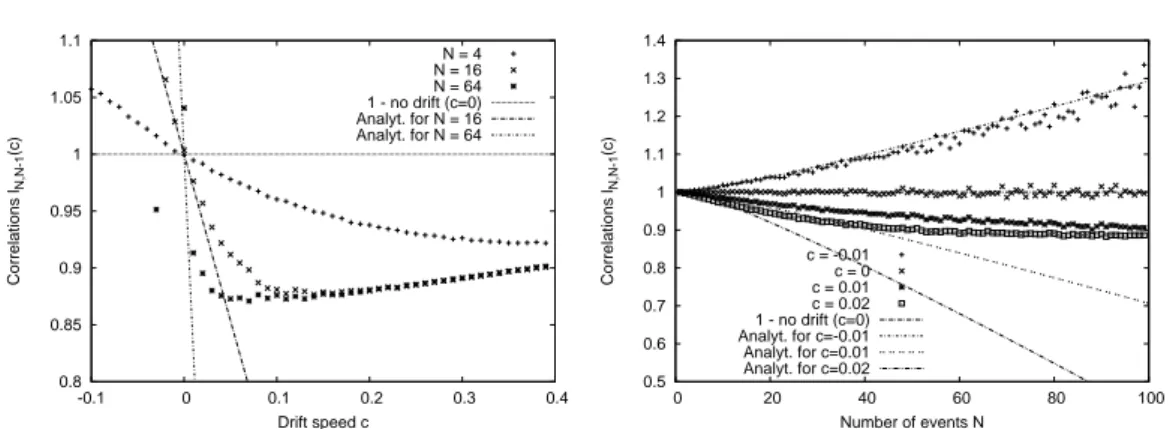
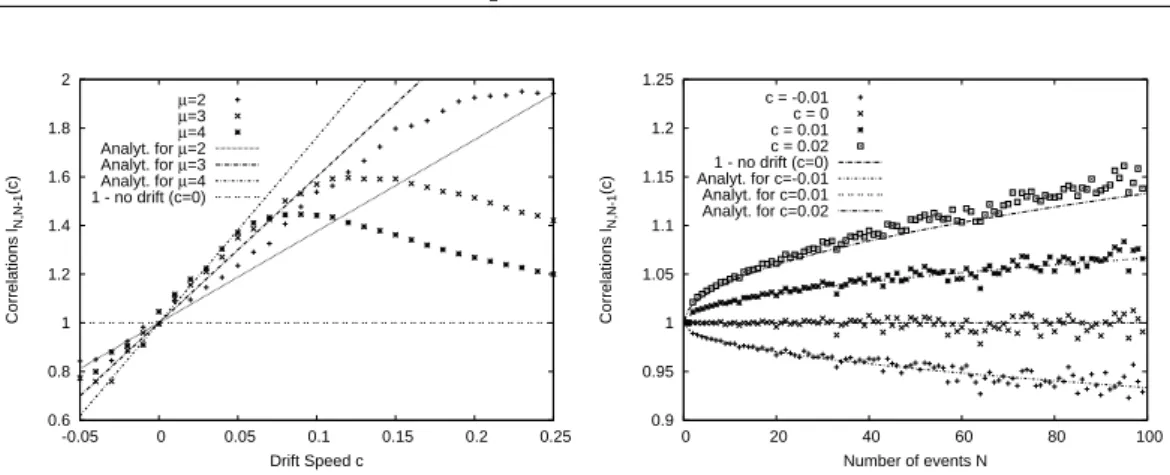
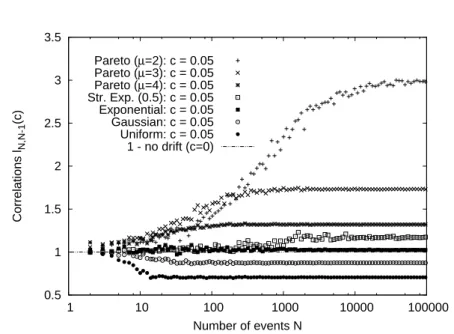
(see chapter 3). During these studies, we made the interesting observation that in time series of RV’s with a linear drift, the individual record events are no longer uncorrelated as in the case of i.i.d. RV’s. In fact, it turned out that the correlations between records have a complicated and manifold behavior. In some sense, record events can both repel and attract each other, depending on the characteristics of the underlying distribution. These results and a promising application as a test for heavy-tail properties of observational data were published separately [48, 49] (see chapters 4 and 5).
Apart from these studies on the LDM, other possible processes of uncorrelated RV’s with non-identical, time-dependent distributions were considered and applied in a different field of research, namely biology. In 2007, Krug [50] considered RV’s sampled from broadening distributions and discussed their record statistics. Eliazar and Klafter [51] analyzed a similar problem in 2009 by discussing records in a model of stochastic growth, which was motivated by problems in evolutionary biology. In this context, Krug and Jain studied the connection between biological evolution and records [52] building upon previous work by Kauffman and Levin [53], as well as Sibani et al. [54]. Since then, record and extreme value statistics have become important in the theory of adaption (for an introduction see for instance the article of Orr [55]), especially for adaptive walks on fitness landscapes [56]
(see also [57]).
Discreteness & rounding
Very important for experimentalists is certainly the problem of discreteness. Even though the entire classical theory presented in section 1.1 deals with RV’s from entirely continuous distributions, one must always be aware of the fact that experimental observations (tem- peratures, flood heights, sport results,...) can only be measured up to a certain accuracy.
They will always be rounded to a certain precision. One way to deal with this problem is to consider the record statistics of discrete distributions, where ties are allowed. This was already done by Vervaat [58] in 1973 and later, for instance, by Prodinger [59], Gouet et al. [60] and Key [61]. Alternatively, Gouet et al. [62] studied the statistics of records that are only counted if they exceed the previous one by a certain constant value δ 6 = 0, the so-called δ-records. Eliazar introduced the similar concept of geometric records [63, 64], which only count as such when they exceed a certain multiple of the last record. From an experimental point of view, the probably most realistic model of RV’s that are first drawn from a continuous distribution and then discretized by rounding, was first discussed in a recent article of ours [65] (see chapter 6).
Records in correlated processes & finance
The line of research opened up by Majumdar and Ziff in 2008 [15] goes in an entirely different
direction. As previously discussed, they used a powerful theorem by Sparre Andersen [6, 17,
18] to study the statistics of record-breaking events in random walks and L´evy flights. They
showed that the full distribution of the record number and therefore also the mean record
number and the record rate of symmetric, discrete-time random walks with a continuous
jump distribution is completely universal for all possible choices of this jump distribution.
This amazing result entailed a series of other publications about the record statistics of random walks. In 2011, Sabhapandit generalized some of the findings of Majumdar and Ziff to random walks with a continuous distribution of waiting-time between the individual steps [66] (see also [57]). In the same year, we considered biased Gaussian random walks with an asymmetric jump distribution and managed to compute some new approximate results for the record rate and mean record number [67]. In this publication we also demonstrated that the record statistics of stock data from the Standard and Poors 500 index [68] can, to some degree, be modeled using biased random walks (see also [69] and chapter 12). The problem of a biased L´evy flight with jumps sampled from a Cauchy distribution was considered by Le Doussal and Wiese [70]. More recently, the complete asymptotic record statistics of biased random walks and L´evy flights were computed together with Majumdar and Schehr [71] (see chapter 10) and we found a surprisingly diverse and manifold universal behavior of the record number distribution. In 2012, we studied ensembles of multiple independent random walkers and L´evy flights and compared the record statistics of their maximal value to ensembles of randomly selected stocks from the Standard and Poors 500 index [72] (see chapter 11). Also building up on the findings of Majumdar and Ziff is the work of Edery et al. [73], who made a first step towards the understanding of records in higher dimensional Markov processes by performing various numerical simulations of the scaling behavior of the record distance of a diffusion process from its origin.
Further theoretical results & applications
Besides these applications in climatology, biology and finance, the theory of records is also useful in various other areas of science. Oliveira et al. found a record process in a model for high-temperature superconductors [74] and, in a similar context, Sibani et al. found a connection between the problem of magnetization and aging in spin-glasses and records [75–77]. Also hydrologists found record events interesting in the past: In 2001, Vogel et al. [78] examined the frequency of record-breaking floods in observations from hundreds of gauging stations in the United States. In a recent study, the interdisciplinary relevance of the theory of records was demonstrated in an analysis of the movement of ants [79]. Of course, the statistics of world records in sports were also studied: Gembris et al. [80, 81]
analyzed the progression of world records in athletics and compared them with the record statistics of i.i.d. RV’s.
From the mathematical point of view, there has been more progress in many different directions. For instance, researchers have studied record processes with randomly sampled waiting times between the individual entries and, in particular, records in Poisson processes (see for instance [82–84]). In the book by Arnold [4], various more complicated models, introduced in the last decades are discussed, for instance the so-called Pfeiffer model, where the process is constructed in such a way that the individual record values form a Markov chain
6[4, 85]. In the 1990’s, concepts of multivariate records in two- or higher-dimensional time series were developed [4, 86, 87].
6

![Figure 4.3: Correlations between record events at distance k from time series of length N = 32 for Gaussian (σ = 1), L´evy-stable (µ = 1.5), uniform (on [0, 1]) and Pareto (µ = 1.5) distributions.](https://thumb-eu.123doks.com/thumbv2/1library_info/3706327.1506187/70.892.168.752.134.372/figure-correlations-record-distance-gaussian-uniform-pareto-distributions.webp)