• Keine Ergebnisse gefunden

Dipsticks with Reflectometric Readout of an NIR Dye for Determination of Biogenic Amines

N/A
N/A
Protected

Academic year: 2021

Aktie "Dipsticks with Reflectometric Readout of an NIR Dye for Determination of Biogenic Amines"

Copied!
16
0
0

Wird geladen.... (Jetzt Volltext ansehen)

Volltext

(1)

Article

Dipsticks with Reflectometric Readout of an NIR Dye for Determination of Biogenic Amines

Sarah N. Mobarez

1,2

, Nongnoot Wongkaew

1

, Marcel Simsek

1

, Antje J. Baeumner

1

and Axel Duerkop

1,

*

1

Institute of Analytical Chemistry, Chemo- and Biosensors, University of Regensburg, Universitätsstraße 31, 93053 Regensburg, Germany; Sarah-Nagy-Ali.Mobarez@chemie.uni-regensburg.de (S.N.M.);

Nongnoot.Wongkaew@chemie.uni-regensburg.de (N.W.); Marcel.Simsek@chemie.uni-regensburg.de (M.S.);

Antje.Baeumner@ur.de (A.J.B.)

2

Chemistry Department, Faculty of Science, Ain Shams University, El-Khalyfa El-Mamoun Street, El-Abaseya, Cairo 11566, Egypt

* Correspondence: axel.duerkop@ur.de; Tel.: +49-941-943-4063; Fax: +49-941-943-4064

Received: 6 August 2020; Accepted: 9 October 2020; Published: 14 October 2020

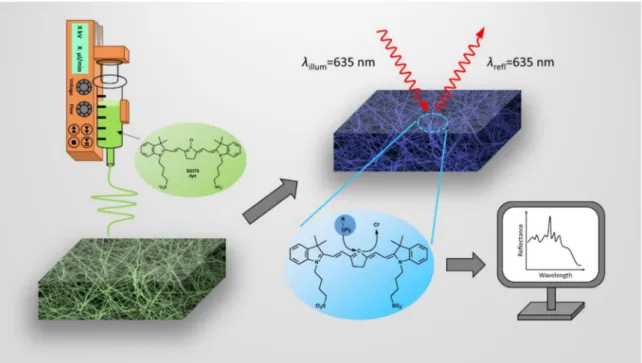
Abstract: Electrospun nanofibers (ENFs) are remarkable analytical tools for quantitative analysis since they are inexpensive, easily produced in uniform homogenous mats, and provide a high surface area-to-volume ratio. Taking advantage of these characteristics, a near-infrared (NIR)-dye was doped as chemosensor into ENFs of about 500 nm in diameter electrospun into 50 µm thick mats on indium tin oxide (ITO) supports. The mats were made of cellulose acetate (CA) and used as a sensor layer on optical dipsticks for the determination of biogenic amines (BAs) in food. The ENFs contained the chromogenic amine-reactive chameleon dye S0378 which is green and turns blue upon formation of a dye-BA conjugate. This S
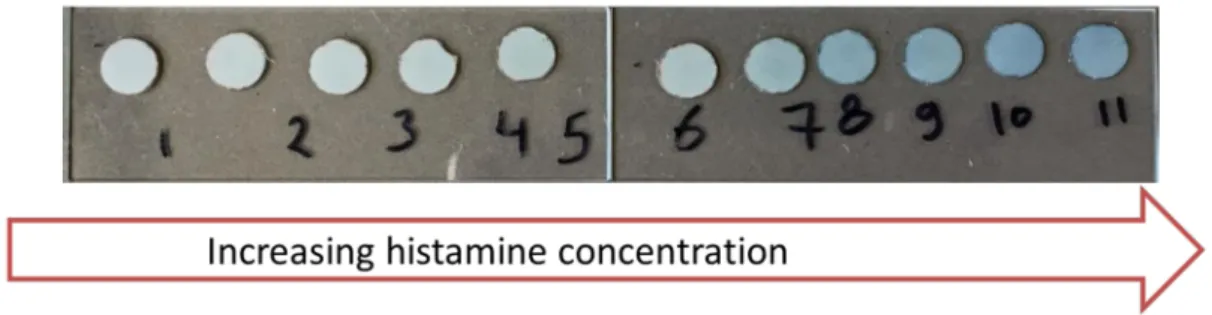
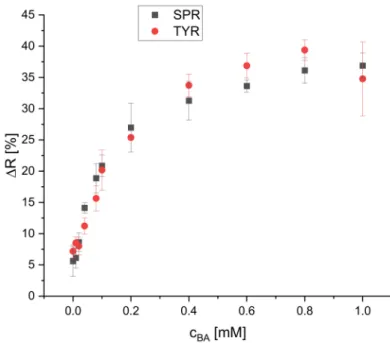
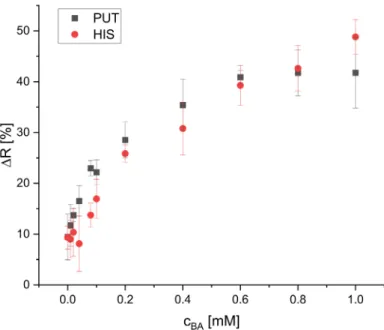
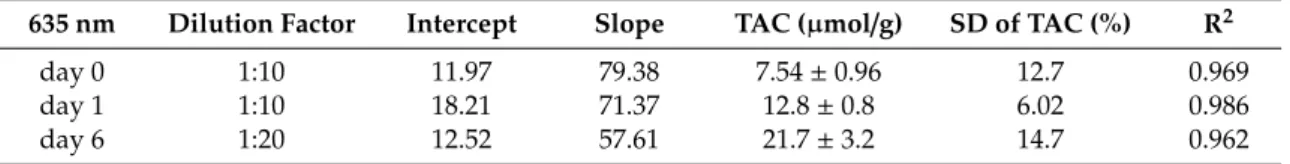
N

1-reaction of the S0378 dye with various BAs was monitored by reflectance measurements at 635 nm where the intrinsic absorption of biological material is low. The difference of the reflectance before and after the reaction is proportional to BA levels from 0.04–1 mM. The LODs are in the range from 0.03–0.09 mM, concentrations that can induce food poisoning but are not recognized by the human nose. The calibration plots of histamine, putrescine, spermidine, and tyramine are very similar and suggesting the use of the dipsticks to monitor the total sample BA content. Furthermore, the dipsticks are selective to primary amines (both mono- and diamines) and show low interference towards most nucleophiles. A minute interference of proteins in real samples can be overcome by appropriate sample pretreatment. Hence, the ageing of seafood samples could be monitored via their total BA content which rose up to 21.7 ± 3.2 µ mol/g over six days of storage. This demonstrates that optically doped NFs represent viable sensor and transducer materials for food analysis with dipsticks.

Keywords: dipstick; biogenic amine; electrospun nanofibers; NIR dye; food analysis; reflectometry

1. Introduction

Biogenic amines (BAs) are important compounds that can determine the quality of food [1].

High levels of amines in food are produced by bacterial decarboxylation of amino acids and have been recognized as an important reason for seafood intoxication [2]. Hence, the determination of the concentration of BAs in fresh food is in high need to determine its freshness status. Papageorgiou and co-workers gave a review on food and beverage products that should be regularly tested since they contain BAs or may develop certain contents over (storage) time [3]. This raises interest in research on rapid and inexpensive optical detection methods and tools like dipsticks to determine BAs in food, not only for individual concentration levels but also as a sum parameter. According to the European Food Safety Authority (EFSA), the U.S. Food and Drug Administration (FDA) as well as the

Chemosensors2020,8, 99; doi:10.3390/chemosensors8040099 www.mdpi.com/journal/chemosensors

(2)

World Health Organization (WHO), there are limits for BA concentrations in food to control the food quality. Histamine is one of the most bioactive and toxic BAs. Histamine exists in the majority of foods and plays an important role in food intolerances [4]. If the histamine concentration in food exceeds 500 mg/kg, there is a high risk for food poisoning [3]. In addition, 5–10 mg of histamine might induce skin irritation, rashes, dilatation of peripheral blood vessels resulting in hypotension and headache, or contractions of intestinal smooth muscles causing diarrhea and vomiting [5]. Furthermore, 10 mg is regarded as a borderline for toxicity and 100 mg can result in medium toxic responses, and 1000 mg is considered as very toxic [3].

Optical detection of BAs is challenging because those are weak absorbers of visible light as most of them lack conjugated aromatic π-electron systems. The solution to this problem can be labeling or derivatization of BAs with chromophores or fluorophores. Additionally, the analyte has to be extracted from out of a complex matrix in food analysis. Therefore, the combination of separation techniques such as GC, HPLC, or capillary electrophoresis with optical, electrochemical, or mass spectrometric detection after BA derivatization was used recently [6–11]. Eventually, ELISAs [12] are used for BA determination in food samples. Those are highly selective and sensitive on the one hand but expensive, time-consuming, and require highly trained staff, on the other hand. In order to overcome these limitations, reasonably fast, low-cost, and portable chemo and biosensors are desired for rapid on-site analysis of BAs in food [13].

Frequently, chromogenic and fluorogenic dyes, such as acid-base indicators [14–16] porphyrins [17], phthalocyanines [18], chameleon dyes [19,20], coumarin derivatives [21], azo dyes [22,23], or nanomaterials are applied for optical BA determination. Cellulose-based microparticles bonded with a pH-indicator and a blue reference dye yielded in slow traffic light-responding (1.5 h) colorimetric sensors [16].

A very recent concept combined two layers for BA sensing, one with colorimetry and one for laser desorption ionization mass spectrometry [24]. Another study described the highly specific and sensitive detection of histamine in mackerel using thin-layer chromatography with visualization by spraying the sheets with ninhydrin and diazonium reagents [25]. Furthermore, an array of five pH-indicators was shown to respond quickly (10 min) and to differentiate between isobutylamine, triethylamine, and isopentylamine in ppm concentrations via RGB readout using a mobile phone [15]. Mobile phones have become increasingly popular in food sensing in recent years [26]. In most cases, array sensors require additional chemometric data treatment to decipher the individual BA and its concentration from the response received by multiple receptors of low selectivity SEM images [15,27]. Unlike arrays, dipsticks only need a one-point readout and are therefore much quicker and easier to be read out and thus deliver their response much faster. The development of dipsticks is beneficial since they are practical, simple, portable, easy to use, and thus do not require trained staff. Moreover, they have a much lower cost compared to instrumental methods of analysis [14]. In addition to that, colorimetric sensing of BAs using dipsticks provides a simple response based on the color change, and this leads to a yes/no answer besides the quantitative analysis [19,28].

Direct sensing of BAs was recently carried out using filter paper-based dipsticks containing an amine-reactive chromogenic probe and a reference dye. Quantitative determination of BAs could be successfully achieved either visually based on a color change or via luminescence. Digital images of the luminescence of sensor spots were taken, and the BA concentrations were derived from the red-to-green intensity ratio via ImageJ software [19]. As an alternative sensor concept to paper as support for the hydrogel carrying the sensing matrix, electrospun nanofibers on ITO sheets were employed. Dipsticks containing these nanofiber mats showed an up to six-fold higher sensitivity compared to those based on hydrogel sensor membranes containing the same dye [29]. This is due to the high surface area to volume ratio and the high porosity of electrospun nanofibers. Moreover, electrospun nanofibers were designed such that they were counter-charged with respect to BAs in order to achieve an additional enrichment effect.

Reflectometric detection of optical sensors raises interest, since it is a fast and simple technique.

Reflectometric sensors require a light source (which could be an inexpensive LED), a filter to select

(3)

the detection wavelength and a detector (which can be a low-cost digital camera). Evaluation of data can then be carried out by free available software. Hence, a complete sensor (array) can be obtained for a few hundred US-$ or less including detection equipment. BA sensing was carried out reflectometrically by a digital camera and data were analyzed using the color space of the International Commission on Illumination (CIE) system [16]. These sensors were applied for quantitation of various amines and ammonia produced during food ageing in food packages. Fish freshness was monitored reflectometrically using a colorimetric sensor of creatine in fish, which is an indicator for the fish ageing [30].

In order to create dipsticks for food analysis with improved features, the following novel features were implemented: (a) a sensor layer containing only one dye instead of two to simplify the dipsticks compared to earlier research [29]; (b) using reflectometry for a one-step detection (instead of a two-step detection process as formerly required with digital photography evaluation [19]); and (c) using an NIR chromogenic dye to reduce the effects of self-absorption and scatter upon measuring in real samples.

Therefore, for the first time, an NIR dye reactive to BAs was embedded into a mat of electrospun nanofibers to form reflectometric dipstick sensors. The electrospun nanofibers made from cellulose acetate (CA) are prepared by a simple standard electrospinning procedure and contain the S0378 cyanine dye which absorbs at 800 nm. CA is stable over a wide range of pH values and contains many hydroxyl (OH) and ester groups which render it highly hydrophilic. This allows easy access of polar analytes like BAs to the S0378 chemosensor embedded inside the NFs. Additionally, CA can be easily electrospun into layers of several tens of µ m, as common in optical chemical sensors. Primary amines react with the dye by an S

N

1 nucleophilic substitution mechanism which is accompanied by a color change from green to blue. Hence, the concentration of BAs can be determined based on reflectance detection which is a simple and fast readout. The equal response towards monoamines and diamines makes the dipstick an ideal tool for determination of the total amine content (TAC) in real samples which was demonstrated by monitoring the ageing of shrimp samples over time.

2. Materials and Methods

2.1. Materials

S0378 was from FEW Chemicals (www.few.de). The buffer N-cyclohexyl-2-amino ethanesulfonic acid (CHES) was from Roth (www.carlroth.de). Spermidine (SPR), putrescine (PUT), and histamine (HIS) were purchased from Sigma-Aldrich (www.sigmaaldrich.com), all as hydrochloride salts. Tyramine (TYR), cysteine (CYS), triethylamine (TEA) and dimethylamine, each as free base, were from Sigma, Mann research laboratories, Merck and Fluka, respectively. Cellulose acetate (CA) (Mw 30,000 Da, 39.8 wt% acetyl content) and human serum albumin (HSA) and all organic solvents (methanol, acetic acid and acetone) were obtained from Sigma-Aldrich. All chemicals were of analytical grade. Indium tin oxide (ITO) coated on polyethylene terephthalate (PET) with a surface resistivity 60 Ω/sq and 127 µm thickness was purchased from Sigma-Aldrich. Stock solutions of BA (10.0 mM) were prepared in CHES buffer (pH 9.7). Standard solutions of the BAs were freshly prepared by diluting stock solutions with CHES buffer. CHES buffer (5.00 mM) was prepared by dissolving of solid CHES (0.1036 g) in 100.0 mL of deionized water. The pH of CHES was adjusted with sodium hydroxide solution (1.00 M, from Merck (www.merckgroup.com)).

2.2. Apparatus

The electrospinning was performed using a home-built electrospinning setup (see Figure S1) with

an iseg T1 CP300p high voltage power supply (www.iseg-hv.com) and a syringe pump (Legato 180

from KD Scientific, www.kdscientific.com). Fiber mat thickness, fiber diameter, and images for pore

size determination were obtained by a scanning electron microscope (Zeiss/LEO 1530, City, Germany)

at 5.0 kV. Samples for SEM were cut with a pair of scissors and sputtered with gold for 30 s ( ≈ 7 nm

layer thickness). For the study of fiber morphology, fibers were randomly selected from different

(4)

regions of the SEM image. The fiber diameters within the field of view were quantified by ImageJ analysis software (ImageJ, National Institutes of Health). Within the same SEM image, pore regions were randomly analyzed. Pores surrounded by fiber networks were drawn manually and analyzed by ImageJ, where Feret’s diameter is reported as a pore size. A fraction of the sample prepared for pore size determination was cut and mounted on a 90

tilted high-profile SEM stub for determining the fiber mat thickness. Within the same sample, different locations (at least three) were imaged and analyzed for mat thickness. Image analysis was performed using the SEM software (Zeiss).

Reflectance spectra were acquired with an AB2 luminescence spectrometer with a 150 W xenon light source. The reference for reflectance spectra was MgSO

4

. The light was guided to the dipstick by a y-shaped bifurcated optical fiber, a fiber holder, and the samples were illuminated under an average illumination angle of 33

. The inner central fiber bundle at the tip of the bifurcated optical fiber collects the reflected light from the dipstick and guides it back into the spectrometer. Two wavelengths (650 and 635 nm) were used for illumination and the dipsticks were placed in home-made black plastic holders below the tip of the optical fiber to ensure a flat and reproducible positioning of the dipsticks with respect to the incident light beam. The distance between the dipstick and the tip of the optical fiber is small (3 mm) to increase the collected reflected light and improve the sensitivity. The measurements were done in synchronous mode of the spectrometer i.e., the emission was measured at the same wavelength as the excitation. The band passes are 4 nm for both, excitation and emission monochromators.

The absorbance spectra were acquired on a Varian Cary 50 Bio photometer in quartz cells.

The emission spectra were obtained using an AB2 luminescence spectrometer equipped with a cell holder with 90

arrangement of excitation and emission beam and no fiber optic. The excitation wavelength was 600 nm and the bandpasses for excitation and emission were 4 nm and 8 nm, respectively.

2.3. Electrospinning of S0378-CA Fiber Mats

The polymer CA (0.720 g) and S0378 (30.00 mg) were dissolved in a mixture of 3.00 mL of acetic acid and 1.00 mL of acetone. Then, this spinning dope was first sonicated at room temperature for 30 min, then at 40

C for another 30 min and finally stirred for about 1 h until the mixture was completely homogeneous. The spinning dope was protected from light by Al-foil while stirring, storage, and electrospinning. The S0378-CA electrospun nanofibers were fabricated using an electrospinning setup with the following parameters: spinning dope in plastic syringe 5 mL (covered with aluminum foil); voltage 17 kV; flow rate 0.002 mL/min; tip-to-collector distance, 11 cm, 15 min spinning time (see Table S1). An ITO sheet (size 7 × 5 cm) was used as a supporting material. Electrospun fiber mats deposited on ITO should be stored in a desiccator.

2.4. Preparation of Dipsticks and BA Determination

The dipsticks with S0378-CA nanofibers (Ø = 8 mm) were cut from the ITO sheets with a toggle press from BERG & SCHMID (www.bergundschmid.de) and placed on black, solvent-resistant plastic positioners. After that, 10.00 µL of either BA (in CHES buffer, pH 9.7) or an extract from the real sample were added onto the spots. The color change of the dipsticks took place at 130

C for 30 min in an oven.

The reflectance was measured two times for each dipstick before and after the reaction with BAs.

2.5. Preparation of Real Samples

Histamine concentration in real samples was determined using methanolic extraction and a matrix

matched calibration curve for concentration determination. The extraction follows the AOAC method

35.1.32 [31] with slight modifications. Shrimp samples were purchased from a local supermarket and

stored at − 80

C. A 10.0 g portion was mixed with 50 mL of methanol in a beaker and homogenized in a

blender at the highest speed for 2 min. The homogenate was transferred into a conical flask and heated

at 60

C in a water bath for 30 min. 0.19 M Carrez solution I (potassium ferrocyanide) and 1.05 M

Carrez solution II (zinc acetate) were prepared in distilled water. In addition, 2 mL of each Carrez

solution were added to the shrimp extract before filtration of the homogenate for protein precipitation.

(5)

The extract was filtered through a porcelain Buchner funnel with blue ribbon filter paper (Schleicher und Schüll: 589

3

, www.whatman.com) twice to yield a clear solution. Then, different volumes were taken from the sample extract to achieve a suitable dilution factor on each ageing day and histamine solution was added to reach concentrations of 0–600 µ M of added histamine after dilution to 500 µ L overall volume with CHES buffer (5.00 mM; pH 9.7). After that, 10.00 µL of aliquot solutions were added onto dipsticks and the reflectance of each dipstick was measured, as indicated above.

3. Results and Discussion

3.1. Choice of Dye

The main idea of this work was to produce the first NIR-dye-embedded electrospun nanofiber mats which act as sensor layers in dipsticks for visual and reflectometric evaluation of BAs. Upon reaction with BAs (from real samples), the embedded dye shows a color change from green (λ

maxabs

= 800 nm) to blue (see Figures 1 and 2). The S0378 dye was chosen because of its chameleon property and the reaction with the BA (e.g., tyramine) occurs in CHES buffer at pH 9.7. This pH is required to warrant a free electron pair to be present at the amino group of the BA for a nucleophilic attack at the electrophilic carbon atom in the center of the π -electron system of the cyanine dye. Then, the electron-withdrawing chloro group is replaced by the electron-donating amino group of the BA in an S

N

1 reaction. This inexpensive cyanine dye was formerly used as long wavelength-absorbing protein label [32]. Additionally, the CA fibers assist in the response of the ENF mat as they are anionic at pH 9.7 and thus can attract cationic BAs from the sample.

Figure 1. Illustration of the formation of electrospun fiber mats containing the S0378 dye, the chemical

reaction of S0378 with BAs and the detection of the response of the dipstick. Unreacted nanofibers

containing the S0378 dye are electrospun to form a sensor mat on ITO (left). Upon reaction with a

biogenic amine (BA), a blue conjugate between S0378 and the BA is formed (top right). For quantitation

of the BA, the color change of the nanofiber mat is read by reflectometry (bottom right).

(6)

Figure 2. Absorption spectra of 5 µM S0378 dye upon binding to 5 µM Tyramine at 80

C over time in CHES buffer.

Furthermore, the emission maxima of S0378 at 663 nm and at 820 nm strongly decrease upon conjugation with BAs as presented in Figure S2. Hence, the determination of BAs could be done by either fluorimetry or reflectometry. As the use of a simple detection method suitable for the evaluation of dipsticks was one of the major aims of this work, reflectometry based on the color change was chosen in this work.

The reflectance spectra of S0378 dye (spun into a fiber mat of CA polymer) show an overall decrease when reacted with tyramine (Figure 3). The sharp peaks between 400 nm and 525 nm are the characteristic peaks of the xenon excitation lamp and hence instrumental artifacts. Therefore, a much longer detection wavelength closer to the absorption maximum of S0378 is advisable for the reflectance measurements. This is further supported by the fact that the self-absorption of biological matter strongly decreases at longer wavelengths, which in turn can lead to higher reflectance. It was intended to detect food extracts, and the much higher reproducibility of the reflectance change at longer wavelengths 650 nm was chosen for method optimization and 635 nm for quantitative reflectance detection in real samples.

Figure 3. Reflectance spectra of a mat of S0378-CA nanofibers on a dipstick in absence (red) and reacted

with 1 mM of tyramine (black) (n = 3).

(7)

3.2. Choice of Nanofiber Materials, Conditions of Spinning, Reaction Temperature and Time, and Fiber Morphology

The spinning dope used for the electrospinning of the nanofibers was prepared by dissolving the S0378 dye and CA polymer in a solvent mixture of acetic acid and acetone. The electrospinning conditions, the polymer, and the solvents used resemble those used in an earlier study [29] except for dye concentration and spinning time. The concentration of the dye molecules was increased to enhance the sensitivity of the reflectance measurements. It was also tested if reducing the spinning time by half (15 min) still yields a stable fiber mat and avoids detachment of the mat off the ITO sheet.

Hence, the spinning time was varied between 15 min and 30 min and the dye concentration in the spinning dope between 7.5 mg/mL and 15 mg/mL. The effects on the change of the reflectance signal after a reaction of the fiber mat with histamine are depicted in Figure 4. Here, lower dye concentrations lead to lower changes of reflectance (∆R). In all combinations of dye concentration and spinning time

∆R increases with increasing concentration of HIS. On comparing the change of ∆R at 0.8 mM of HIS with ∆R in absence of HIS, there is not too large of a difference among all the four combinations of dye concentration and reaction time. Therefore, a concentration of the dye in the spinning dope of 7.5 mg/mL and 15 min spinning time were chosen to save dye and time for preparation of the sensor mats deposited on the dipstick. Other spinning conditions did not provide a larger dynamic range in calibration plots for determination of BAs. Humidity was controlled and kept in a range from 40%–55%. No effect on fiber quality on fiber was observed, if humidity remained in that range.

Figure 4. Effect of dye concentration and spinning time on the change of reflectance of the dipstick at 650 nm upon reaction with HIS solutions of 0, 0.01, 0.02, 0.04, 0.08, 0.1, 0.2, 0.4, 0.6, 0.8 and 1 mM (n = 4) at 70

C.

The reaction of the S0378-CA fiber mat and BAs on the dipsticks was allowed to develop at various temperatures after addition of histamine solution in CHES buffer (pH 9.7) to accelerate the color change.

Figure 5 shows that the reaction between the dye embedded inside the electrospun nanofibers was

carried out at three temperatures 70, 100, and 130

C for 30 min. The highest increase of the reflectance

is observed at 130

C. This was expected because it was known from earlier literature [32] that the

S

N

1 reaction of S0378 with e.g., amino-side chains of proteins is not fast, even in solution. In order to

obtain a wide detection range and a more reproducible response of the dipsticks, the reaction with

BAs was carried out at 130

C in all subsequent measurements. Figure S3 shows the response of the

dipsticks after different development times (10, 20, and 30 min at 70

C). A development time of 30 min

provided the highest change of reflectance and hence better sensitivity. No effect of humidity on the in

detected reflectance change was noticed, if humidity was in a 30%–65% range.

(8)

Figure 5. Effect of reaction temperature on the reflectance of the dipstick at 650 nm to HIS solutions of 0, 0.02, 0.04, 0.1, 0.2, 0.4, and 0.8 mM concentration in CHES buffer.

Characterizations of fiber morphology with respect to fiber mat thickness, pore size, pore density and diameter of the S0378-doped nanofibers prior to their reaction with BAs were performed by scanning electron microscope (SEM) images. An example of a nanofiber mat is displayed in Figure 6.

The thickness of the resulting fiber mat was determined to be 50.7 ± 8.4 µ m. The pore sizes are 2.80 ± 0.15 µm as determined by the Feret diameter (example given in Figure S4) from 1330 pores.

In addition, the density of pores is very high (~1.94 × 10

5

pores/mm

2

), thus providing a great surface area for interaction with BAs (see Table S1). The average diameter of the fibers is 496 ± 318 nm (n = 82).

The fibers are not round but have an overall shape of two fibers fused with one another (see Figure S5a).

Hence, there is a short and a long axis to describe the fiber size (see Figure S6), and the average ratio between the diameters along the short and long fiber axis is 0.62. This also explains the large standard deviation of the fiber diameter. The surface of the fibers is not smooth but rather undulated. After the reaction with 1.0 mM of tyramine in CHES buffer, the fibers became considerably thinner with average diameters of 165 ± 124 nm (n = 82) but still retained a rough surface (see Figure S5b).

Figure 6. Morphology of S0378-CA nanofibers electrospun for 15 min as taken by SEM with

2500-fold magnification.

(9)

3.3. Visible Color Change of Dipsticks

The S0378-CA fiber mats on the dipsticks are greenish and turn blue upon the reaction with a primary biogenic amine (like histamine in aqueous solution of pH 9.5–10). This is due to the S

N

1 nucleophilic substitution of the chlorine atom by the nitrogen atom of the BA. The blue color becomes more intense with increasing the BA concentration as displayed in Figure 7. This color change is most visible starting from a BA concentration of 0.2 mM, which nicely coincides with BA concentrations (0.3–1 mM) in foods that can induce serious health problems [19] but cannot be detected by the human nose. Reflectance detection based on the color change was chosen to determine BAs because it has a low instrumental demand and reasonable sensitivity. With an appropriate device at hand, in-field use of the dipsticks seems feasible, eventually even with less qualified personnel, at a later stage of application. Furthermore, reflectometry is the typical and well established method for evaluation of dipsticks and also the vision of the human eye is based on the perception of reflected light.

Figure 7. Visible color change of dipsticks with S0378-CA nanofibers with histamine solutions of different concentrations at 130

C for 30 min. (1) blank solution (CHES buffer); (2) 0.020; (3) 0.040;

(4) 0.060; (5) 0.080; (6) 0.10; (7) 0.20; (8) 0.40; (9) 0.60; (10) 0.80; (11) 1.0 mM, respectively, of histamine.

3.4. Assay Procedure for Quantitation of BAs

Nanofiber mat circles (Ø = 8 mm) were cut from the fiber mats sheets with a toggle press and placed on a positioning device made of black solvent-resistant plastic to absorb stray light. The dipsticks were illuminated by a Y-shaped bifurcated optical fiber (with red light) at 33

illumination angle and the original reflectance of each dipstick was measured as illustrated in Figures S7 and S8. A series of BA solutions of different concentrations was prepared and added onto the dipsticks for calibration.

The real sample extracts were delivered to the dipsticks as a methanolic/aqueous mixture using the standard addition method. After adding of the BA solution onto the dipstick, the liquid spread all over the dipstick area. The dipsticks were then transferred to glass slides to allow the reaction with the S0378 dye embedded in the fibers to occur in an oven at 130

C for 30 min. Then, the reflectance of all dipsticks was measured again. The reflectance of each dipstick was measured twice before and after the reaction with BAs. This considers potential differences of the reflectance of each dipstick originating from minute differences of the thickness of the fiber mats and of mispositioning. The percentage of the reflectance change was calculated by dividing the absolute difference of the dipstick reflectance before and after the reaction by the reflectance before the reaction multiplied by 100%. The reflectance change (∆R [%]) was then plotted against the concentration of the BA.

3.5. Calibration and Sensitivity

The effect of different BA concentrations on the reflectance of the dipsticks was studied for

four biogenic amines (spermidine, tyramine, putrescine, and histamine). Their calibration plots are

presented in Figures 8 and 9. Eleven concentrations (blank, 0.010, 0.020, 0.040, 0.080, 0.10, 0.20, 0.40,

0.60, 0.80, 1.0 mM) were used to cover the whole dynamic range of the dipstick until the saturation of

the change of reflectance was reached. Four replicates for each concentration were used. The calibration

curves for all BAs are not linear but rather resemble saturation curves. The signal increase is steeper at

lower concentrations (0–0.1 mM) than at higher concentrations (0.2–0.6 mM) and reaches saturation

(10)

for all of the tested BAs at 0.6 mM, except histamine. The dynamic ranges are 0.040–0.60, 0.080–0.60, 0.10–0.60, and 0.10–1.0 mM for SPR, TYR, PUT, and HIS, respectively. The LOD is the concentration which is corresponding to the blank signal plus three standard deviations. The LODs were found to be 30, 30, 80, and 90 µ M for SPR, TYR, PUT, and HIS, respectively. The dynamic ranges and LODs of all BAs are summarized in Table 1. All BAs have a similar response and sensitivity, even though one could expect to see a higher sensitivity for the diamines like putrescine and spermidine. Obviously, the average distance to the next proximate S0378 dye (embedded into either the same or neighbor fiber) is larger than the average length of putrescine or spermidine, respectively, so that no additional reaction occurs. Moreover, the steric hindrance of the secondary amino group on a S0378-spermidine conjugate is obviously too high to get access to the rigid conjugated π-system of a neighboring NIR dye. In addition, a further S

N

1 reaction of the secondary amino group with another S0378 molecule seems to be prevented. The very similar response of the NIR dye to all BAs is very beneficial for its use in dipsticks. Those are intended as screening tools for the determination of the overall content of BAs in a sample to unveil a suspicious one that then would be further inspected e.g., with HPLC-MS.

In this case, a very similar response (i.e., change of reflectance) of the dipsticks in response to all BAs is beneficial to determine the sum content of all BAs, irrespective of their chemical structure. This will reduce potential errors that might occur from overestimation of the S0378 dye towards diamine BAs.

The concentration range of BAs in foods that might be potentially dangerous for health is between 0.3 and 1.0 mM. The LODs and working ranges of the dipsticks are even sufficient to detect concentrations lower than 0.3 mM (Table 1). This is an advantage because uncritical concentrations of BAs as, e.g., naturally occurring in seafood are accessible. Moreover, one can follow the increase of the concentration of BAs during the ageing of seafood using a suitable dilution (see Section 3.7 on quantitation of BAs in real samples). This makes the dipsticks suitable tools to control food freshness or spoilage.

Figure 8. Calibration plot of the reflectometric response of the dipsticks to spermidine and tyramine

(illumination wavelength = 635 nm) (n = 4).

(11)

Figure 9. Calibration plot of the reflectometric response of the dipsticks to putrescine and histamine (illumination wavelength = 635 nm) (n = 4 (PUT), n = 6 (HIS)).

Table 1. Dynamic range and LOD derived from the reflectometric response of the dipsticks towards various BAs.

BA LOD (mM) Dynamic Range (mM)

SPR 0.030 0.040–0.60

TYR 0.030 0.080–0.60

PUT 0.080 0.10–0.60

HIS 0.090 0.10–1.0

3.6. Selectivity

The selectivity of the S0378-CA nanofibers was tested with the following substances: dimethylamine (DMA), triethylamine (TEA), human serum albumin (HSA), and cysteine (CYS) (Figure S9).

These particular substances were chosen to test the selectivity of the response of the dipsticks towards secondary amines, tertiary amines, proteins, and thiols (in absence of BAs). Being nucleophiles, those could interfere in the reaction of S0378 with a BA. The effect of those interferents depending on their concentrations on the reflectance of the dipstick was studied (Figure 10).

No significant interference on the reflectance is observed for DMA and TEA. The dye does not

react with secondary or tertiary amines but only with primary amino groups. This is probably due to

the higher steric hindrance of DMA and DEA and the low accessibility of the carbenium ion located

between the four methyl groups at the two indole moieties of S0378. The embedding of the dye

inside the fibers of the CA hydrogel should also contribute here. CYS only slightly decreases the

reflectance response of the dipsticks in general but has no concentration-dependent effect. Although

CYS has a primary amino group this group is still lowly protonated at the pH of the reaction (9.7)

because its pK

a

is 10.77 [33]. This means that deprotonated (and hence nucleophilic CYS) is present

only to a minute degree. CYS therefore mostly exists as zwitterion in which the amino group is not

available to react. Although the thiol group could act as an interfering nucleophile and react with the

NIR dye, it obviously is less reactive under the conditions of the dipstick reaction. HSA shows an

interference only at relatively high concentrations (0.04–0.2 mM). This could be expected because it

has various primary amino groups that could react with the dye. On the other hand, the CA polymer

in the dipsticks particularly hinders the access of larger macromolecules like proteins. Therefore,

the reaction of free amino groups of HSA is only possible at relatively high concentrations of the protein.

(12)

At c

HSA

> 0.2 mM, the fibers are destroyed. The reason for this is still unknown. The interference of proteins, however, might be relevant for the use of the dipsticks in real samples, but the common sample pretreatments for determination of BAs which use carrez solutions (this work), methanol [20,31,33], or trichloroacetic acid [19] warrant quantitative removal of proteins prior to use of the dipstick.

Figure 10. Selectivity of the dipstick towards DMA, TEA, HSA and CYS (n = 4; illumination wavelength = 635 nm).

Additionally, the selectivity of the dipsticks towards tyramine in the presence of HSA interferent was tested. HSA (0.04 mM) was added to solutions with increasing concentrations of TYR and ∆R [%] was measured and compared to the ∆R of solutions of TYR of the same concentrations without HSA. The addition of HSA up to 0.04 mM does not affect the calibration plot of tyramine, as it is obvious from Figure 11. Obviously, the reaction rate of S0378 inside the fibers with primary amines is considerably higher than the reaction rate with amines of proteins due to steric hindrance. Hence, the dipsticks react selectively to primary (biogenic) amines as found in food samples, provided that an appropriate sample preparation is applied.

Figure 11. Effect of HSA interferent (0.04 mM) on the calibration plot of dipsticks with TYR (illumination

wavelength = 635 nm) (n = 4).

(13)

3.7. Quantitation of BAs in Real Samples

Finally, the response of the dipsticks to BAs in shrimp samples was tested over a 6-day storage period at room temperature. The extraction of the shrimp samples follows the AOAC method 35.1.32 [31] and standard additions were done. The methanolic extraction procedure works best in that it is fast, simple, and eliminates the interference of proteins to a major degree. Proteins denature and precipitate in methanol and can be removed with filtration. Carrez solution I (potassium ferrocyanide) and Carrez solution II (zinc acetate) were added to the shrimp extract before filtration to completely precipitate the proteins and avoid any interference. Histamine was chosen as BA as the standard to be added because it is the major BA present in seafood samples [28]. For each ageing day, a suitable dilution factor was used to remain in the dynamic range of the dipsticks for determination of HIS.

The development of the concentration of the BAs with the ageing of shrimp at room temperature as derived from the standard addition plots are given in Figure S10. The R

2

values for all of the linear fitting plots of the real samples exceed 0.96 (Table 2). These correlation coefficients are good considering that dipsticks are always less reproducible than instrumental analytical methods [19,29].

Table 2. TAC expressed as histamine concentration as determined in shrimp over various days of ageing at room temperature.

635 nm Dilution Factor Intercept Slope TAC (µmol/g) SD of TAC (%) R

2

day 0 1:10 11.97 79.38 7.54 ± 0.96 12.7 0.969

day 1 1:10 18.21 71.37 12.8 ± 0.8 6.02 0.986

day 6 1:20 12.52 57.61 21.7 ± 3.2 14.7 0.962

With respect to shrimp ageing at room temperature, the increase of the HIS concentrations found can also be translated into a total content of biogenic amines (TAC). The TAC is then expressed in equivalents of histamine ( µ mol HIS/g sample). Since histamine is the major biogenic amine occurring in seafood, its concentration is representative for the TAC [34]. Furthermore, the mean molar mass of the BAs found in food equals the molar mass of histamine. Histamine concentrations found in shrimp during ageing at room temperature were 7.54 ± 0.96, 12.8 ± 0.8 and 21.7 ± 3.2 µ mol/g (n = 4, each) on days 0, 1, and 6, respectively, as indicated in Table 2. These results (Figure S11) agree well with ageing profiles of real shrimp samples found in earlier work [35].

4. Conclusions

Chromogenic dipsticks based on electrospun CA nanofiber mats doped with S0378 dye are introduced for reflectometric determination of the content of biogenic amines (BAs) in food samples.

S0378 is a chameleon amine-reactive dye which changes its color from green to blue when conjugated

to primary amino groups. Hence, the reaction of dipsticks with BAs was monitored via reflectance

measurement. The dipsticks can also be used for a yes/no qualitative analysis by the naked eye for

determination of potentially dangerous concentrations of biogenic amines. Various biogenic amines

such as histamine, tyramine, putrescine, and spermidine, respectively, all show an equal reflectance

response. The selectivity of the dipsticks towards primary amines over secondary and tertiary amines is

very good and only high protein concentrations may interfere. For real samples, this fact is unimportant,

since the sample preparation usually involves steps for protein precipitation. Quantitative analysis

of BAs in shrimp samples at room temperature successfully delivered a typical profile of the BA

concentration upon ageing of the sample, in agreement with previous studies. Hence, these dipsticks

show that electrospun nanofibers are very useful sensor materials for monitoring food freshness using

innovative and a simple device.

(14)

Supplementary Materials: The following are available online at http://www.mdpi.com/2227-9040/8/4/99/s1, Figure S1: Image of the electrospinning setup with voltage supply and syringe pump, Figure S2: Change of the fluorescence emission of 5 µM S0378 dye upon binding to 5µM Tyramine at 80

C over time in CHES buffer, Figure S3: Effect of reaction time on the reflectance of the dipstick at 650 nm to HIS solutions of 0, 0.02, 0.04, 0.1, 0.2, 0.4, 0.8 mM, Figure S4: Representative sample for calculation of the pore size as indicated by the Feret diameter, Figure S5: Morphology of S0378-CA nanofibers electrospun for 15 min as taken by SEM, Figure S6:

Sketch of cross-sectional view of fused S0378-CA nanofibers, Figure S7: Instrumental setup used for reflectometric measurements, Figure S8: Close-up view on the dipsticks on the sample holder during detection, Figure S9:

Structure of the potential interferents tested with the dipsticks, Figure S10: Calibration plots obtained from the change of the reflectance upon ageing of shrimp at room temperature using standard additions and the dilution factors given in Table 2 on days 0, 1, and 6, Figure S11: Bar plot of the TAC of shrimp ageing at room temperature over 6 days. Table S1. Spinning conditions and fiber (mat) characterization data.

Author Contributions: Conceptualization, A.D. and A.J.B.; methodology, A.D. and S.N.M.; software, S.N.M., N.W. and M.S.; validation, S.N.M. and A.D.; formal analysis, S.N.M., A.D., N.W., and M.S.; investigation, S.N.M.;

resources, A.J.B. and A.D.; data curation, S.N.M.; writing—original draft preparation, S.N.M.; writing—review and editing, S.N.M. and A.D.; visualization, S.N.M. and A.D.; supervision, A.D. and A.J.B.; project administration, A.D.; funding acquisition, University of Regensburg and DAAD. All authors have read and agreed to the published version of the manuscript.

Funding: S.N.M. received support from the German Academic Exchange Service (DAAD) for a German-Egyptian Research Long-term Scholarship No. 91614688.

Conflicts of Interest: The authors declare no conflict of interests.

References

1. Oliveira, J.; Mantoanelli, F.; Moreira, L.; Elisabete, G.; Pereira, A. Dansyl chloride as a derivatizing agent for the analysis of biogenic amines by CZE-UV. Chromatographia 2020, 83, 767–778. [CrossRef]

2. Chong, C.Y.; Bakar, F.A.; Russly, A.R.; Jamilah, B.; Mahyudin, N.A. The effects of food processing on biogenic amines formation. Int. Food Res. J. 2011, 18, 867–876.

3. Papageorgiou, M.; Lambropoulou, D.; Morrison, C.; Kłodzi ´nska, E.; Namie´snik, J.; Płotka-Wasylka, J.

Literature update of analytical methods for biogenic amines determination in food and beverages. TrAC Trends Anal. Chem. 2018, 98, 128–142. [CrossRef]

4. Kettner, L.; Seitl, I.; Fischer, L. Evaluation of porcine diamine oxidase for the conversion of histamine in food-relevant amounts. J. Food Sci. 2020, 85, 843–852. [CrossRef]

5. Dong, H.; Xiao, K. Modified QuEChERS combined with ultra high performance liquid chromatography tandem mass spectrometry to determine seven biogenic amines in Chinese traditional condiment soy sauce.

Food Chem. 2017, 229, 502–508. [CrossRef]

6. Önal, A. A review: Current analytical methods for the determination of biogenic amines in foods. Food Chem.

2007, 103, 1475–1486. [CrossRef]

7. Mohammed, G.I.; Bashammakh, A.S.; Alsibaai, A.A.; Alwael, H.; El-Shahawi, M.S. A critical overview on the chemistry, clean-up and recent advances in analysis of biogenic amines in foodstuffs. TrAC Trends Anal. Chem.

2016, 78, 84–94. [CrossRef]

8. Erim, F.B. Recent analytical approaches to the analysis of biogenic amines in food samples. TrAC Trends Anal. Chem. 2013, 52, 239–247. [CrossRef]

9. He, L.; Xu, Z.; Hirokawa, T.; Shen, L. Simultaneous determination of aliphatic, aromatic and heterocyclic biogenic amines without derivatization by capillary electrophoresis and application in beer analysis.

J. Chromatogr. A 2017, 1482, 109–114. [CrossRef]

10. Li, D.W.; Liang, J.J.; Shi, R.Q.; Wang, J.; Ma, Y.L.; Li, X.T. Occurrence of biogenic amines in sufu obtained from Chinese market. Food Sci. Biotechnol. 2019, 28, 319–327. [CrossRef]

11. Vanegas, D.C.; Patiño, L.; Mendez, C.; de Oliveira, D.A.; Torres, A.M.; Gomes, C.L.; McLamore, E.S. Laser scribed graphene biosensor for detection of biogenic amines in food samples using locally sourced materials.

Biosensors 2018, 8, 42. [CrossRef]

12. Huisman, H.; Wynveen, P.; Nichkova, M.; Kellermann, G. Novel ELISAs for screening of the biogenic amines

GABA, glycine, β-phenylethylamine, agmatine, and taurine using one derivatization procedure of whole

urine samples. Anal. Chem. 2010, 82, 6526–6533. [CrossRef] [PubMed]

(15)

13. Danchuk, A.I.; Komova, N.S.; Mobarez, S.N.; Doronin, S.Y.; Burmistrova, N.A.; Markin, A.V.; Duerkop, A.

Optical sensors for determination of biogenic amines in food. Anal. Bioanal. Chem. 2020, 412, 4023–4036.

[CrossRef] [PubMed]

14. Xiao-Wei, H.; Zhi-Hua, L.; Xiao-Bo, Z.; Ji-Yong, S.; Han-Ping, M.; Jie-Wen, Z.; Li-Min, H.; Holmes, M.

Detection of meat-borne trimethylamine based on nanoporous colorimetric sensor arrays. Food Chem. 2016, 197, 930–936. [CrossRef]

15. Bueno, L.; Meloni, G.N.; Reddy, S.M.; Paixão, T.R.L.C. Use of plastic-based analytical device, smartphone and chemometric tools to discriminate amines. RSC Adv. 2015, 5, 20148–20154. [CrossRef]

16. Schaude, C.; Meindl, C.; Fröhlich, E.; Attard, J.; Mohr, G.J. Developing a sensor layer for the optical detection of amines during food spoilage. Talanta 2017, 170, 481–487. [CrossRef]

17. Roales, J.; Pedrosa, J.M.; Guillén, M.G.; Lopes-Costa, T.; Pinto, S.M.A.; Calvete, M.J.F.; Pereira, M.M. Optical detection of amine vapors using ZnTriad porphyrin thin films. Sens. Actuators B Chem. 2015, 210, 28–35.

[CrossRef]

18. Banimuslem, H.; Hassan, A.; Basova, T.; Esenpinar, A.A.; Tuncel, S.; Durmu¸s, M.; Gürek, A.G.; Ahsen, V.

Dye-modified carbon nanotubes for the optical detection of amines vapours. Sens. Actuators B Chem. 2015, 207, 224–234. [CrossRef]

19. Steiner, M.S.; Meier, R.J.; Duerkop, A.; Wolfbeis, O.S. Chromogenic sensing of biogenic amines using a chameleon probe and the red-green-blue readout of digital camera images. Anal. Chem. 2010, 82, 8402–8405.

[CrossRef]

20. Khairy, G.M.; Azab, H.A.; El-Korashy, S.A.; Steiner, M.S.; Duerkop, A. Validation of a fluorescence sensor microtiterplate for biogenic amines in meat and cheese. J. Fluoresc. 2016, 26, 1905–1916. [CrossRef]

21. Lee, B.; Scopelliti, R.; Severin, K. A molecular probe for the optical detection of biogenic amines. Chem. Commun.

2011, 47, 9639–9641. [CrossRef] [PubMed]

22. Mohr, G.J. A tricyanovinyl azobenzene dye used for the optical detection of amines via a chemical reaction in polymer layers. Dye Pigment. 2004, 62, 77–81. [CrossRef]

23. Mastnak, T.; Lobnik, A.; Mohr, G.J.; Finšgar, M. Indicator layers based on ethylene-vinyl acetate copolymer (EVA) and dicyanovinyl azobenzene dyes for fast and selective evaluation of vaporous biogenic amines.

Sensors 2018, 18, 4361. [CrossRef] [PubMed]

24. Siripongpreda, T.; Siralertmukul, K.; Rodthongkum, N. Colorimetric sensor and LDI-MS detection of biogenic amines in food spoilage based on porous PLA and graphene oxide. Food Chem. 2020, 329, 127165. [CrossRef]

25. Yu, H.; Zhuang, D.; Hu, X.; Zhang, S.; He, Z.; Zeng, M.; Fang, X.; Chen, J.; Chen, X. Rapid determination of histamine in fish by thin-layer chromatography-image analysis method using diazotized visualization reagent prepared with: P -nitroaniline. Anal. Methods 2018, 10, 3386–3392. [CrossRef]

26. Nelis, J.L.D.; Tsagkaris, A.S.; Dillon, M.J.; Hajslova, J.; Elliott, C.T. Smartphone-based optical assays in the food safety field. TrAC Trends Anal. Chem. 2020, 129, 115934. [CrossRef]

27. Wojnowski, W.; Kalinowska, K.; Majchrzak, T.; Płotka-Wasylka, J.; Namie´snik, J. Prediction of the biogenic amines index of poultry meat using an electronic nose. Sensors 2019, 19, 1580. [CrossRef]

28. Basavaraja, D.; Dey, D.; Varsha, T.L.; Thodi, F.; Salfeena, C.; Panda, M.K.; Somappa, S.B. Rapid Visual Detection of Amines by Pyrylium Salts for Food Spoilage Taggant. ACS Appl. Bio Mater. 2020, 3, 772–778.

[CrossRef]

29. Yurova, N.S.; Danchuk, A.; Mobarez, S.N.; Wongkaew, N.; Rusanova, T.; Baeumner, A.J.; Duerkop, A.

Functional electrospun nanofibers for multimodal sensitive detection of biogenic amines in food via a simple dipstick assay. Anal. Bioanal. Chem. 2018, 410, 1111–1121. [CrossRef]

30. Fazial, F.F.; Tan, L.L.; Zubairi, S.I. Bienzymatic creatine biosensor based on reflectance measurement for real-time monitoring of fish freshness. Sens. Actuators B Chem. 2018, 269, 36–45. [CrossRef]

31. AOAC Official. Methods of Analysis, 16th ed.; AOAC: Washington, DC, USA, 1995.

32. Gorris, H.H.; Saleh, S.M.; Groegel, D.B.M.; Ernst, S.; Reiner, K.; Mustroph, H.; Wolfbeis, O.S. Long-wavelength absorbing and fluorescent chameleon labels for proteins, peptides, and amines. Bioconjug. Chem. 2011, 22, 1433–1437. [CrossRef] [PubMed]

33. Harris, D.C. Quantitative Chemical Analysis, 6th ed.; W.H. Freeman and Company: New York, NY, USA, 2003;

ISBN 0-7167-4464-3.

(16)

34. Hwang, D.F.; Chang, S.H.; Shiau, C.Y.; Cheng, C. Biogenic amines in the flesh of sailfish (Istiophorus platypterus) responsible for scombroid poisoning. Food Sci. 1996, 60, 926–928. [CrossRef]

35. Azab, H.; El-Korashy, S.A.; Anwar, Z..; Khairy, G.M.; Steiner, M.S.; Duerkop, A. High-throughput sensing microtiter plate for determination of biogenic amines in seafood using fluorescence or eye-vision. R. Soc. Chem.

2011, 136, 4492–4499. [CrossRef] [PubMed]

Publisher’s Note: MDPI stays neutral with regard to jurisdictional claims in published maps and institutional affiliations.

© 2020 by the authors. Licensee MDPI, Basel, Switzerland. This article is an open access

article distributed under the terms and conditions of the Creative Commons Attribution

(CC BY) license (http://creativecommons.org/licenses/by/4.0/).

Abbildung

Figure 1. Illustration of the formation of electrospun fiber mats containing the S0378 dye, the chemical reaction of S0378 with BAs and the detection of the response of the dipstick
Figure 2. Absorption spectra of 5 µM S0378 dye upon binding to 5 µM Tyramine at 80 ◦ C over time in CHES buffer.
Figure 4. Effect of dye concentration and spinning time on the change of reflectance of the dipstick at 650 nm upon reaction with HIS solutions of 0, 0.01, 0.02, 0.04, 0.08, 0.1, 0.2, 0.4, 0.6, 0.8 and 1 mM (n = 4) at 70 ◦ C.
Figure 6. Morphology of S0378-CA nanofibers electrospun for 15 min as taken by SEM with 2500-fold magnification.
+6

Referenzen

ÄHNLICHE DOKUMENTE

b The verification of the tri-lineage differentiation ability of adipogenesis, osteogenesis, as well as chondrogenesis of hBM-MSC by Oli Red O staining, Alizarin Red Staining and

(a-d) MiR-100 mice showed no altered glucose tolerance in the GTT (a+b) and insulin sensitivity in the ITT (c+d) compared to wildtype animals fed normal chow diet before the

Results based on BLASTx hits to protein models from Drosophila melanogaster (Dm), Tribolium castaneum (Tc), Dendroctonus ponderosae (Dp), and Anaplophora glabripennis (Ag)..

[1] Lole KS, Bollinger RC, Paranjape RS, Gadkari D, Kulkarni SS, Novak NG, Ingersoll R, Sheppard HW, Ray SC (1999) Full-length human immunodeficiency virus type 1 genomes from

Thick lines represent the slope estimates for users and non-users over time, adjusted for covariates.. Thin lines represent the adjusted slope estimates for

Shown are trajectories with R 2 -values that are at least 0.9 or higher (C) Probability-plot showing the normalized probability of finding exponent in our RibE-mV SPT dataset..

(((((((((((((((((((((rheumatoid) AND pannus)) OR (((rheumatoid) AND fibroblast) AND synovial)) OR ((rheumatoid) AND purpura)) OR ((rheumatoid) AND vasculitis)) OR ((rheumatoid)

bDMARD, biologic disease-modifying antirheumatic drug; COVID-19, the 2019 novel coronavirus