Fakultät Maschinenwesen Institut für Werkstoffwissenschaft
Diplomarbeit
Thema
Vorgelegt von
geboren am in
Studiengang
zur Erlangung des akademischen Grades
Diplomingenieur (Dipl. Ing.)
Betreuer
Verantwortlicher Hochschullehrer
Dissertation
Influence of microstructure features on the irradiation behaviour
of ODS Fe-14Cr alloys
submitted by Dipl.-Ing. Isabell Hilger
in partial fulfillment of the requirements for the Degree of Doctor engineer (Dr.-Ing.)
to the Faculty of Mechanical Science and Engineering of the Technical University Dresden
March 2017
To Anton and Martha.
You are the final proof that it is the tiny things that matter.
ii
Declaration
The research described in the thesis ’Influence of microstructure features on the irradiation behaviour of ODS Fe-14Cr steels’ was carried out by the author, Isabell Hilger, in the Institute of Ion-Beam Physics and Materials Research at the Helmholtz- Zentrum Dresden-Rossendorf. All the work is original and where work from others has been included it has been clearly referenced and acknowledged. No part of this thesis has been submitted or accepted for any other degree at this university or elsewhere.
Parts of this work have been published in peer reviewed journals or presented at conferences and workshops as listed in ’Presentations and Publications’.
Dresden, 01.03.2017
...
Isabell Hilger, Author
Contents
Abstract 1
1 Introduction 3
1.1 Background . . . 3
1.2 State of the art . . . 3
1.2.1 Advanced steels for nuclear applications . . . 3
1.2.2 Irradiation effects . . . 5
1.2.3 Oxide dispersion strengthened (ODS) steels . . . 9
1.3 Motivation and Scope. . . 15
2 Experimental work 17 2.1 Material production. . . 17
2.1.1 Powder production . . . 17
2.1.2 Consolidation and heat treatment . . . 18
2.2 Sample preparation . . . 19
2.3 Ion-irradiation. . . 19
2.4 Microstructure characterization . . . 22
2.4.1 Matrix characterization. . . 22
2.4.2 Particle characterization . . . 23
2.5 Investigation of the irradiation behaviour . . . 26
3 Experimental results 29 3.1 Microstructure . . . 29
3.1.1 Matrix - Grain size distribution . . . 29
3.1.2 Particle size and spatial distribution . . . 31
3.1.3 Particle composition and structure . . . 35
3.2 Characterization of the irradiation behaviour . . . 41
4 Discussion 45 4.1 Influence of Y2O3 addition and milling parameters on the microstructure 45 4.1.1 Matrix . . . 45
4.1.2 Strengthening particles . . . 47
4.2 Evaluation of the produced material. . . 57
4.2.1 ODS samples . . . 57
4.2.2 Non-ODS reference samples . . . 57
4.3 Irradiation behaviour . . . 58
4.3.1 Hardness of the un-irradiated material . . . 58
4.3.2 Pure displacement damage (single-beam irradiation). . . 60
4.3.3 Simultaneous helium implantation (dual-beam irradiation) . . 62
5 Conclusions 66
6 Outlook 69
7 Acknowledgement 70
A Presentations and Publications 71
Bibliography 74
Nomenclature
∆η Scattering contrast
∆Hi Irradiation-induced hardening λ Neutron wave length
Θ Scattering angle
þki Vector of incident neutron beam þks Vector of scattered neutron beam Ac Contact area
bmag Magnetic moment c Particle volume fraction dΣ/dΩ(Q) Scattering cross-section
d Grain size
Dmax Maximum separation distance between atoms in a cluster h Indentation depth
hc Contact depth Hi Indentation hardness l Inter-particle distance N Particle number density
Nmin Minimum number of atoms per cluster P(Q, R) Shape factor
Q Scattering vector R Particle radius Rm Mean particle radius Rz Zener radius
S(Q) Structure factor
T Temperature
Tm Melting temperature
V(R) Volume of scattering particle appm atomic parts per million APT Atom probe tomography bcc body-centered cubic
CSM Continuous stiffness measurement
DB Dual-beam
DBTT Ductile-to-brittle transition temperature DIC Dual implantation chamber
dpa displacements per atom
EBSD Electron backscatter diffraction EDM Electrical discharge machining EELS Electron energy loss spectroscopy fcc face-centered cubic
FIB Focused ion beam HIP Hot isostatic pressing IBC Ion beam center
IPF Inverse pole figure NI Nanoindentation
ODS Oxide dispersion strengthening PKA Primary knock-on atom
QCSM Quasi continuous stiffness measurement RAFM Reduced-activation ferritic/martensitic steel rpm revolutions per minute
RT Room temperature
SANS Small angle neutron scattering SB Single-beam
SEM Scanning electron microscopy SIA Self-interstitial atom
SPS Spark plasma sintering
SRIM Stopping and range of ions in matter STEM Scanning transmission electron microscopy TEM Transmission electron microscopy
USE Upper shelf energy
XPS X-ray photoelectron spectroscopy XRD X-ray diffraction
List of Figures
1.1 Damage cascade generated by neutron irradiation . . . 5
1.2 Irradiation-induced secondary defects . . . 7
1.3 Irradiation-induced embrittlement . . . 8
1.4 General powder-metallurgy fabrication route for ODS steels . . . 10
1.5 Typical microstructure of an ODS steel . . . 12
1.6 Imaging techniques for ODS steel characterization . . . 13
1.7 Spatial resolution vs. analysed volume of applied characterization techniques . . . 14
2.1 SEM micrographs of the used raw powders . . . 17
2.2 Particle size distribution of the used steel powder . . . 18
2.3 Example of a sintering curve for the produced material . . . 19
2.4 Principle of dual-beam ion irradiation . . . 20
2.5 Irradiation profile of implanted Fe and He . . . 21
2.6 Typical setup for Electron Backscatter Diffraction (EBSD) . . . 22
2.7 Area selection for EBSD measurement . . . 23
2.8 Small angle neutron scattering (SANS) principle . . . 25
2.9 Atom Probe Tomography (APT) principle . . . 26
2.10 Nanoindentation (NI) setup and load curve . . . 27
2.11 Grain size area separation by means of EBSD/FSE imaging . . . 28
3.1 Grain size distribution of non-ODS samples . . . 29
3.2 Grain size distribution of ODS samples . . . 30
3.3 Inverse pole figure (IPF) maps of non-ODS samples . . . 31
3.4 Inverse pole figure (IPF) maps of ODS samples C and D . . . 32
3.5 Inverse pole figure (IPF) maps of ODS samples E and F . . . 33
3.6 TEM micrograph: ultrafine grains (UFG) in an ODS sample . . . 34
3.7 Fitted scattering curves and particle size distributions obtained from Small-angle Neutron Scattering (SANS). . . 38
3.8 3D atom maps of non-ODS samples obtained from Atom Probe To- mography (APT) . . . 39
3.9 3D atom maps of ODS samples obtained from Atom Probe Tomography (APT) . . . 40
3.10 Indentation hardness curves of unirradiated samples . . . 42
3.11 Indentation hardness curves in unirradiated vs. both ion-irradiated states 43 3.12 Indentation hardness in unirradiated and both irradiated states . . . 44
4.1 Micrograph of milled ODS powder. . . 49
4.2 TEM micrograph showing faceted particles aligned in planes . . . 50 4.3 TEM micrograph of ODS particles inside matrix grains . . . 51 4.4 Ternary diagram of Y-Ti-O ODS particle composition (APT). . . 54 4.5 Measured A-ratios vs. calculated values of structures reported in the
literature. . . 56 4.6 Irradiation-induced hardening after single-beam Fe-ion irradiation . . 60 4.7 Irradiation-induced hardening after dual-beam Fe+He-ion irradiation 62 4.8 Irradiation-induced hardening after single-beam Fe-ion irradiation vs.
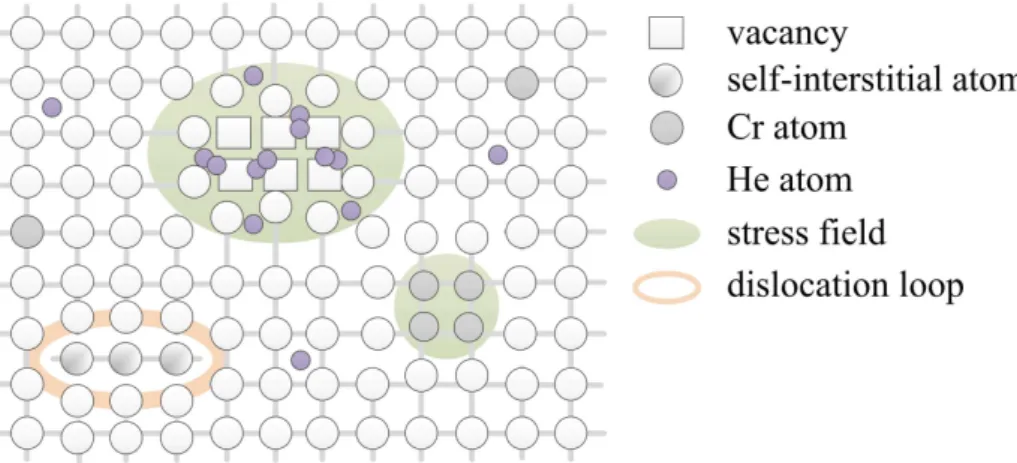
dual-beam Fe+He-ion irradiation . . . 63 4.9 Mechanisms leading to high radiation resistance in ODS steel after
dual-beam Fe+He-ion irradiation . . . 65
List of Tables
2.1 Composition of the pre-alloyed steel powder provided by Nanoval. All values are given in wt.%. . . 17 2.2 Y2O3 content and milling conditions of the mechanically alloyed powders 18 2.3 Irradiation parameters applied for single-beam (SB) and dual-beam
(DB) ion irradiation. . . 21 3.1 Mean grain sized of ultrafine and coarser grain fractions. . . 29 3.2 Size Rm, number density N and volume fraction c of the scattering
features obtained by means of SANS. . . 34 3.3 A-ratio of the particles analysed by means of SANS. . . 36 3.4 Y:Ti:O composition, Y:Ti ratio and (Y+Ti):O ratio of clusters analysed
by means of APT.. . . 36 4.1 Calculated values of the A-ratio for different kinds of scatterers in a
Fe-14Cr matrix. . . 53 4.2 Dimensions of relevant microstructure features including grain size d
and mean inter-particle distance l, according to equation 4.5 [53, 158], of the discussed samples. . . 58 4.3 Indentation hardness Hi of all irradiated samples and unirradiated
references at a reference depth of 100 nm, as well as the derived irradiation-induced hardening ∆Hi after single-beam Fe irradiation (SB) and dual-beam Fe + He irradiation (DB). . . 58
Abstract
Understanding the mechanisms that lead to an elevated radiation resistance of structure materials poses a basis for successful design of structural materials for application in future nuclear fission and fusion reactors. Several studies revealed oxide-dispersion strengthended (ODS) ferritic steels to be promising candidates for such applications.
However, there are contradictory observations concerning the irradiation behaviour of ODS alloys and their non-ODS counterparts. Both, grain size and ODS particles seem to play an important role under certain conditions, but as the addition of ODS particles also leads to a reduced grain size, it is not easy to distinguish between the two effects. One of the key issues in many studies is the lack of suitable references in terms of comparable microstructure features (either grain size or particles). Moreover, detailed knowledge of the microstructure and nanostructure of the respective material is necessary to evaluate irradiation effects.
The approach of this work is to produce an own set of ODS samples and non-ODS references with comparable microstructures and well-defined differences in grain size and/or particle size distribution. This allows the particle effect and the grain boundary effect to be separated. As helium was shown to play an important role in terms of irradiation damage (which is of particular interest for fusion applications), its role concerning the irradiation damage in ODS steels has to be evaluated.
Fe-14Cr-1W-0.4Ti (+ 0.3/0.6 wt.% Y2O3) samples were produced by means of me- chanical alloying (MA) and consolidation via spark plasma sintering (SPS). Differences in the final microstructure were obtained by a systematic variation of the amount of added Y2O3, milling parameters and heat treatment. The microstructure of all samples was characterized with respect to their matrix grain size (Electron backscatter diffraction, EBSD), particle size distribution (Small angle neutron scattering, SANS), as well as the composition and structure of the strengthening particles (SANS + Atom probe tomography, APT). Based on the obtained data from microstructure characteri- zation, one non-ODS reference and two ODS samples were chosen for ion-irradiation.
They were irradiated at room temperature in single-beam mode with iron (Fe) ions and dual-beam mode with iron and helium (Fe + He) ions prior to the characterization of irradiation-induced hardening by means of nanoindentation.
All ODS samples were found to exhibit a bimodal grain size distribution, which was utilized for the separation of the grain boundary effect from the particle effect by separately investigating coarser and ultrafine-grained areas within the same sample.
The applied milling parameters were found to have strong impact on oxide particle size and spatial distribution. Incomplete formation and inhomogeneous spatial distribution of oxide nanoparticles were observed after milling for 20 h at 150 rpm. Higher milling time and speed (50 h at 250 rpm) lead to complete formation and homogeneous spatial
distribution of oxide nanoparticles. The smallest particles (D≈3 nm), which provide the main particle-matrix interface area, were shown to be Y-Ti-O particles consistent with either Y2Ti2O7 orY2TiO5.
The irradiation behaviour varies significantly depending to the presence or absence of helium. After pure displacement damage (single-beam Fe ion irradiation), the fine-grained areas exhibit lower irradiation-induced hardening compared to the coarser- grained ones, without any influence of the particle content or size distribution. Under dual-beam Fe+He ion irradiation, the particles were found to have a strong impact on irradiation-induced hardening in addition to the grain size effect.
On the one hand, coherent interfaces, such as the one between face-centered cubis (fcc) Y2Ti2O7 particles and the body-centered cubic (bcc) Fe matrix were reported to be unattractive as sinks for radiation-induced primary defects. Grain boundaries, in contrast, act as traps for self-interstitial atoms (SIA) which can be re-emitted to annihilate with nearby vacancies. On the other hand, coherent interfaces are known to be attractive for He atoms and to promote He bubble formation. He atoms or bubbles in turn attract primary defects, which explains that oxide particles reduce dual-beam irradiation-induced hardening but not hardening induced by single-beam irradiation.
Due to the low inter-particle distance in the ODS material, there is a pronounced particle effect on irradiation-induced hardening after dual-beam irradiation.
By carefully varying the fabrication parameters and utilizing the bimodal grain size distribution in ODS steels, a separation of the ODS particle effect from the grain size effect was achieved. The investigation of irradiation-induced hardening after single- beam (Fe) and dual-beam (Fe+He) ion irradiation revealed important information about the important role of helium for the microstructure features to enhance radiation damage tolerance.
1 Introduction
1.1 Background
The rapidly growing world population and industrialization is leading to increasing energy demands. In parallel, fossil fuel resources are shrinking and carbon dioxide production needs to be limited. Under these aspects, nuclear power is highly attractive.
Therefore, research and development towards advanced nuclear power plants, such as Generation IV (GenIV) fission reactors and fusion reactors, have been intensified [1]. To implement future nuclear reactor concepts, dedicated material development is required, as components in both systems are exposed to high temperature and intense neutron radiation, potentially combined with reactive environments. Moreover, helium from (n,α) transmutation reactions plays a role, especially in materials for application in fusion reactors.
In order to maintain functionality and safety of the components under these challenging environmental conditions, requirements which have to be met for the materials the components are made of, include:
• High strength and sufficient fracture toughness at room temperature
• High creep strength
• High thermal conductivity and low thermal expansion
• High corrosion resistance
• Low activation
• Tolerance towards irradiation-induced defects
This work is focused on the latter of the requirements mentioned above. In the last decades, much progress was achieved on the fields of nuclear material development and understanding of irradiation effects. An overview of the findings most relevant for this work is given in section 1.2.
1.2 State of the art
1.2.1 Advanced steels for nuclear applications
Originally, austenitic steels were frequently applied as structure material in nuclear technology due to their corrosion resistance and high temperature stability [2, 3].
1 Introduction
However, at high temperature and under intense neutron irradiation, austenitic steels tend to volumetric swelling and irradiation-induced creep [2,3]. Swelling is a phenomenon particularly pronounced for the fcc lattice of austenitic steels, so the problem cannot be solved by means of microstructural design unless steels with a bcc lattice are used. Besides their reduced tendency towards swelling, ferritic/martensitic steels exhibit higher thermal conductivity at lower thermal expansion and high corrosion resistance in potential cooling media such as helium [4].
In reduced activation ferritic/martensitic (RAFM) steels, elements that form long- living radionuclides (e.g. Mo, Ni, Nb, Cu, Al [1,5,6]) are substituted by low activation elements or elements forming short half-life radionuclides, such as W, Ti, V, Cr and Y [7, 8]. In the literature, two chromium contents are frequently chosen for different reasons: 9 wt.% [9–12] and 14 wt.% [13–17]. At 9 wt.% Cr irradiation-induced embrittlement was shown to be minimal [18], while at 14 wt.% Cr the corrosion resistance is higher and the matrix is fully ferritic as the gamma-range closes below 14%.
In order to extend the operation temperature window for creep limited applications, oxide dispersion strengthening was considered, as the oxide particles pose obstacles for plastic deformation up to high temperatures [19]. At the temperature range relevant for GenIV application (T≈ 650◦C < 0.4 Tm) Fe-14Cr alloys can be loaded up to high stresses before dislocation creep mechanisms apply [20]. Hence, the accompanying effect of grain refinement caused by oxide dispersion strengthening is not expected to have a negative effect on the creep behaviour.
In contrast to other precipitates, oxides are much more resistant to Ostwald ripening due to their insolubility in the matrix [21], so the strengthening effect mentioned above persists up to high temperatures. Usually, yttria (Y2O3) is used as a basis for the generation of the strengthening phase due to its high thermal stability [22].
Oxide particles are considered to improve the tolerance to irradiation-induced damage by providing a high number density of sinks for irradiation-induced primary defects and nucleation sites for small helium bubbles [21]. These sinks/traps are present in form of particle-matrix interfaces and grain boundaries due to a refined matrix microstructure. A closer insight into the irradiation behaviour of ODS steels is given in section 1.2.3.
As the advantages of ODS steels compared to non-ODS alloys arise from the oxide particles it contains, they are the main features to be tailored in order to improve the materials performance. For a maximum creep strength and particle-matrix interface area a high number density of particles is favourable. At constant volume fraction of the second phase, this is achieved by reducing the oxide particle size [23]. The co-addition of elements such as Nb, V, Zr or Ti results in a refinement of the oxide particles. In the work of Ukai and Fujiwara the smallest particle size of 3 nm, compared to 13 nm with only Y2O3 added, was achieved by the addition of Ti [24]. This effect was suspected to originate from the lower interface energy of the formed Y2Ti2O7 with the matrix, compared to Y2O3 [25]. The addition of Ti to the matrix was shown to increase the strength and fracture toughness in ODS Eurofer at low temperature [26].
1 Introduction
1.2.2 Irradiation effects Displacement damage
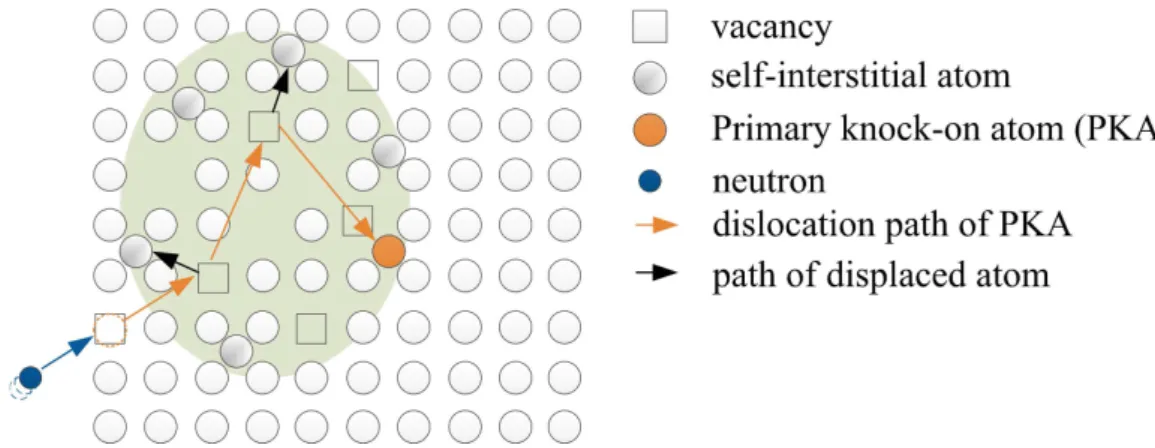
Under neutron irradiation, matrix atoms hit by neutrons are displaced from their lattice sites. These primary knock-on atoms (PKA) can, in turn, generate more recoiling atoms and vacancies in a cascade [1, 21, 27], as shown in Fig. 1.1.
Figure 1.1: Vacancies and self-interstitial atoms in a cascade generated by neutron irradiation.
The radiation damage from these collisions is quantified in displacements per atom (dpa), with 1 dpa corresponding to an average displacement of each atom once from its lattice site [28, 29]. Damage levels in practical application range between 90 dpa and 200 dpa for cladding tubes in GenIV fission reactors and reach up to 200 dpa in fusion reactor blankets [30]. The self interstitial atoms (SIA) and vacancies are referred to as (irradiation-induced) primary defects hereinafter. In the area of such cascades, a high density of primary defects can be found approximately 0.5 ps after the first collision [31].
SIA and vacancies diffuse away from the cascade (SIA much faster than vacancies) and some of them are lost at sinks (e.g. grain boundaries [31,32] or phase boundaries [33]).
A part of the SIA also recombines with already existing thermal vacancies. Due to the high diffusion coefficient of SIA (≈ 9·10−11 m2s−1 at 300◦C [34]), this will happen at the 10µs time scale. Some vacancies will find SIA and recombine with them. Due to the lower diffusion coefficient of vacancies (≈ 4 ·10−16 m2 s−1 at 300◦C [34]), this will happen at the 100 s time scale, that means four orders of magnitude slower than for SIA. As a result of the simultaneous production and loss of point defects, a steady state concentration of vacancies and SIA, depending on neutron flux, irradiation temperature, and sink strength, will be reached. The steady state concentration of vacancies is orders of magnitude larger than the vacancy concentration at thermal equilibrium and thus enhances vacancy-assisted solute atom diffusion. The same is applicable for the role of SIA on SIA-assisted solute atom diffusion, but for most of the solutes (except Mn), vacancy-assisted diffusion is dominant. Due to vacancy-enhanced
5
1 Introduction
solute atom diffusion, solute clusters such as Cu-clusters in reactor pressure vessel steels, or equilibrium-phase particles, such as α’-phase particles in >9%Cr steels, may form [35]. This typically happens at time scales from hours to years, depending on the type of solute. Clusters of SIA or vacancies form dislocation loops and voids (see Fig. 1.2).
Similar damage can be generated by the irradiation with ions (e.g. Fe ions). For experimental studies the use of ions instead of neutrons has a number of advantages [36]:
• Damage rates are 104times that of typical neutron irradiation (200 dpa achievable in days instead of decades)
• Little or no material activation under ion irradiation (sample handling)
• Better availability of ion sources
• Control of irradiation conditions (temperature, damage rate, damage level) is more practicable
• in-situ observation is possible
Although ion irradiation was found to be a reasonable way to emulate in-reactor conditions, the transferability is still limited due to the typical variation in the neutron flux, spectrum and temperature within one and between several cycles in the reactor.
These are hard to imitate by ion irradiation. Moreover, the shallow damage profile obtained by ion irradiation and the even smaller zone free of extrinsic effects is a challenge for post-irradiation characterization (more detail in section1.2.2). Was et al.
reported the zone free of extrinsic effects to be present in a depth of 500-700 nm after ion-irradiation with 5 MeV Fe2+ up to 188 dpa at 460◦C. Here, a surface effect (up to 300 nm in depth) and the suppression of void swelling by the injected SIA beyond a depth of 700 nm were taken into account. In the remaining zone the observed damage was very similar to that produced in a nuclear reactor under neutron irradiation [36].
In [37] damage production, microstructural evolution and steady state for high fluences are discussed with regard to the emulation of neutron damage by ion-irradiation. Was et al. showed, that indeed it is possible to produce defect structures very similar to such caused by neutrons, applying ion irradiation with a strict control of experimental parameters in a ferritic–martensitic steel [38].
The role of helium
In nuclear environments helium (He) is present as a product of (n, α) transmutation reactions [1]. The amount of He produced per dpa depends on the neutron spectrum, as well as on the alloy composition and varies from<1 appm/dpa in a fast fission spectrum over approximately 10 appm/dpa in a fusion spectrum [39–41] up to 100 appm/dpa in spallation targets [41]. In contrast to hydrogen, which is also formed in (n,p)
1 Introduction
Figure 1.2: Secondary defects formed from clustered irradiation-induced primary defects
transmutation reactions [41], He is practically insoluble in solids. As interstitial atoms He is highly mobile, even far below room temperature (RT) [42]. It tends to form clusters with vacancies which are immobilized as soon as a critical size is reached [43].
He can also easily be trapped by matrix defects, such as grain boundaries or dislocations.
A remarkably high binding energy of He atoms and vacancies was reported by Dai et al.[44]. Due to its insolubility, the supersaturated helium precipitates as molecular helium in the form of gas bubbles. It stabilizes vacancy clusters and enhances the formation of nanovoids, which act as a sinks for excess vacancies [27]. At T >0.5 Tm
even trapped He is mobilized and aggregates to form bubbles [44, 45]. These act as nucleation site for voids which leads to swelling. If bubbles are located at grain boundaries, the latter are weakened, which finally leads to intergranular fracture in addition to the helium embrittlement caused by bubbles inside the grains [44]. Grain boundaries and phase boundaries were shown to be preferential nucleation sites for He which, if present in a sufficient amount, decrease the number of helium bubbles formed in the matrix [46–48]. For an optimum He management, a high number density of microstructure features acting as nucleation site for small, subcritical helium bubbles is favourable.
Macroscopic irradiation effects
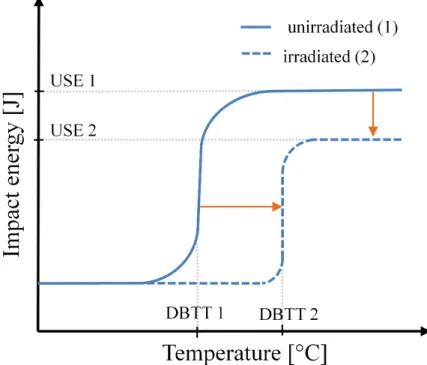
The defects formed under irradiation act as obstacles for dislocation movement. At room temperature, irradiation hardening, evident from higher yield strength, and ultimate tensile strength are the result. An accompanying increase in the ductile-to- brittle transition temperature (DBTT) and reduced upper shelf energy (USE) are evident from Charpy impact tests [49], as schematically shown in Figure 1.3. A loss in uniform and total elongation was shown by Rodriguez et al. [45]. At temperatures of 0.3 −0.6 Tm and displacement damage > 10 dpa, volumetric swelling due to the growth of voids was observed [50].
7
1 Introduction
The accumulation of helium at grain boundaries weakens the structure of the material and leads to intergranular fracture [1,51]. Exceeding the critical size, the bubbles turn into unstably growing voids [44], which results in volumetric swelling and blistering of the material at high helium doses [21].
Figure 1.3: Shift of upper shelf energy (USE) and ductile-to-brittle transition tem- perature (DBTT) as observed in Charpy impact tests due to irradiation damage.
Characterization of irradiation damage
There is no characterization technique which is able to reflect the whole spectrum of irradiation-induced damage. However, there are several techniques which, in combination, display the microstructural changes and their effect on the mechanical behaviour of the irradiated material.
Small angle neutron scattering (SANS) [52, 53] provides information on the size distribution and nature of the scattering defects such as precipitates, voids and gas bubbles. Transmission electron microscopy (TEM) is applied in order to visualize and quantify secondary defects, such as dislocation loops, voids, gas bubbles and precipitates [54, 55]. Atom probe tomography (APT) is used to gain information about the composition, size and three-dimensional spatial distribution of gas bubbles and precipitates formed due to radiation damage [56, 57]. Positron annihilation spectroscopy (PAS) is used for the detection of vacancies, vacancy clusters and gas
1 Introduction
bubbles [58, 59]. A combination of several of these techniques, depending on the desired information, is necessary to obtain reliable information on the irradiation damage.
For the handling and preparation of neutron-irradiated material, special safety precau- tions and waste disposal are necessary because the samples are usally radioactive. In case of SANS, no special preparation is necessary and handling is not much complicated by the work with neutron-irradiated samples, as the measurement anyway requires safety precautions due to the applied neutron radiation. The preparation of radioactive samples for TEM and APT is difficult, as they are very small and hard to handle in the so-called hot cells which act as radiation shield. If they are cut using focused ion beam (FIB), the overlapping damage originating from the FIB and the desired radiation damage need to be distinguished, if possible. Otherwise, the layer influenced by FIB damage must be neglected in the data evaluation. PAS measurements are influenced by the background caused by the activity of the samples, which complicates the data evaluation. For the characterization of mechanical properties, samples can be prepared and characterized at conventional facilities with radiation shield. Sample preparation usually causes relatively large amounts of radioactive waste and contamination which has to be removed carefully.
It is important to note that the choice of techniques and measuring parameters is limited for ion-irradiated material due to the small available sample volume. SANS is not practicable, as a sample thickness significantly larger than 1 µm is required for the measurements. TEM and APT samples have to be prepared very carefully in order to extract material from the ≈1 µm irradiated layer. Electro-chemical preparation is favourable due to the difficulties arising from FIB preparation, which were described above. In this case, the TEM samples need to be ground and polished only from the backside in order not to modify or even remove the irradiated layer.
Conventional mechanical testing cannot be used to characterize defects produced by ion-irradiation. Although several variants of micro-mechanical and nano-mechanical testing are available, comparability of the obtained results to values from conventional methods is limited due to the size effect. Usually, nanoindentation is applied to characterize irradiation-induced hardening of the ≈1 µm irradiated layer [42,60,61].
1.2.3 Oxide dispersion strengthened (ODS) steels Fabrication of ODS steels
Introducing and homogeneously distributing an insoluble, hardly wettable second phase with a much lower density into a steel matrix is far from trivial. Usually, ODS steels are produced applying a powder-metallurgy route as shown in Fig. 1.4 which consists of mechanical alloying (MA) with subsequent consolidation via hot isostatic pressing [62–64] or hot extrusion [17,64–66] and thermal/thermo-mechanical treatments.
9
1 Introduction
Figure 1.4: General powder-metallurgy fabrication route for ODS steels Mechanical alloying (MA) The mechanical alloying technique was developed in the 1960s for the production of Ni-base superalloys [67]. The main goal of MA in ODS steel production is the uniform distribution of the ODS particles inside the steel matrix.
Moreover, a refinement of both, the oxide particles and matrix grains is desired. In practice, high energy ball mills are used. The most common types include shaker mills, planetary ball mills and attritor mills [23,68]. Generally, rotation of either the milling container, filled with metal and oxide powder plus milling balls, or the stirring rod in case of the attritor mill, causes ball-ball, ball-wall and/or ball-rod collisions.
Between the colliding components, the metal powder particles are deformed, fractured and cold-welded again. This sequence leads to a steady state after a characteristic milling time, which depends on the type and size of the mill, milling speed, the size and material of the milling balls, as well as on the powder size and composition of the milled material and the milling atmosphere and temperature. In this state, no further significant change in the powder particle size distribution can be observed with an increase of the milling time [69]. During milling, a large fresh surface area is created temporarily. In order to limit oxide contamination, inert (e.g. purified argon, helium) atmospheres are used [70]. A frequently discussed question on the field of mechanical alloying of ODS steels is how the final ODS particles evolve from the initially added Y2O3. It has been observed, that during mechanical alloying changes in the structure of Y2O3 take place. After milling for several hours, the intensities of the Y2O3 peaks in powder X-ray and neutron diffraction (XRD, ND) patterns decrease and finally disappear [11, 71–75]. After consolidation or heat treatment of the milled powders, Y2O3 or, if the matrix contains Ti or Al, a Y–(Ti/Al) complex oxide reappears [62,76].
Similar phenomena have been observed for different secondary phases such as YFe3
and Fe2O3 [74]. Various possible reasons have been discussed for the disappearance of Y2O3 peaks. Ukai et al. suggested that Y and O are dissociated in the iron matrix [24, 72], which seems unlikely because the change in the lattice parameter of the matrix would cause a shift in the XRD Fe peak, which was not observed [11]. A similar approach of Kimura implies that Y and O may be dissolved in an amorphous grain boundary phase [73]. Both theories were disproved by Dai et al. who showed in XPS investigations that the Y-O bonds are still intact after 100 h of milling [71].
An alternative theory is based on the idea that severe fragmentation of the initial
1 Introduction
Y2O3 particles into X-ray amorphous/nanocrystalline sub-particles takes place [71], which has been confirmed qualitatively by Liu et al. [77] and Parida et al. [78]. In a study accompanying this work, ODS powders with high Y2O3 content and pure Y2O3
powder were milled and analysed by means of XRD. Quantitative data to confirm the refinement and partial amorphization of Y2O3 during milling is provided in a study which accompanied the sample fabrication state of the present work [79].
Consolidation and post-processing After MA the next challenge in ODS steel fabrication is the consolidation of the milled powder to dense material. Common techniques are hot extrusion (HE) or hot isostatic pressing (HIP), usually followed by heat treatment and/or thermo-mechanical treatment, such as hot rolling or hot cross- rolling. Also, spark plasma sintering (SPS) was shown to be a suitable technique for the consolidation of ODS Fe-Cr alloys [64,75, 80–82]. The principle of SPS is similar to hot pressing with a crucial difference in heat generation. While conventionally, the material is heated from outside, here it is generated directly at the powder particle contacts. A pulsed DC current is directed through the powder, heating up the contacts due to the high resistance at the small contact area (Joule heating). The main advantage of SPS, as opposed to other techniques, is the the shorter necessary holding time compared to conventional techniques such as HIP. This permits the limitation of grain growth and the consolidation of nanostructured materials [83, 84].
Typical microstructures
The microstructure of an ODS alloy is strongly dependent on the applied fabrication route and state. As-milled powder [85], as well as extruded or hot rolled materials typically exhibit elongated grains and a textured microstructure [65, 86], while as- HIPed or SPSed material usually contains spherical grains without texture. Frequently, bimodal microstructures, containing grains in the range of few 10 µm and areas of grains in the sub-µm size range, are observed [64, 87–89]. One expample of a typical ODS microstructure is given in Figure 1.5. A material with a well-defined bimodal grain size distribution, consisting of nanograins and larger grains on the µm-scale, may be beneficial at low temperatures, because of its high strength caused by nanograins and the remaining dislocation-mediated plasticity in larger grains. At high temperatures the fine grain structure can be a drawback in terms of creep resistance, so the bimodal grain size distribution may be the basis for a compromise between a creep resistant coarse microstructure and radiation resistant fine-grained material with high strength and fracture toughness at lower temperatures [90–92]. Possible reasons for the generation of bimodal grain size distributions were discussed in an accompanying study and can be found in [87]. However, the fractions of the finer- and coarser grained regions that give rise to the best compromise still have to be found.
As a result of the particle evolution during the fabrication process mentioned in section 1.2.3, Y-Ti complex oxides are frequently observed in titanium-containing alloys. These particles include Y2Ti2O7, which was verified by means of TEM and
11
1 Introduction
Figure 1.5: EBSD map showing the microstructure of a typical ODS steel produced by means of mechanical alloying and spark plasma sintering [64].
XRD [25, 90, 93–96], and Y2TiO5 [97], but also residual Y2O3 and TiO2 [98] were found. Moreover, particles with non-stoichiometric structures were found by Hirata et al. [99] and Marquis et al. [100]. The structure proposed by Posselt et al. containes Y and Ti atoms on bcc Fe lattice sites with O atoms on octahedral sites [101]. The comparison of the simulated structures with experimental data showed the assumption that the nanoclusters are non-stoichiometric and coherent with the matrix to be reasonable.
Multiscale characterization
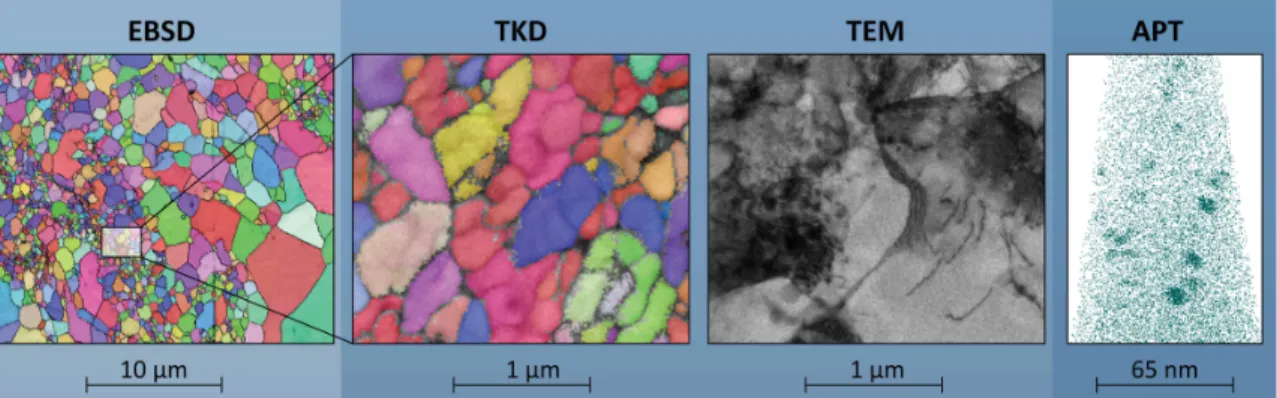
The size of typical ODS microstructure features, as described in section 1.2.3 ranges between several 10µm (matrix grains) and few nm (ODS particles). Covering this size range and displaying all details in a representative sample volume is impossible with the use of only one characterization technique. A possible solution is the combination of complementary techniques, which provide different kinds of information and cover different length scales. That way, a comprehensive description of the microstructure can be achieved.
The grain size distribution can be estimated with a combination of electron scattering methods. Electron backscatter diffraction in SEM (SEM-EBSD) is an established technique to estimate the size of grains, their volume fraction, orientation and shape [9, 64, 87, 102]. The spatial resolution limit of SEM, however, poses a problem for the analysis of nanograins present in some ODS steels. For the quantitative
1 Introduction
evaluation of the grain size in nanostructured materials, a related technique with higher spatial resolution, called transmission Kikuchi diffraction (SEM-TKD) was developed. A similar technique called automated crystal orientation mapping (TEM- ACOM) is available for TEM [64,88,89]. Both, SEM-TKD and TEM-ACOM, work in transmission mode and require electron-transparent samples. They provide orientation and crystal structure information with the main advantage of SEM-TKD being that no TEM device is required. Detailed information on the high-resolution techniques is provided in [103–106].
With respect to the ODS particles, information on their size distribution, spatial distribution and location relative to grain boundaries, as well as their composition and structure are relevant. The particle size distribution in a macroscopic volume (in the range of tens of mm3) can be estimated by means of small angle neutron scattering (SANS). Also, indications regarding the chemical and structural nature can be derived. However, SANS only provides global information, without referring to single particles. Direct imaging of small sample volumes is done by means of TEM.
The additional application of high resolution (HR) TEM and electron energy loss spectrometry (EELS) [107, 108] allows conclusions on the structure and chemical composition of single particles to be drawn. Atomic resolution is achieved by atom probe tomography (APT), where single ions are extracted from a sharp tip of the material, accelerated towards a detector and identified due to their time of flight.
After the reconstruction of their original position, a 3D model is generated. That way, insight into the three-dimensional alignment of the ODS particles, also including their shape and chemical composition, is given. Detailed information on the technique is given in [109,110].
Figure 1.6: Length scales of complementary imaging techniques applied for mi- crostructure analysis of ODS steels.
Figure 1.6 displays examples of the imaging techniques described above, while in Figure 1.7 the combination of the applied complementary characterization techniques is shown to cover a wide range of feature sizes and probed volumes.
13
1 Introduction
Figure 1.7: Scheme of approximate spatial resolution (here referred to as s) and detected sample volume V of the applied characterization techniques.
Irradiation behaviour of ODS steels
The general approach towards the fabrication of irradiation resistant materials is based on the fact that radiation damage itself is not avoidable. However, certain microstructures enhance the self-healing capacity of the material due to a high density of sinks for irradiation-induced primary defects [32].
With respect to a high sink density, ODS steels are promising candidates. The strength- ening particles inhibit grain growth, which results in a fine-grained microstructure with ultrafine grains as described in section 1.2.3. The higher specific grain boundary area was shown to be beneficial in terms of radiation tolerance [31, 111,112], as grain boundaries are assumed to act as sinks for irradiation-induced primary defects. Also, helium was shown to be trapped at grain boundaries, which points out the importance of a material’s grain size with respect to its irradiation behaviour [113, 114].
The interface between the strengthening particles and the matrix is another candidate as sink/trap for radiation-induced primary defects and helium. Studies by Zhang et al. and Fu et al. indicate these interfaces to act as traps for helium. They performed
1 Introduction
irradiation experiments on Cu/Nb and Cu/V multi-layers in order to simulate the effect of interfaces on the irradiation behaviour. The formation of helium bubbles, swelling and irradiation-induced hardening was less pronounced with a reduced layer thickness, which corresponds to a higher density of interfaces [115, 116]. A similar study of Kaspar et al. demonstrated the preferential nucleation of He bubbles at Fe/Y2O3 interfaces in a multilayer system [46]. Ryazonov et al. found that after He implantation into a 9Cr RAFM steel at different irradiation temperatures, at least 67%
of the observed He bubbles were attached to particles [47], which is a clear indication for the particle-matrix interface to act as a nucleation site for such bubbles.
Yang et al. calculated the formation energy of vacancies at the particle-matrix interface between Y2Ti2O7 and bcc Fe to be significantly lower than in the matrix [117]. However, there is a lack of experimental data concerning the particle-matrix interface acting as sink for radiation-induced primary defects.
In summary, several studies indicate elevated tolerance of ODS steels to irradiation- induced damage [46, 47, 115, 116]. In other cases, no effect of the oxide dispersion strengthening on the irradiation behaviour was observed [12, 26]. Also, the necessary conditions and the mechanisms leading to higher radiation tolerance are still under debate [26, 118, 119].
1.3 Motivation and Scope
Understanding the mechanisms leading to elevated radiation resistance in ODS steels plays a key role for the development of novel structure materials for future nuclear applications. In present studies there are contradictory findings concerning the irradiation behaviour of ODS steels.
Grain boundaries and the strengthening particles were both found to affect the radiation resistance to a certain extent under different conditions. However, there is still a lack of experimental data concerning the separate effects of the grain size and the particles. In order to evaluate and understand these effects, both microstructure features have to be studied separately.
The aim of this work is to experimentally separate the effect of grain size and strengthening oxide particles on the radiation resistance of an ODS steel. Moreover, the role of helium is investigated concerning the interaction with the microstructure features mentioned above.
The experimental approach of this work is to produce a set of ODS Fe-14Cr based alloys and non-ODS references by means of mechanical alloying and subsequent spark plasma sintering. A systematic variation of the Y2O3 content, the applied milling conditions and partial application of high temperature heat treatment is applied in order to obtain materials with significant differences in the microstructure. This concerns the grain size of the matrix, as well as the ODS particle number density. The aim of this first step is to select samples with different specific grain boundary area and particle-matrix interface area afterwards.
15
1 Introduction
For that purpose, the microstructure and nanostructure of the produced samples is carefully investigated with respect to:
• the grain size of the matrix by means of EBSD,
• the size distribution of ODS particles applying SANS,
• the spatial distribution of particles using APT and
• the particle structure and chemical composition by combining findings from APT and SANS in order to evaluate the particle-matrix interface.
With the conclusions drawn from material characterization, the selected samples are irradiated with Fe and Fe + He ions in order to evaluate the role of helium separately from the pure displacement damage.
Nanoindentation is applied to estimate irradiation hardening, which allows conclu- sions about the radiation resistance of the different materials and the favourable microstructure to be drawn.
2 Experimental work
2.1 Material production
2.1.1 Powder production
A pre-alloyed ferritic steel powder with the composition given in Table2.1was produced by Nanoval GmbH & Co. KG by means of gas-atomization. Its size distribution provided by Nanoval is given in Figure 2.2. The steel powder was mechanically alloyed under addition of different amounts of Y2O3 powder provided by Plasma
& Ceramic Technologies Ltd., Latvia (PCT) with an approximate particle size of 30 nm. Micrographs of both raw powders are given in Fig. 2.1. Mechanical alloying was carried out in a Fritsch Pulverisette P5 planetary ball mill under purified argon atmosphere using steel containers and balls (diameter 10 cm) with a ball-to-powder weight ratio of 10:1. Milling parameters were varied between 20 h at 150 rpm and 50 h at 250 rpm.
Figure 2.1: SEM micrographs of the pre-alloyed steel powder provided by Nanoval with sherical particles and the used Y2O3 powder which consists of large agglomerations of flake-like particles.
Table 2.1: Composition of the pre-alloyed steel powder provided by Nanoval. All values are given in wt.%.
Fe Cr W Ti Mn Si Ni
bal. 14.10 0.99 0.32 0.34 0.18 0.17 The composition and milling conditions are summarized in Table 2.2.
2 Experimental work
Figure 2.2: Sum curve and density distribution of the used Fe-14Cr-1W-0.4Ti-0.3Mn- 0.3Si-0.15Ni powder provided by Nanoval.
Table 2.2: Y2O3 content and milling conditions of the mechanically alloyed powders Sample Y2O3 [wt.%] time [h] speed [rpm]
A 0.0 30 250
B 0.0 50 250
C 0.3 20 150
D 0.6 20 150
E 0.6 30 250
F 0.6 50 250
2.1.2 Consolidation and heat treatment
The consolidation of cylinder samples with a diameter of 30 mm and a height of approximately 7 mm was done under vacuum using an FCT-HP D 250/1 spark plasma sintering device from FCT Systeme GmbH. Sintering conditions were the same for all samples with a dwell time of 10 min at a temperature of 1050◦C and a maximum pressure of 70 MPa applied. A schematic consolidation curve is given in Figure 2.3.
Relative densities beyond 98% were achieved for all samples with density values obtained using the Archimedes method. Prior to ion-irradiation, samples B-F were annealed for 1 h at 900◦C. Sample A was annealed at 1350◦C for 7.5 h in order to
2 Experimental work
Figure 2.3: Schematic development of temperature (T), pressure (p) and die dis- placement (s) during consolidation by means of SPS.
obtain a coarse-grained microstructure as opposed to the fine-grained microstructure expected for non-ODS sample B.
2.2 Sample preparation
From the SPS samples, 10 mm x 10 mm x 1 mm plates were cut using wire-cut EDM.
For small-angle neutron scattering, plates in the as-sintered state were ground to remove the oxide layer from cutting. As the technique is not sensitive to surface roughness, no polishing was necessary. For ion-irradiation and EBSD measurements, plates from the heat-treated samples were ground and polished with an oxide polish.
Atom probe tomography measurements require needle-like samples with a sharp tip.
Samples with dimensions of 0.5 mm x 0.5 mm x 10 mm were cut by means of wire-cut EDM and tips were formed using electro-polishing. A detailed describtion of the sample preparation for APT can be found in [109, 120]. For transmission electron microscopy (TEM), discs of 3 mm in diameter and a thickness of approximately 0.1 mm were electrochemically thinned using a TENUPOL device from Struers, in order to generate a small hole with an electron-transparent edge.
2.3 Ion-irradiation
All ion irradiations with Fe and He ions (single-beam as well as dual-beam) were performed in the dual implantation chamber (DIC) at the Ion Beam Center (IBC) at HZDR, Dresden, Germany. The DIC allows simultaneous implantation to be performed using two ion beams originating from a 500 kV implanter (He) and a 3 MV Tandetron accelerator (Fe) with an angle of incidence of 22.5◦ (see Fig. 2.4).
19
2 Experimental work
The ion beams were synchronized and scanned over the area of the samples during the irradiation, in order to guarantee a homogeneous exposure over the whole set of samples. All irradiations were carried out at room temperature (RT).
Figure 2.4: Principle of the simultaneous irradiation with Fe and He ions at the IBC.
The ion irradiation experiment was designed using the SRIM code (SRIM-2008.04) [121] with the exposure profile in terms of dpa being calculated based on Kinchine- Pease [122] and using the quick calculation mode of SRIM with the lattice binding energy and the surface binding energy set to zero, as suggested by Stoller [123]. The displacement energy was set to ED = 40 eV for a pure Fe-target according to ASTM- Standard E512 [124]. The contribution of Helium to the total exposure is less than 0.01 dpa.
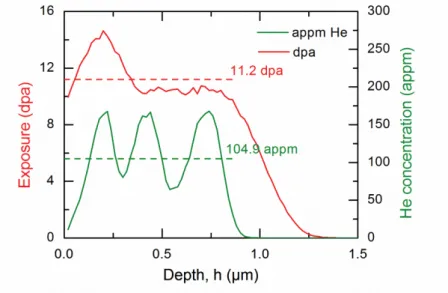
Three-step irradiations with different ion energies were applied to obtain a roughly rectangular exposure (in terms of dpa) and He concentration profiles, assuming that this will produce a nearly homogeneous irradiated layer. The energies of Fe and He ions were chosen such that the maximum of the exposure profile of the Fe ions and the maximum of the implantation profile of the He ions coincide to ensure simultaneous implantation. The individual ion energies applied were 750 keV, 1.5 MeV and 3 MeV for Fe ions and 50 keV, 150 keV, 350 keV for He ions, respectively. This results in an irradiated layer of about 1 µm depth. The ion irradiations were performed in steps from lowest to highest ion energy. The ion irradiation parameters are given in Table 2.3. They generate the exposure profile (in terms of dpa) shown in Figure2.5.
2 Experimental work
Table 2.3: Irradiation parameters applied for single-beam (SB) and dual-beam (DB) ion irradiation.
Step Ion Energy (keV) Fluence [1/cm2] T [°C] Incidence angle [°]
SB 1.1 Fe 3000 9.6 · 1015 20 22.5
SB 1.2 Fe 1500 2.7 · 1015 20 22.5
SB 1.3 Fe 750 5 · 1015 20 22.5
DB 2.1 He 350 3.4 · 1014 20 22.5
DB 2.1 Fe 3000 9.6 · 1015 20 22.5
DB 2.2 He 150 2.7 · 1014 20 22.5
DB 2.2 Fe 1500 2.7 · 1015 20 22.5
DB 2.3 He 50 2.0 · 1014 20 22.5
DB 2.3 Fe 750 5.0 · 1015 20 22.5
Figure 2.5: Exposure (dpa) profile and He-concentration according to SRIM calcula- tion.
21
2 Experimental work
2.4 Microstructure characterization
2.4.1 Matrix characterization
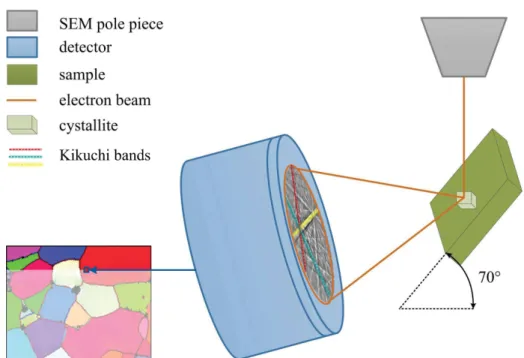
Figure 2.6: Set-up and principle of data acquisition for EBSD measurement in a polycrystalline material.
Electron backscatter diffraction (EBSD) is a common SEM based technique used for the characterization of grain size, as well as for misorientation and texture analyses.
The principle is shown in Figure 2.6. An electron beam is directed to the surface of a tilted sample. The diffracted electrons form a pattern characteristic of the crystal structure and orientation of the analysed spot which is recorded by a CCD camera. The software compares the detected Kikuchi bands to all possible orientation combinations with the pre-set phases and reports the best fit, respectively. The orientation information from one measuring point results in one color-coded pixel in the inverse pole-figure map which is usually used for the evaluation of grain size and orientation. The characterization of the grain size was done by means of electron backscatter diffraction (EBSD) on a Zeiss Ultra 55 Plus SEM equipped with a System Channel 5 EBSD system by Oxford instruments with a Nordlys F detector. The measurements were carried out at 20 kV using a 120µm aperture at a working distance of 15 mm and a sample tilt of 70° (see Fig. 2.6). In order to get reliable statistics (minimum 500 grains) within an appropriate measuring time, the step size was chosen to be 0.3 µm with an acquisition time of 20 ms per point. That way, the larger grains could be detected. The mean grain size of ultrafine-grained areas was determined by seperately mapping at least two of these zones with a reduced step size of 30 nm, respectively. An example for this kind of area selection is given in Figure 2.7.
2 Experimental work
For post-processing the software Esprit from Bruker was used. A minimum misorienta- tion angle between neighbouring grains of 5° and a minimum grain size of 5 pixels per grain were set as a basis for automated post-processing. For the grain size distribution, the grains detected in the first measurements were evaluated with respect to their area fraction. The areas that could not be indexed were assumed to contain grains below the lower grain size limit. To make them visible in the grain size distribution, these areas were summarized as one grain size column with d < 0.75 µm and separately marked in the size distribution.
Figure 2.7: Example of area selection for EBSD measurements with different step sizes.
2.4.2 Particle characterization
Small angle neutron scattering (SANS)
In SANS experiments a collimated monochromatic neutron beam is directed to the sample surface. As the technique is not sensitive to surface roughness, no special sample preparation is necessary. Due to the matrix composition, the size and shape of scattering objects, as well as their chemical composition and structure, a characteristic scattering pattern is projected on the detector (see Fig. 2.8). It contains information from a macroscopic volume (several mm3). From the pattern, the scattering curve can be extracted according to equation 2.1 withþki being the incident andþks being the scattered neutron beam, the resulting scattering angle Θ and the neutron wave length λ.
Q=|Qþ|=|þks−þki|= 4πsinΘλ (2.1)
23
2 Experimental work
After calibration and correction of the detector efficiency, sample transmission and background, the macroscopic differential scattering cross sectiondΣ/dΩ (referred to as scattering cross section) can be estimated. Assuming homogeneous scattering particles in a homogeneous matrix, equation 2.2 applies.
dΣ/dΩ(Q) =s cR·(∆η)2·V(R)·P(Q, R)2·S(Q)dR (2.2) It contains the contributions from the size distribution (cR), information on chemical composition in the scattering contrast (∆η), volume and shape information of the particles (V(R)·P(Q, R)2), as well as the structure factor S(Q) which describes interference effects between different scattering objects and adds up to 1 for a diluted system.
In order to obtain information about the structure and composition of non-magnetic scattering objects in a magnetic matrix, a high magnetic field is applied during the SANS measurement. That way, the magnetic and nuclear scattering contribution can be separated.
The so-called A-ratio is a number that can be calculated according to equation 2.3.
As all factors but ∆η are constant for magnetic and nuclear scattering, it can be simplified to 2.4.
A= dΣ/dΩ(Q)dΣ/dΩ(Q)magnuc + 1 =
scR·(∆η)2mag·V(R)·P(Q,R)2·S(Q)dR
s cR·(∆η)2nuc·V(R)·P(Q,R)2·S(Q)dR + 1 (2.3)
A= (∆η)(∆η)2mag2
nuc + 1 (2.4)
The A-ratio contains information about the mean differential scattering length inside the matrix and particles. The latter, in turn, is governed by the composition and structure of the scattering objects. In fact, the experimentally obtained value of the A-ratio alone does not provide structure information. However, it can be compared to the A-ratio calculated for a known structure and composition. That way, potential particle types can be excluded or taken into account in further investigations.
The SANS measurements were carried out at the instrument D33 of ILL Grenoble, France. The twin multi-tube detector system was used in the monochromatic mode at a neutron wavelength of 0.6 nm. Two setups for the sample-detector distances, 1.2 m and 12 m for the front detector together with 2 m and 12.8 m for the rear detector, were applied to cover a wide Q-range of 0.05 nm−1 < Q < 3 nm−1. The collimation lengths of the incident neutron beam were 2.8 m and 12.8 m, respectively.
The samples with dimension 10 mm x 10 mm x 1 mm were placed in a magnetic field of 1.4 T in order to separate magnetic and nuclear scattering cross-sections. Absolute calibration was done by means of a direct beam measurement. The data reduction
2 Experimental work
Figure 2.8: Principle of Small angle neutron scattering: The scattering objects gen- erate a typical scattering pattern due to their size distribution, chemical composition and structure.
was performed using the software package GRASP [125].
For the analysis of the scattering curves, non-magnetic spherical particles, randomly distributed in the steel matrix were assumed with Fe being the only element that contributes to the magnetic scattering length density. The transformation from scattering curves into particle-size distributions was performed using a Monte Carlo algorithm developed by Wagner [52] based on a method proposed by Martelli et al.
[126]. Here, no assumption on the shape of the size distribution is necessary. By randomly varying the starting conditions of the fit, an estimate of the fit stability can be given. These ranges will be indicated in the plots in chapter 3.1.2as coloured bands.
Atom probe tomography (APT)
By means of atom probe tomography (APT), atomic-resolution 3D reconstructions of small sample volumes can be generated. A needle-like sample with a sharp tip is charged with a high DC voltage. Laser pulses directed to the needle tip cause controlled ionization and evaporation of the atoms, which are then directed to a position-sensitive area detector and a time-of-flight detector. From the collected data, their original position and type of atom can be reconstructed. For more detail on the technique and physical background, see [109,110,127].
The APT measurements were carried out using an IMAGO LEAP 3000X HR at the Materials Department of the University of Oxford in laser mode and applying a
25
2 Experimental work
Figure 2.9: Principle of APT: Atoms are extracted from the material by laser pulses.
Using data from the time-of-flight detector and area detector the original sample structure can be reconstructed with atomic resolution.
laser-pulse energy of 0.6 nJ. Reconstructions were made using the IVAS 3.0 software by Cameca. For the cluster analysis, the maximum separation method searching for Y, Ti, Ti-O and Y-O solute atoms was used to identify the clusters. A maximum separation distance Dmax of 0.9 nm and a minimum cluster size Nmin of 25 atoms (including Y, Ti and O) were applied. The values ofNmin and Dmax were determined by iterating their values and comparing the number of identified genuine clusters to the number of false clusters identified in randomized data sets. These iteration steps ensured that an insignificant number of clusters was identified from random atomic structures.
2.5 Investigation of the irradiation behaviour
Nanoindentation testing was performed using the Universal Nanomechanical Tester (UNAT, Advanced Surface Mechanics GmbH, now part of the Zwick-Roell Group) equipped with a Berkovich indenter. The calibration of the indenter area function and the instrument stiffness was based on measurements on two reference materials (fused silica, sapphire) with known elastic modulus. To obtain the indentation hardness as a function of depth from the loading curve, the Quasi Continuous Stiffness Measurement
2 Experimental work
(QCSM) method [128] was applied. QCSM follows the same approach as the more familiar CSM (Continuous Stiffness Measurement) method [129]. However, the voltage of the piezoelectric resonator is not continuously overlaid with a sinusoidal oscillation during loading, but only at discrete loading points. A maximum load of 50 mN was applied. The experimental set-up, characteristic parameters and complete load cycle are shown in Figure 2.10. The load cycle includes a holding segment of 60 s after partial unloading to 10% of the maximum load, which is used to determine the thermal drift velocity.
Figure 2.10: Set-up and load cycle of Nanoindentation measurements applied to ion-irradiated material.
Data processing included zero point correction and thermal drift correction. Zero point correction was done assuming Hertzian contact for the first several 10 nm of the loading curve. Thermal drift was accounted for by correcting the displacement as a function of time, assuming the drift velocity to be constant over the whole measurements. In all cases, the total drift during the indentation test was at least an order of magnitude smaller than the measured total indentation depth. An average load displacement curve along with the standard deviation of load and displacement was calculated from the single corrected curves of more than 10 indents. The standard deviations were used for the calculation of the statistic errors in the following data analysis which was done by means of a method developed by Doerner and Nix [130]
and improved and adapted to pyramidal indenters by Oliver and Pharr [131, 132].
More detail, in particular on data processing, is given in [133].
The indentation hardness Hi is calculated from the contact areaAc and the applied load F according to equation 2.5.
Hi =F/Ac (2.5)
27
2 Experimental work
In order to distinguish between irradiation-induced hardening in the coarse and ultrafine-grained areas, a regular pattern of indents was set. After indentation the indents were sorted with assistance of FSE imaging at the SEM according to the grain size region they were placed in. Indents which could not clearly be attributed to one grain size region were ignored in further evaluation. The approach is schematically shown in Figure 2.11.
Figure 2.11: Separation of indentation hardness for coarse and ultrafine-grained areas in an ODS material.
3 Experimental results
3.1 Microstructure
3.1.1 Matrix - Grain size distribution
The grain size of all produced samples was estimated by means of electron backscatter diffraction (EBSD). For the ODS samples, which contain ultrafine-grained (UFG) areas, those were analysed separately with a reduced step size (see section 2.4.1). The mean grain sized of the coarse (d > 0.75µm) and the ultrafine (d <0.75µm) grains are given in Table 3.1. The grain size distributions are given in Figures 3.1 and 3.2.
Figure 3.1: Grain size distributions obtained from EBSD of the analysed non-ODS samples.
Inverse pole figure (IPF) maps illustrate the orientation of the identified grains with Table 3.1: Mean grain size d of ultrafine and coarser grain fractions.
Sample dcoarse [µm] dU F G [µm]
A 6.79 -
B 1.38 -
C 1.47 0.32
D 1.15 0.32
E 1.22 0.18
F 1.51 0.19
3 Experimental results
Figure 3.2: Grain size distributions obtained from EBSD of the analysed ODS samples. The content of UFG was estimated under the assumption that the majority of unindexed points can be attributed to grains with a size below the minimum detectable grain size at a step size of 0.3 µm.
realation to the sample surface. For all samples, IPF maps are given in Figures 3.3 (non-ODS) and 3.4 (ODS).
The non-ODS reference samples exhibit significant differences in the grain size distri- bution. While the grain size in sample A varies between less than 1 and 27 µm, the distribution in B is much narrower with almost all detected grains smaller than 10µm.
As expected, the grains are not elongated and have no preferred orientation. In the IPF map of sample A (Fig. 3.3) there are unindexed areas, which are not taken into account as ultrafine grains (UFG), but rather originate from larger contaminations (oxides, carbides), which were removed during preparation. In sample B there are
small unindexed zones in fine-grained regions, which could be attributed to UFG.
The microstructures of samples C and D (see Fig. 3.4), both produced with a milling time of 20 h at 150 rpm, appear similar with a slightly lower size of the coarse
![Figure 1.5: EBSD map showing the microstructure of a typical ODS steel produced by means of mechanical alloying and spark plasma sintering [64].](https://thumb-eu.123doks.com/thumbv2/1library_info/4564512.1599787/23.892.209.733.154.514/figure-showing-microstructure-typical-produced-mechanical-alloying-sintering.webp)

![Table 2.2: Y 2 O 3 content and milling conditions of the mechanically alloyed powders Sample Y 2 O 3 [wt.%] time [h] speed [rpm]](https://thumb-eu.123doks.com/thumbv2/1library_info/4564512.1599787/29.892.286.659.665.834/table-content-milling-conditions-mechanically-alloyed-powders-sample.webp)