Biological effects 26 years after simulated deep-sea mining
Erik Simon-Lledó1,2,*, Brian J. Bett1, Veerle A.I. Huvenne1 , Kevin Köser, Timm Schoening3, Jens Greinert3-4, Daniel O.B. Jones 1
1National Oceanography Centre, Empress Dock, Southampton SO14 3ZH, UK
2Ocean and Earth Science, University of Southampton, Southampton SO14 3ZH, UK
3GEOMAR Helmholtz Centre for Ocean Research Kiel, D-24148 Kiel, Germany
4Christian-Albrechts University Kiel, Institute of Geosciences; D-24098 Kiel, Germany
* Correspondence: erimon@noc.ac.uk
Supplementary material
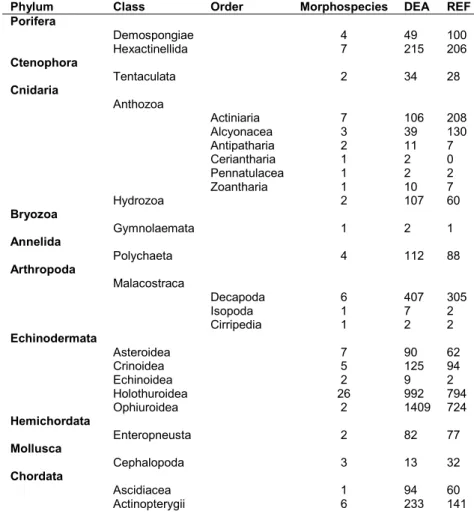
Table S1. Total abundance and taxon richness of major taxa encountered during the present study. DEA, DISCOL experimental area photo-mosaic, survey area 5.86 ha. REF, southern reference area photo-mosaic, survey area 5.25 ha.
Phylum Class Order Morphospecies DEA REF
Porifera
Demospongiae 4 49 100
Hexactinellida 7 215 206
Ctenophora
Tentaculata 2 34 28
Cnidaria
Anthozoa
Actiniaria 7 106 208
Alcyonacea 3 39 130
Antipatharia 2 11 7
Ceriantharia 1 2 0
Pennatulacea 1 2 2
Zoantharia 1 10 7
Hydrozoa 2 107 60
Bryozoa
Gymnolaemata 1 2 1
Annelida
Polychaeta 4 112 88
Arthropoda
Malacostraca
Decapoda 6 407 305
Isopoda 1 7 2
Cirripedia 1 2 2
Echinodermata
Asteroidea 7 90 62
Crinoidea 5 125 94
Echinoidea 2 9 2
Holothuroidea 26 992 794
Ophiuroidea 2 1409 724
Hemichordata
Enteropneusta 2 82 77
Mollusca
Cephalopoda 3 13 32
Chordata
Ascidiacea 1 94 60
Actinopterygii 6 233 141
Supplementary analysis
Effect of sampling unit size on the interpretation of diversity metrics
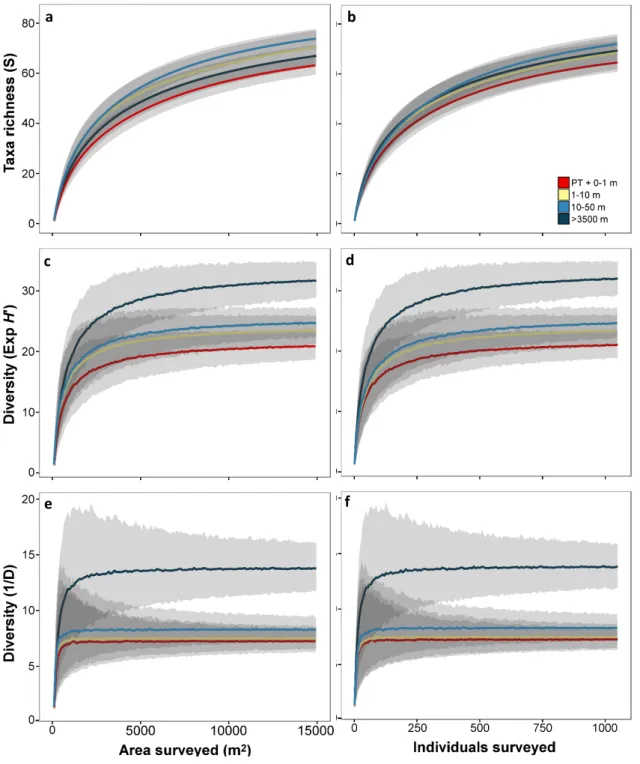
We applied a rarefaction approach to assess the potential impact of sampling unit size on the interpretation of calculated values of taxon richness, the exponential Shannon index (exp[H']), and the inverse Simpson’s index (1/D)
1. Sampling unit size was quantified as both number of individuals and seabed area observed. Faunal data (in raster cells: 0.5 m resolution; see main text) was collated for each disturbance level and randomly resampled 1000 times, with (Exp[H’], 1/D) or without (taxon richness) replacement, to form increasingly larger sampling units. The mean and 95% confidence intervals of each parameter were calculated at each sampling unit size. Taxon richness assessment was implemented using Estimate S v.9.1 software 2, while exp[H´] and 1/D were computed using a custom in R accessing the ‘vegan’ package.
Taxon richness curves showed no significant variations between disturbance levels in sample sizes up to 1000 individuals (Fig. S1a). Shannon diversity in REF (level-D) was clearly elevated above all three DEA areas at samples sizes over c. 550 individuals (Fig. S1d). Similarly, Simpson’s index in REF (level-D) was clearly elevated above all three DEA areas at samples sizes over c. 350 individuals (Fig. S1f).
Reference
1 Chao, A. et al. Rarefaction and extrapolation with Hill numbers: a framework for sampling and estimation in species diversity studies. Ecological Monographs 84, 45-67, doi:doi:10.1890/13-0133.1 (2014).
2 Colwell, R. EstimateS: Statistical estimation of species richness and shared species from samples. Version 9.
User's Guide and Application published at: http://purloclcorg/estimates (2013).
Figure S1. Variation in faunal diversity as a function of sampling unit size for each disturbance level assessed. Lines represent mean value of 1000 randomisations, shaded area represents corresponding 95% confidence interval. a-b:
Rarefied morphospecies accumulation curves. c-d: Variation in Exp (H’) diversity. e-f: Variation in 1/D diversity.
a b
c d
e f