NIST RM 8301 Boron Isotopes in Marine Carbonate (Simulated Coral and Foraminifera Solutions): Inter-laboratory δ
11B and Trace Element Ratio Value Assignment
Joseph A. Stewart
(1, 2)* , Steven J. Christopher
(1), John R. Kucklick
(1), Louise Bordier
(3), Thomas B. Chalk
(4), Arnaud Dapoigny
(3), Eric Douville
(3), Gavin L. Foster
(4),
William R. Gray
(5, 3), Rosanna Greenop
(5), Marcus Gutjahr
(6), Freya Hemsing
(7), Michael J. Henehan
(8, 9), Philip Holdship
(7), Yu-Te Hsieh
(7), Ana Kolevica
(6), Yen-Po Lin
(10), Elaine M. Mawbey
(2), James W. B. Rae
(5), Laura F. Robinson
(2), Rachael Shuttleworth
(4), Chen-Feng You
(10), Shuang Zhang
(8)and Russell D. Day
(1, 11)(1) National Institute of Standards and Technology, 331 Fort Johnson Rd, Charleston, SC, 29412, USA (2) School of Earth Sciences, University of Bristol, Bristol BS8 1RJ, UK
(3) Laboratoire des Sciences Du Climat et de L’Environnement (LSCE/IPSL), CEA-CNRS-UVSQ, Universit´e Paris-Saclay, Gif-sur-Yvette 91198uatonquati, France
(4) School of Ocean and Earth Science, University of Southampton, National Oceanography Centre, Southampton SO14 3ZH, UK (5) School of Earth and Environmental Sciences, University of St Andrews, St Andrews KY16 9AL, UK
(6) GEOMAR Helmholtz Centre for Ocean Research Kiel, Wischhofstrasse 1-3, Kiel 24148, Germany (7) Department of Earth Sciences, Oxford University, Oxford OX1 3AN, UK
(8) Department of Geology and Geophysics, Yale University, PO Box 208109, New Haven, CT, 06520-8109, USA (9) Section 3.3, Deutsches GeoForschungsZentrum GFZ, Potsdam 14473, Germany
(10) Department of Earth Science, National Cheng Kung University, No. 1, University Road, Tainan City 701, Taiwan (11) Marine Science and Nautical Training Academy (MANTA), Charleston, SC, 29412, USA
* Corresponding author. e-mail: joseph.stewart@bristol.ac.uk
The boron isotopic ratio of11B/10B (δ11BSRM951) and trace element composition of marine carbonates are key proxies for understanding carbon cycling (pH) and palaeoceanographic change. However, method validation and comparability of results between laboratories requires carbonate reference materials. Here, we report results of an inter-laboratory comparison study to both assignδ11BSRM951and trace element compositions to new synthetic marine carbonate reference materials (RMs), NIST RM 8301 (Coral) and NIST RM 8301 (Foram) and to assess the variance of data among laboratories. Non-certified reference values and expanded 95% uncertainties forδ11BSRM951in NIST RM 8301 (Coral) (+24.17‰0.18‰) and NIST RM 8301 (Foram) (+14.51‰0.17‰) solutions were assigned by consensus approach using inter-laboratory data. Differences reported among laboratories were considerably smaller than some previous inter-laboratory comparisons, yet discrepancies could still lead to large differences in calculated seawater pH.
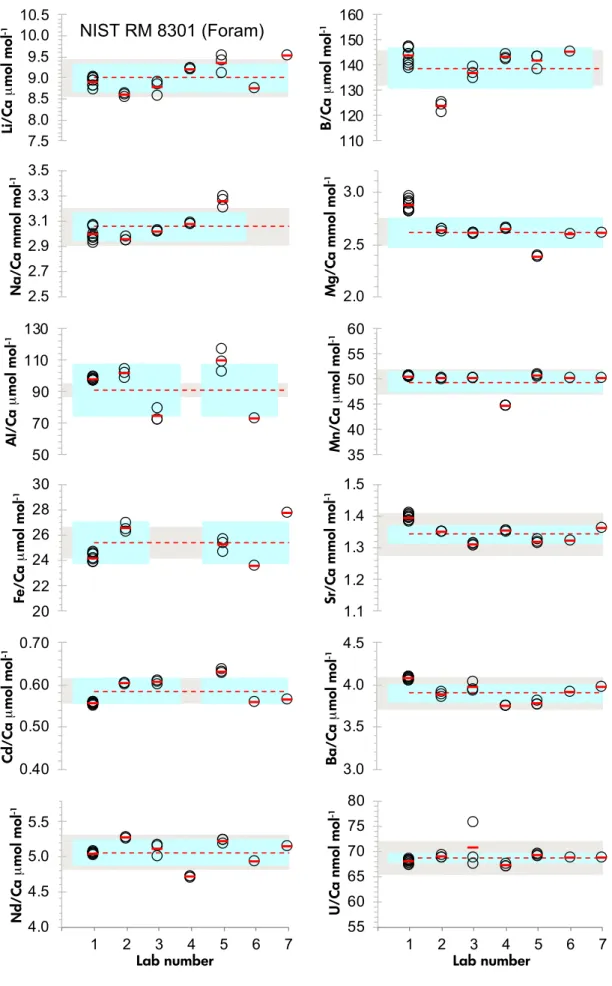
Similarly, variability in reported trace element information among laboratories (e.g., Mg/Ca5% RSD) was often greater than within a single laboratory (e.g., Mg/Ca<2%). Such differences potentially alter proxy-reconstructed seawater temperature by more than 2°C. These now well-characterised solutions are useful reference materials to help the palaeoceanographic community build a comprehensive view of past ocean changes.
Keywords: boron isotopes, trace elements, reference materials, coral, foraminifera.
Received 09 Jun 20–Accepted 22 Sep 20
Anthropogenic carbon emissions since the industrial revolution have impacted both Earth’s radiative balance and seawater carbonate chemistry, resulting in surface warming
and ocean acidification (Doney et al. 2009, Stockeret al.
2013). The scientific community requires details of (a) spatial/
temporal changes in ocean pH and temperature, and (b) Vol. 45 — N° 1 0 32 1 P . 7 7–9 6
doi: 10.1111/ggr.12363
levels of atmospheric carbon dioxide (CO2) during intervals of climate change in the geological past, to better under- stand and anticipate potential future changes to the ocean/
atmosphere system and the impacts on marine bio-carbon- ate organisms. To this end, attention has been focused on the development of ocean pH proxies, with the differences in boron isotopic composition (expressed as δ11BSRM951, relative to National Institute of Standards and Technology (NIST) Standard Reference Material (SRM) 951 Boric Acid, in parts per thousand; δ11B=(R(11B/10B)Sample/R (11B/10B)SRM951-1)) of modern and fossilised marine calcifying organisms (e.g., coral and foraminifera) showing particular promise (Hemming and Hanson 1992).
In addition to boron, the trace element composition of marine carbonates is vital to understanding past ocean characteristics and composition (e.g., Algeo and Rowe 2012). For this reason, palaeoceanographers routinely measure carbonate molar ratios of Mg/Ca (sometimes also paired with Li/Ca) and Sr/Ca as proxies for temperature (Becket al. 1992, Anand and Elderfield 2003, Caseet al.
2010); Al/Ca, Mn/Ca, Fe/Ca, and Ba/Ca to assess seawater metal content (Lea and Boyle 1989, Guzman and Jim´´ enez 1992) and sample diagenesis/contamination (Barker and Greaves 2003); Cd/Ca to estimate nutrient content (Rickaby and Elderfield 1999); and U/Ca to assess carbonate ion saturation states and calcification rates (Russellet al. 2004, DeCarloet al. 2015). In this way, trace element proxy data can provide a holistic view of past and present ocean–cli- mate interactions.
Before palaeoceanographic interpretation can be made from any δ11BSRM951 or trace element dataset, rigorous assessment of uncertainty is required. Initial inter- laboratory comparison exercises measuring boron isostopes in natural materials revealed large discrepancies in results across laboratories (>>1‰; Gonfiantini et al. 2003, Aggarwal et al. 2009). Despite much analytical improve- ment since then, recent inter-laboratory studies still report significant inter-laboratory disagreement for both boron isotope (Foster et al. 2013) and trace element (Hathorne et al. 2013) measurements. Hence, well-characterised boron isotopic reference materials in a carbonate matrix are urgently needed to assess the accuracy and precision of carbonate δ11BSRM951 measurements through the entire procedural treatment: from dissolution of carbonate, ionic separation of boron from the carbonate matrix, to the final δ11BSRM951 measurement. To date, only two authentic carbonate boron isotope reference materials exist that have been value-assigned by the palaeoceanographic commu- nity: JCp-1 (Poritescoral) and JCt-1 (Giant Clam) (Okaiet al.
2002, Inoue et al. 2004, Hathorne et al. 2013) (see
companion inter-laboratory study by Gutjahret al. (2020 in press). While many carbonate geochemistry laboratories routinely use these materials in-house, recent changes to regulations by Convention on International Trade in Endan- gered Species of Wild Fauna and Flora (CITES) now restrict the distribution of both biogenic carbonates due to their animal origins. NIST has therefore supplemented these with NIST RM 8301 Boron Isotopes in Marine Carbonate (Simulated Coral and Foraminifera Solutions), hereafter abbreviated as NIST RM 8301, providing new solution- based inorganic carbonate boron reference materials synthetically produced to imitate typical coral (NIST RM 8301 (Coral)) and foraminiferal (NIST RM 8301 (Foram)) δ11BSRM951and trace element contents (Li, B, Na, Mg, Al, V, Cr, Mn, Fe, Co, Ni, Cu, Zn, Rb, Sr, Mo, Ag, Cd, Sn, Sb, Cs, Ba, Nd, W, Pb, U). The solutions comprising NIST RM 8301 will not only ensure quality control of procedural chemistry post- dissolution across laboratories, but have the added benefits of having a high mass fraction of B to ensure stability during storage (NIST RM 8301 (Coral)≈7.1μg g-1 and RM 8301 (Foram)≈1.9μg g-1), free from any shipping restric- tions associated with shipment of protected species, and are in abundant supply (5000 bottles each) to ensure long-term continuity of measurements into the future. Here, we present δ11BSRM951 and trace element data from NIST and other leading boron isotope laboratories to assign values to NIST RM 8301 and evaluate analytical performance between these laboratories.
Methodology
NIST RM 8301 reference material production The production of NIST RM 8301 reference materials is summarised in Figure 1. Six kilograms of high-purity pow- dered calcium carbonate (ACS 337 calcium carbonate, chelometric material; GFS Chemicals, OH, USA; Lot # C474630) was dissolved in TraceMetal™Grade concen- trated nitric acid (Fisher Scientific, MA, USA) while cooled in a water bath. The dissolved solution was passed through Whatman®GF/F 0.7μm microfibre filters (142 mm diame- ter; 0.42 mm thickness; Cat # 1825-142) to remove small quantities (<3 g total mass) of residual solids (trace oxides, organics, and/or silicates) that formed during the dissolution process. After filtration, the solution was transferred into two acid-cleaned 20 L HDPE carboys: one for NIST RM 8301 (Coral), and one for NIST RM 8301 (Foram). The matching carbonate matrix of these two solutions means that they share a common RM identifier (8301). However, with their contrasting boron isotope and trace element composition (see below) we distinguish between the two levels of this RM as ‘Coral’ and ‘Foram’. The end user is not necessarily
expected to use both solutions in tandem as part of their quality control procedure; rather, they should choose the solution most appropriate to their sample type of interest.
Single-element trace element solutions were added in suitable quantities to each solution of the RM to reproduce the trace element to calcium ratios typical of a dissolved coral aragonite and foraminiferal calcite. The stock solution used for each element and the masses added to each RM solution are given in Table 1. Note that these values are given for reference to show the approximate element/Ca ratios in the solutions. Gravimetric concentrations are provided for documenting the production procedure, and the masses in Table 1 do not account for concomitant trace elements contained within the starting powdered carbonate and single-element standards, or for ions leached during dissolution and filtration. Inter-laboratory consensus informa- tion values for the trace element composition of the RMs are reported later in the manuscript.
The boron isotope spike customised and added to each trace element-doped dissolved carbonate RM solution was a mixture of NIST SRM 951a boric acid (δ11B=0‰;
11B/10B=4.0437) and a >99% enriched 11B spike (Trace Sciences) to give B/Ca and 11B/10B ratios typical of coral (B/Ca≈550μmol mol-1; δ11BSRM951≈25‰) and
foraminifera (B/Ca≈150μmol mol-1;δ11BSRM951≈15‰) (Table 1). NIST SRM 951a was dissolved in boron-free high- purity water while the more recalcitrant11B-enriched metal was microwave-digested in Optima™ concentrated nitric acid and hydrogen peroxide (Fisher Scientific) using quartz vessels in an Anton Parr Multiwave 3000 Microwave Reaction System. Following addition of this final boron isotope spike, the resultant solutions were diluted with boron-free water (resistivity: 18.2 MΩcm) to yield a total volume of 20.2 l in each carboy and final calcium concen- trations of approximately 50 mg ml-1and nitric acid content of approximately 3 mol l-1. Gravimetric calibration and measurement by inductively coupled plasma-mass spec- trometry (ICP-MS) revealed final calcium mass fractions of 49.7 and 51.3 mg g-1for NIST RM 8301 (Coral) and NIST RM 8301 (Foram), respectively (see Analytical techniques section). The boron isotope spike weights given in Table 1 are for reference to show the target boron mass fraction and
11B/10B ratio of the solutions. As above, gravimetric prepa- ration values are expected to differ from actual B/Ca and
11B/10B ratios in the RM solutions as small amounts of boron are added from the original carbonate and/or leached during dissolution. Each NIST RM 8301 solution was well mixed and aliquoted sequentially through preconditioned peristaltic pump tubing into 5000 acid cleaned 4 ml HDPE screw top vials for production. All vial cleaning and RM Figure 1. Production of NIST RM 8301 including (i) dissolution of carbonate powder in nitric acid, (ii) addition of trace elements, (iii) addition of boron isotope spike, (iv) dispensing into acid clean vials and (v) distribution to participants.
dispensing were carried out in the NIST Biorepository ISO Class 5 clean room at the NIST Charleston Laboratory.
Inter-laboratory comparison outline
For the NIST contribution to the inter-laboratory study, nine vials of each RM were selected for measurement of δ11BSRM951 and trace element composition. Additional participant laboratories include LSCE, GEOMAR, Yale and Universities of Southampton, St Andrews, and National Cheng Kung that were selected based on their active research on boron isotopes in marine carbonates. Each laboratory was assigned a laboratory number at random to protect data anonymity. Participants were sent three vials (selected by random number generator) of each simulant of NIST RM 8301 and asked to make at least three separate boron isotopic measurements of each vial, providing a relevant citation detailing their matrix separation and analytical protocol of choice. The high nitric acid content in NIST RM 8301 (approximately 3 mol l-1) makes these solutions unsuitable for negative thermal ionisation mass spectrometry (e.g., Honisch and Hemming 2004, B. H¨¨ onisch pers. comm.). All laboratories in this study therefore opted to employ multi-collector (MC)-ICP-MS analytical techniques.
Participants were asked to provide supplementary data for each vial for their typical carbonate trace element suite (element ratioed to calcium); however, these analyses were optional. In order for us to present a wide array of useful trace element ratios in these solutions, we did not ask laboratories to produce a detailed uncertainty budget beyond a combined estimation of analytical reproducibility and variability between the vials measured. For this reason, an expanded uncertainty is not provided for trace element values presented here. Consequently, they cannot be used to establish metrological traceability to the mol or kg, but are nonetheless useful guide values determined by inter-labo- ratory consensus. Trace element data were provided by NIST, LSCE, GEOMAR, Southampton and St. Andrews.
Additional trace element data were provided by the Universities of Bristol and Oxford; however, these two laboratories measured fewer individual vials. Laboratories providing trace element data were again assigned a random number to protect data anonymity. All laboratories used either quadrupole or sector-field ICP-MS instrumenta- tion to analyse the solutions, matrix-matching samples and calibration solutions with calcium mass fractions of between 25 and 100µg g-1. Note that the laboratory numbers used for boron isotopic comparison in Figure 2 do not correspond to the same laboratory number reporting elemental ratios in Figures 4 and 5.
Analytical techniques
Analytical techniques used by the participant laborato- ries are summarised in Tables 2 and 3. Details of the analytical approach used by NIST are given below.
Boron isotope measurements at NIST: Analyses at NIST followed protocols previously described in Foster (2008), Rae et al. (2011) and Foster et al. (2013). The exact volume of RM used varied between column batches, yet in all cases more than 100 ng of B was targeted for each analysis (typically 15 and 50μl of NIST RM 8301
δ
11B (‰) δ
11B (‰)
Lab number
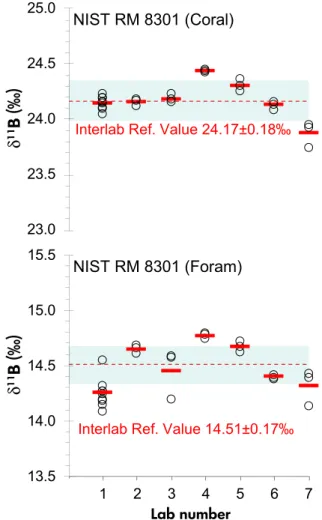
Figure 2. δ1 1BS RM9 51results for NIST RM 8301 (Coral) and NIST RM 8301 (Foram). NIST lab is number 1, other laboratories have been anonymised. Circles and thickdashes denote, respectively, mean values mea- sured for each vial and the mean value for that laboratory. The dashed line shows the inter-laboratory consensus reference value for δ1 1BS R M 9 5 1of all seven contributing laboratories. Shaded zones show the 95%
expanded uncertainty on consensus reference values.
(Coral) and NIST RM 8301 (Foram), respectively). Each aliquot from the individual RM 8301 vials was buffered in 2 mol kg-1sodium acetate to 0.5 mol kg-1acetic acid (20:1 buffer to sample ratio) before boron was separated from the carbonate matrix using 20μl micro-columns containing IRA 743 boron-specific anionic exchange resin (Kiss 1988). All boron must be recovered from columns to avoid isotopic fractionation; therefore, following elution of the boron fraction, an additional elution was checked to ensure
>99% of sample boron was recovered.
At NIST, the purified boron samples were diluted to a boron mass fraction of approximately 100 ng g-1 for analysis on a Nu Plasma II MC-ICP-MS concurrently with NIST SRM 951a Boric Acid Isotopic Standard at matrix- matched mass fractions of B and acid concentration (0.5 mol l-1 HNO3). An on-peak zero was acquired as a 60 s acid blank measurement before each sample.
Immediately after sample wash in, a peak centre was performed using the 11B mass before both boron isotopes were collected on H8 and L4 Faraday cups. Sample data were acquired as one block of sixty cycles each with an integration time of 2 s. Data acquisition was followed by a 2 min wash between samples to ensure minimal sample carry over (i.e., blank intensity<1% of sample). Note that all laboratories in this study used either SRM 951 or SRM 951a to correct for mass bias, using similar sample-standard bracketing techniques.
The precision ofδ11BSRM951results in the NIST labora- tory was assessed by repeat measurements of boric acid standard BAM ERM-AE121 (certified value, 19.9‰0.6‰; Vogl and Rosner 2012) during analytical runs. In addition, assessment of the full powdered sample processing methodology was performed using the carbon- ate reference material JCp-1 (robust mean including robust Table 1.
Mass of calcium carbonate, boron isotopic spike and single-element stock solutions added to each level of NIST RM 8301
Stock
source Stock
concentration Lot # Matrix (v/v) NIST RM 8301 (Coral) mass
added
NIST RM 8301 (Foram) mass added
CaCO3337 powder C474630 3029 g 3031 g
NIST SRM 951a Boric Acid Isotopic Standard powder 1.0 g 0.3 g
Trace Sciences11B powder (99% enriched) 3.8 mg 0.6 mg
Sr HP 10M53-1 10 mg ml-1 1414835 1% HNO3 2167 g 325.054 g
Na HP 10M52-1 10 mg ml-1 1505109 1% HNO3 1439 g 215.831 g
Mg HP 10M31-2 10 mg ml-1 1413333 10% HCl 304 g 191.627 g
Zn HP 10M68-1 10 mg ml-1 1326125 4% HNO3 8.0 g 1.978 g
Al HP 10M1-1 10 mg ml-1 1516016 10% HNO3 4.4 g 8.596 g
Cu HP 10M14-1 10 mg ml-1 1502217 4% HNO3 3.9 g 1.125 g
P NIST 3139a 10016μg g-1 60717 0.8% HNO3 3.7 g 2.757 g
Ba HP 10M4-1 10 mg ml-1 1406438 2% HNO3 2.1 g 1.205 g
Fe HP 10M26-1 10 mg ml-1 1508449 10% HNO3 1.7 g 3.536 g
Ni NIST 3136 10003μg g-1 120619 8% HNO3 1.2 g 1.033 g
U HP 10M64-1 10 mg ml-1 1435233 4% HNO3 0.6 g 0.023 g
Mn HP 10M32-1 10 mg ml-1 1413613 4% HNO3 0.3 g 8.575 g
Co NIST 3113 9996μg g-1 630 10% HNO3 0.2 g 0.094 g
W NIST 3163 9991μg g-1 80331 7% HNO3+4% HF 127 mg 73 mg
Sb NIST 3102a 10015μg g-1 61229 10% HNO3+2% HF 94 mg 44 mg
Li HP 10M29-1 10 mg ml-1 1428019 1% HNO3 90 mg 179 mg
Nd HP 10M35-1 10 mg ml-1 1412002 4% HNO3 65 mg 2259 mg
V NIST 3165 4860μg g-1 992706 10% HNO3 50 mg 37 mg
Pb HP 10M28-1 10 mg ml-1 1322626 4% HNO3 45 mg 34 mg
Cd HP 10M8-1 10 mg ml-1 1312905 4% HNO3 35 mg 176 mg
Cr NIST 3112a 9922μg g-1 30730 10% HNO3 33 mg 24 mg
Mo NIST 3134 9999μg g-1 130418 10% HCl 31 mg 23 mg
Rb NIST 3145a 10040μg g-1 891203 4% HNO3 27 mg 20 mg
Sn NIST 3161a 10010μg g-1 70330 5% HNO3+1% HF 19 mg 14 mg
Ag NIST 3151 10010μg g-1 992212 10% HNO3 3 mg 3 mg
Cs NIST 3111a 10006μg g-1 50614 1% HNO3 0.5 mg 0.3 mg
These guide values show the relative proportions of elements in each RM.
HP=high-purity standards, Inc. (all traceable to NIST SRM 3100 series).
standard deviation (2s*) of oxidatively cleaned JCp-1 from companion inter-laboratory study: 24.25‰0.22‰; Gut- jahr et al. 2020). Measurements for these additional reference materials at 100 ng g-1 B mass fraction during sample analysis were, respectively, 19.71‰0.07‰(2s;
n=39; no matrix separation) and 24.18‰0.39‰
(n=6; matrix removed by micro-columns). Similar results for BAM ERM-AE121 were also provided by five out of seven laboratories in this study that vary by 0.17‰(19.71, 19.60, 19.55, 19.75 and 19.60‰; Lab 1–5, respectively; 2s).
Six total procedural blank measurements were made at NIST alongside samples in this study (mean absolute blank of 116 pg of boron). These blanks are small relative to the
sample size (<0.09% of sample boron) resulting in minimal impact on δ11BSRM951results (i.e., <0.1‰); hence, a total procedural blank correction was not applied.
Elemental determination at NIST: Determinations were carried out on an Element XR sector-field ICP-MS and broadly followed the protocol of Marchitto (2006) to yield Li/Ca, B/Ca, Na/Ca, Mg/Ca, Al/Ca, Mn/Ca, Fe/Ca, Sr/
Ca, Cd/Ca, Ba/Ca, Nd/Ca and U/Ca ratios. Sample aliquots were diluted to an equal mass fraction of Ca (80µg g-1), and every three samples were bracketed by a matrix- matched, gravimetrically prepared, primary calibrant that was traceable to NIST 3100 series single-element solutions.
Measured intensities (counts per second) of each individual Table 2.
Boron isotope method summary for inter-laboratory study participants Participant Matrix
separation
Instrument Type Run
concentration [B] (ng g-1)
Source of traceability
Method reference
NIST Amberlite gravity columns
MC-ICP-MS Nu Plasma II 100 NIST SRM 951 Foster (2008)
GEOMAR Amberlite gravity columns
MC-ICP-MS Thermo Neptune Plus 36 NIST SRM 951 Foster (2008), Jurikovaet al.
(2019) LSCE Amberlite gravity
columns
MC-ICP-MS Thermo Neptune Plus 200 NIST SRM 951 Douvilleet al. (2010), Lazarethet al. (2016) Nat. Cheng Kung
Univ.
Microsublimation MC-ICP-MS Thermo Neptune 50 NIST SRM 951 Honisch and¨ Hemming (2005), Wanget al. (2010) Univ. of Southampton Amberlite gravity
columns
MC-ICP-MS Thermo Neptune 30–50 NIST SRM 951 Foster (2008) Univ. of St Andrews Amberlite gravity
columns
MC-ICP-MS Thermo Neptune Plus 18–30 NIST SRM 951 Foster (2008), Rae et al. (2018) Yale Amberlite gravity
columns
MC-ICP-MS Thermo Neptune Plus 35 NIST SRM 951 Foster (2008), Zhang et al. (2017) All laboratories used sample-calibrator bracketing to correct for instrument-induced mass bias. Order of laboratories listed here does not reflect randomly assigned laboratory number.
Table 3.
Trace element method summary for inter-laboratory study participants
Participant Instrument Type Run concentration
[Ca] (µg g-1)
Method reference
NIST ICP-MS Thermo Element 2 80 Marchitto (2006)
Univ. of Bristol ICP-MS Thermo Element XR 80 Marchitto (2006)
GEOMAR ICP-MS Agilent 7500cx Quad 25 Hathorneet al. (2013)
LSCE ICP-MS Xseries II Quad 100 Montagnaet al. (2014),
Hathorneet al. (2013)
Univ. of Oxford ICP-MS Perkin Elmer NexION 350D 60 Rosenthal and Field (1999),
Day and Henderson (2013)
Univ. of Southampton ICP-MS Thermo Element XR 80 Henehanet al. (2013)
Univ. of St Andrews ICP-MS Agilent 7500a Quad 40 Niet al. (2007)
Order of laboratories listed here does not reflect randomly assigned laboratory number.
Table 4.
Compiled boron isotope measurement results of NIST RM 8301 from all inter-laboratory study participants
NIST RM 8301 (Coral) Vial mean NIST RM 8301 (Foram) Vial mean
Vial δ11B (‰) δ1 1B (‰) Vial δ11B (‰) δ11B (‰)
2A2 24.09 24.15 2A2 14.28 14.18
24.20 14.00
24.17 14.26
3A2 23.87 24.09 3A2 14.41 14.17
24.29 14.44
24.14 14.11
24.05 13.72
3G14 23.95 24.13 3G14 14.47 14.31
24.36 14.17
24.09 14.29
4K11 23.97 24.10 4K11 13.76 14.07
24.12 14.27
24.23 14.18
5A2 24.11 24.18 5A2 14.30 14.23
24.20 14.12
24.24 14.27
15A2 24.09 24.05 15A2 14.67 14.54
23.76 14.60
24.28 14.35
16A2 24.29 24.23 16A2 14.21 14.26
24.15 14.21
24.24 14.36
17A2 24.30 24.19 17A2 14.60 14.25
24.36 14.41
23.90 13.76
17G15 23.94 24.15 17G15 14.07 14.14
24.29 14.71
24.22 13.63
NIST Lab 1 Mean (2s) 24.140.11 NIST Lab 1 Mean (2s) 14.240.27
14E16 24.31 24.17 14E16 14.60 14.59
24.00 14.61
24.14 14.57
24.22
1T3 24.26 24.18 1T3 14.63 14.67
24.03 14.71
24.25 14.68
6A3 24.12 24.12 6A3 14.61 14.64
24.13 14.78
24.11 14.53
Lab 2 Mean (2s) 24.160.06 Lab 2 Mean (2s) 14.640.08
6Q16 24.08 24.17 6Q16 14.14 14.18
24.25 14.34
24.19 14.07
14M7 24.15 24.15 14M7 14.59 14.57
24.05 14.47
24.27 14.64
17J13 24.26 24.22 17J13 14.49 14.56
24.16 14.65
24.24 14.54
Lab 3 Mean (2s) 24.180.07 Lab 3 Mean (2s) 14.440.44
4A17 24.44 24.44 4A17 14.73 14.77
24.44 14.80
24.44 14.80
6G14 24.36 24.43 6G14 14.74 14.73
24.46 14.73
24.46 14.72
11K5 24.51 24.42 11K5 14.78 14.76
24.42 14.79
24.34 14.72
sample were blank corrected using blank acids measure- ments before and after each sample. Typical precision (1s) for these element/calcium ratios is<4% based on repeat measurements (n=38) of an in-house matrix-matched gravimetric solution.
Reference value assignment for δ11BSRM951 and supplemental data
Reference values and expanded uncertainties for δ11BSRM951in NIST RM 8301 (Coral) and NIST RM 8301 (Foram) published in the final NIST Report of Investigation for NIST RM 8301 were determined from all inter-laboratory study data using the DerSimonian-Laird analysis method within the NIST Consensus Builder (Koepke et al. 2017).
Value assignment such as this, by consensus approach involving multiple participants, is not conducive to obtaining a fully comprehensive uncertainty budget (e.g., Vogl and Rosner 2012, Geilert et al. 2019). The DerSimonian-Laird method was therefore chosen to account for ‘dark
uncertainty’ (unaccounted sources of uncertainty among laboratories) as the reported data only included uncertain- ties related to replication. Because no comprehensive uncertainty budgets were reported, traceability to the SI cannot be established. For this reason, we do not advocate the use of NIST RM 8301 for calibration purposes (e.g., using as a bracketing calibrator) or establishing metrological traceability. Consensus element/calcium ratios published in the final NIST Report of Investigation for NIST RM 8301 as non-certified information values, are based on the overall means calculated from the mean values reported for each material from each participant laboratory.
Results and discussion
Boron
All boron isotope data for NIST RM 8301 collected by the seven contributing laboratories are shown in Table 4 and summarised in Table 5 and Figure 2. These data show Table 4 (continued).
Compiled boron isotope measurement results of NIST RM 8301 from all inter-laboratory study participants
NIST RM 8301 (Coral) Vial mean NIST RM 8301 (Foram) Vial mean
Vial δ11B (‰) δ1 1B (‰) Vial δ11B (‰) δ11B (‰)
Lab 4 Mean (2s) 24.430.02 Lab 4 Mean (2s) 14.760.05
1N12 24.40 24.25 1N12 14.59 14.65
24.24 14.60
24.10 14.77
4F10 24.45 24.36 4F10 14.75 14.71
24.29 14.68
24.34 14.70
7B3 24.34 24.29 7B3 14.64 14.61
24.33 14.53
24.21 14.67
Lab 5 Mean (2s) 24.300.12 Lab 5 Mean (2s) 14.660.10
12G5 24.19 24.13 12G5 14.39 14.38
24.05 14.35
24.16 14.39
11B8 24.07 24.08 11B8 14.33 14.37
24.06 14.36
24.12 14.43
7O8 24.16 24.15 7O8 14.34 14.40
24.12 14.38
24.18 14.49
Lab 6 Mean (2s) 24.120.07 Lab 6 Mean (2s) 14.380.03
1I4 23.71 23.74 1I4 14.34 14.41
23.83 14.52
23.67 14.39
9G8 24.04 23.92 9G8 14.33 14.12
23.72 13.89
24.01 14.16
17C12 23.78 23.94 17C12 14.27 14.38
24.09 14.23
23.95 14.63
Lab 7 Mean (2s) 23.870.23 Lab 7 Mean (2s) 14.300.32
the mean of threeδ11BSRM951values for individual vials of NIST RM 8301 (Coral) and NIST RM 8301 (Foram) that range from 23.74‰to 24.44‰and 14.07‰to 14.77‰, respectively. The range in mean δ11BSRM951 values for all vials reported by each laboratory is similar for both RMs: by 0.56‰ for NIST RM 8301 (Coral) (23.87–24.43‰), and 0.52‰for 8301 (Foram) (14.24–14.76‰). Inter-laboratory consensus-based NIST reference values were calculated as 24.17‰0.18‰ and 14.51‰0.17‰ for NIST RM 8301 (Coral) and NIST RM 8301 (Foram), respectively, using DerSimonian-Laird analysis and 95% expanded uncertainty. These values are extremely close to the mean of all laboratory mean values of 24.17‰0.35‰ and 14.490.39‰(2s). This suggests that the NIST laboratory, contributing results from more than three vials of each RM and with its poorer reproducibility of some vials (e.g., NIST RM 8301(Foram) vial 17G15>1‰; 2s), did not unduly influence the overall consensus value.
Expanded uncertainties estimated using this approach are small (<0.2‰) in comparison with the laboratory mean values (>0.3‰; 2s). DerSimonian-Laird consensus values are weighted with uncertainty surrounding the consensus value decreasing roughly in proportion to the square root of the number of results being combined.
Therefore, this approach can underestimate dark uncertainty in cases such as this where the number of laboratories is small. However, we note the alternative hierarchical Bayesian approach available in the NIST Consensus Builder offers similar results (0.20‰ expanded uncertainty at 95% confidence), suggesting that DerSimonian-Laird anal- ysis provides a reasonable estimate of the consensus value and its uncertainty.
Non-certified values such as this are a best estimate of the true value; however, they may reflect only the measure- ment repeatability and may not include all sources of uncertainty (Mayet al. 2000). An example of unaccounted uncertainty could be from the boron isotope ratio of NIST SRM 951 bracketing standard itself that was used by all laboratories in this study (NIST SRM 951 10B/11B absolute abundance ratio of 0.24730.0002). While the δ11B value of NIST SRM 951 of 0‰, by definition, carries no uncertainty, heterogeneities between different batches of NIST SRM 951 used in each laboratory could potentially have an impact on absolute reported δ11B values. We consider this source of uncertainty and its impact on inter- laboratory results small; however, because of the close agreement of boric acid standard BAM ERM-AE121 (no matrix removal step required) measurements provided by five out of seven laboratories in this study.
Inter-laboratory measurement discrepancy and cal- culated pH: Boron isotope measurements in marine carbonates are commonly used to calculate seawater pH values using the simplified relationship described in Equation (1) (Zeebe and Wolf-Gladrow 2001); see also full expres- sion in Rae (2018):
pH¼pK∗Blog δ11Bswδ11Bborate
δ11BswαBδ11Bborate1000ðαB1Þ
!
(1) where αBis the fractionation factor between the two major species of boron in seawater (boric acid and borate;
1.0272; Klochko et al. 2006), pKB* is the dissociation constant for boric acid in seawater, and δ11Bborate and δ11Bsware the respective boron isotopic ratios of the borate ion (thought to be incorporated into marine carbonates) and total boron in seawater (39.61‰; Foster and Pogge von Strandmann 2010). Although the inter-laboratory range in meanδ11BSRM951values reported from each laboratory was similar (approximately 0.5‰) for each RM, if treated as a true carbonate sample (assuming a sensitivity ofδ11BSRM951
to pH equal to borate ion; Equation 1), seawater pH values calculated using theseδ11BSRM951values result in a range in pH of 0.02 pH units for NIST RM 8301 (Coral) and a larger 0.10 pH unit range for NIST RM 8301 (Foram). This difference largely reflects the non-linear relationship between carbonate δ11B and pH (Equation 1) but also highlights the significant potential differences in calculated pH from boron isotope data produced in different labora- tories, hence the need for reference materials like NIST RM 8301 to help tighten pH reconstructions using this proxy.
Boron isotope values and NIST RM 8301 homogene- ity testing: Although the solutions comprising NIST RM 8301 were dispensed from carboys into the 4 ml distribution vials and capped as soon as possible, the sequential nature of the dispensing through single lengths of tubing has the potential to introduce heterogeneities across a reference material batch. Despite such potential bias, δ11BSRM951
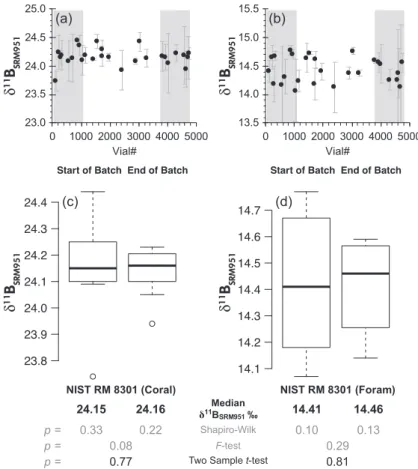
values for each vial from all participant laboratories agree well across the entire seventeen racks (each rack contained 289 vials) of each reference material (Figure 3). Vial δ11BSRM951 values from the start (first four racks; first 24%
of vials;n=9) and end (last four racks; last 24% of vials;
n=8) of the dispensing sequence vary by<0.03‰ in both RM 8301 (Coral) solution (with a typical processed aliquot size of≈10µl), and NIST RM 8301 (Foram) solution (with a typical processed aliquot size of ≈ 50μl). The individual vial differences are indistinguishable at the quoted precision. Sampling of the population was limited by the
labour-intensive nature of boron isotope data collection.
Shapiro-Wilk andF-tests show data subsets are, respectively, normally distributed and of similar variance (p>0.05). A two-samplet-test comparing available data could therefore be performed that showed no statistically significant differ- ence (p>0.05) could be resolved between mean δ11BSRM951values for vials at the start and end of the batch and speak for homogeneity of the reference materials.
Stability of reference materials is also of great impor- tance; however, as yet insufficient time has elapsed for a rigorous investigation into NIST RM 8301 stability. Release of these solutions for use by the community, without lengthy delay, was considered a priority. We note that many inter- laboratory participants have continued to use these solutions for more than 1 year and have obtained similar results to those that they report here. Full stability testing will be
performed by NIST at a later date, with results made available on the NIST website (https://www.nist.gov/srm) along with recommendations of storage conditions.
NIST RM 8301 (Foram) reproducibility issues: Multi- ple laboratories using the well-established ion exchange column matrix separation technique reported poorer repro- ducibility when using the lower B mass fraction NIST RM 8301 (Foram) solution. As an example, NIST results for this solution varied by0.55‰ (2s) across all replicates in contrast with0.31‰ variation across replicates of the higher boron mass fraction NIST RM 8301 (Coral) solution, despite a similar mass of boron being loaded. Even the lower boron concentration solution NIST RM 8301 (Foram) has a relatively large boron mass fraction at 2μg g-1. Therefore, we consider true heterogeneities within a single vial solution to be unlikely. Furthermore, the impact of the
δ11BSRM951δ11BSRM951 δ11BSRM951δ11BSRM951
(a) (b)
(c) (d)
Two Sample t-test F-test
Figure 3. δ1 1BS RM9 51homogeneity testing of NIST RM 8301 (Coral) and NIST RM 8301 (Foram) across the batches of seventeen racks. Panels (a) and (b) plot vialδ11BS R M 9 5 1mean (data from all participants; range bars represent 2sof replicates) arranged by order dispensed (1 to 5000). Grey bars highlight vials from start (first 24% of vials;n=9) and end (last 24% of vials;n=8) of dispensing sequence. Box plots in panels (c) and (d) show median and interquartile range of vialδ1 1BS R M 9 5 1from start and end of batch. Shapiro-Wilk andF-tests show data subsets are, respectively, normally distributed and of similar variance (p>0.05). A parametric two-samplet-test was therefore applied, which revealed no statistically significant (p>0.05) difference between meanδ1 1BSRM 9 5 1across each batch of RM.
total procedural blank is also considered to be negligible (pg level) compared with the high mass of boron used per analysis (>100 ng;cf. foraminifera samples often<10 ng of B; Foster 2008). However, 11B/10B ratios are known to fractionate strongly on ion exchange columns unless near complete recovery of boron (>99%) is achieved (Lemarc- handet al. 2002). Boron can be lost at two stages during matrix separation (i) during sample loading and (ii) during sample elution steps; both being potentially detrimental to the isotopic integrity of the sample. While elution tails at NIST were all found to be low (less than 0.11 ng of B) and boron recovery from the columns was considered complete (> 100 ng loaded; tail<0.1% of sample), boron loss
during loading was not accurately quantified; thus, small amounts of B loss cannot be discounted.
Significant loss of boron during loading of foraminiferal calcite samples using these techniques has not been docu- mented previously; however, the acid concentration in these RMs (21% by volume; 3 mol l-1HNO3) is considerably higher than that commonly used to dissolve marine carbonates (e.g., 0.5 mol l-1 HNO3). A greater volume of buffer is therefore required to raise the pH of the solution before loading onto columns (20:1; cf. 2:1 Foster 2008). Rapid loading of high volume (>1 ml) samples will cause solutions to pass quickly through the resin, reducing sample–resin interaction times and Table 5.
Summary of inter-laboratory boron isotope results for NIST RM 8301
Lab Matrix removal Vial NIST RM 8301 (Coral) NIST RM 8301 (Foram)
Mean vial
δ1 1B Lab mean
δ1 1B Mean vial
δ1 1B Lab mean δ1 1B
(‰) (‰) (‰) (‰)
NIST (1) Amberlite columns 2A2 24.15 24.14 14.18 14.24
3A2 24.09 14.17
3G14 24.13 14.31
4K11 24.10 14.07
5A2 24.18 14.23
15A2 24.05 14.54
16A2 24.23 14.26
17A2 24.19 14.25
17G15 24.15 14.14
2 Amberlite Columns 14E16 24.17 24.16 14.59 14.64
1T3 24.18 14.67
6A3 24.12 14.64
3 Amberlite Columns 6Q16 24.17 24.18 14.18 14.44
14M7 24.15 14.57
17J13 24.22 14.56
4 Amberlite Columns 4A17 24.44 24.43 14.77 14.76
6G14 24.43 14.73
11K5 24.42 14.76
5 Amberlite Columns 1N12 24.25 24.30 14.65 14.66
4F10 24.36 14.71
7B3 24.29 14.61
6 Amberlite Columns 12G5 24.13 24.12 14.38 14.38
11B8 24.08 14.37
7O8 24.15 14.40
7 Microsublimation 1I4 23.74 23.87 14.41 14.30
9G8 23.92 14.12
17C12 23.94 14.38
Interlab consensus reference value 24.17 14.51
Expanded uncertainty 0.18 0.17
Overall interlab mean 24.17 14.49
2s 0.35 0.39
NIST reference values and 95% expanded uncertainties (reported at the bottom of the table in bold) were determined from reported laboratory data using the DerSimonian-Laird analysis method within the NIST Consensus Builder (Koepkeet al. 2017). A reference value is a non-certified value that is the best estimate of the true value; however, the value may reflect only the measurement repeatability and may not include all sources of uncertainty (Mayet al. 2000).
Table6. Summaryofinter-laboratorytraceelementdeterminationofNISTRM8301 nLi/CaB/CaNa/CaMg/CaAl/CaMn/CaFe/Ca μmol mol-1%RSDμmol mol-1%RSDmmol mol-1%RSDmmol mol-1%RSDμmol mol-1%RSDμmol mol-1%RSDμmol mol-1%RSD NISTRM8301(Coral) NISTLab195.340.3537.00.420.081.34.461.851.851.22.520.314.091.1 Lab235.090.4525.20.219.150.54.090.249.821.4 Lab335.153.1494.20.719.993.74.134.638.633.02.583.0 Lab435.390.3528.00.320.010.24.060.12.190.0 Lab535.610.7537.90.320.991.33.770.162.544.72.795.515.016.1 Lab615.231.0546.51.64.101.037.783.12.653.814.8816.2 Lab715.993.34.181.12.854.917.765.5 Mean5.40528.120.044.1148.132.5915.44 1s0.3118.30.650.2010.270.231.60 %RSD5.83.53.34.921.9.010.4 Numberoflaboratories7657564 NISTRM8301(Foram) NISTLab198.901.2143.52.32.991.82.871.997.610.950.390.124.171.3 Lab238.590.5123.51.72.950.52.630.4101.072.750.010.226.491.4 Lab338.762.1136.81.73.020.32.600.374.305.750.040.2 Lab439.200.1143.10.63.070.22.640.144.570.1 Lab539.342.3141.62.03.251.52.380.3109.166.550.580.325.192.0 Lab618.751.0145.12.22.591.472.412.850.190.923.564.4 Lab719.521.12.602.150.012.027.702.2 Mean9.01138.93.062.6290.9149.4025.42 1s0.358.10.120.1416.582.141.69 %RSD3.95.83.95.418.24.36.6 Numberoflaboratories7657575 nSr/CaCd/CaBa/CaNd/CaU/CaLi/Mg mmol mol-1%RSDμmol mol-1%RSDμmol mol-1%RSDμmol mol-1%RSDnmol mol-1%RSDmmol mol-1%RSD NISTRM8301(Coral) NISTLab198.140.90.191.26.210.20.150.5822.60.31.201.7 Lab238.190.10.214.45.690.70.141.6822.30.21.250.3
Table6(continued). Summaryofinter-laboratorytraceelementdeterminationofNISTRM8301 nSr/CaCd/CaBa/CaNd/CaU/CaLi/Mg mmol mol-1%RSDμmol mol-1%RSDμmol mol-1%RSDμmol mol-1%RSDnmol mol-1%RSDmmol mol-1%RSD Lab337.830.10.214.65.880.10.179.0813.40.51.251.6 Lab438.240.25.900.20.140.0831.00.31.330.1 Lab538.030.00.232.35.830.30.160.3844.40.11.490.8 Lab618.170.90.191.55.940.90.154.0840.01.11.281.3 Lab718.110.80.198.55.993.60.1811.2828.62.81.433.3 Mean8.100.205.920.16828.91.32 1s0.130.010.160.0110.70.11 %RSD1.77.32.79.61.38.1 Numberoflaboratories767777 NISTRM8301(Foram) NISTLab191.390.60.550.64.060.45.040.367.90.53.111.9 Lab231.350.00.600.33.880.65.270.268.90.53.260.8 Lab331.310.30.600.63.961.55.101.770.66.43.372.4 Lab431.350.13.740.04.710.167.10.33.480.1 Lab531.320.40.630.73.770.75.220.569.20.43.932.6 Lab611.321.10.561.03.901.04.930.768.61.23.381.2 Lab711.360.60.568.63.972.85.152.768.62.93.662.1 Mean1.340.583.905.0668.73.45 1s0.030.030.110.191.10.27 %RSD2.25.32.93.81.67.8 Numberoflaboratories767777 Meanvaluesandpercentagerelativestandarddeviationbasedonthereplicateanalysisofnvialsareshown.Whereonlyonevialwasmeasuredwithinlaboratory,precisionisbasedonreplicateanalysisofthesamevial.
Li/Ca µmol mol-1 B/Ca µmol mol-1 Mg/Ca mmol mol-1
Na/Ca mmol mol-1Al/Ca µmol mol-1 Mn/Ca µmol mol-1
Fe/Ca µmol mol-1 Sr/Ca mmol mol-1 Ba/Ca µmol mol-1
Cd/Ca µmol mol-1Nd/Ca µmol mol-1 U/Ca nmol mol-1
Lab number Lab number