Vegetation map of Trail Valley Creek, Northwest Territories, Canada
Inge Gr¨ unberg and Julia Boike August 21, 2019
Abstract
The vegetation map distinguishes between five tundra vegetation types, trees, and open water at the forest–tundra transition north of Inuvik, Northwest Territories, Canada. The area is underlain by continuous permafrost. Vegetation types were distinguished based on vegetation height derived from airborne laser scanning, airborne orthophotos and observa- tions from the field site. A detailed description of the data sources and processing steps is included.
1 Technical details
Data format Geo-Tiff
Projection UTM zone 8N, WGS84 Origin 548183.5,7630973.5
Dimensions X: 1601 Y: 1489, one band Pixel Size 10 m · 10 m
Data Type Sixteen bit signed integer No-data value -9999
Data values 0: tree, 1: tall shrub, 2: riparian shrub, 3: dwarf shrub, 4: tussock, 5: lichen, 6: water
2 Study site
The vegetation map covers the Trail Valley Creek study site east of the Mackenzie Delta and 45 km north of Inuvik, Northwest Territories, Canada (rectangle of 106 km2 between 133.8116 and 133.4137◦E and 68.6515 and 68.7840◦N). A detailed description of the study area can be found in Marsh et al. (2008, 2010). We classified the vegetation into six types
(tree, tall shrub, riparian shrub, dwarf shrub, tussock, and lichen tundra) and included water surfaces in the classification.
3 Data sources used
Point observations from field work at the site, photographs, and experience to judge the vegetation type on high resolution airborne orthophotos
High resolution airborne orthophotos by ESRI Satellite, GOOGLE Satellite, and the MACS camera on board of the Polar 5 air-plane 25 August 2018 (spatial resolution of 7 cm) to define the calibration and validation polygons
Airborne laser scanning data of topographic characteristics and vegetation properties acquired mid of September 2016 at the Trail Valley Creek site (Anders et al., 2018) to be used as input for the classification
Airborne orthophotos by the Northwest Territories Centre for Geomatics which were acquired in 2004–2008 with red-green-blue (RGB) bands to be used as input for the classification
4 Processing steps with QGIS 2.18
Airborne laser scanning data was processed in the following steps:
1. Download rasters derived from laser scanning data from Pangea: https://doi.
pangaea.de/10.1594/PANGAEA.894884
2. Calculate slope, aspect, roughness, and TPI (Topographic Position Index) from the DEM (Digital Elevation Model) using the gdaldem functions
3. Resample the rasters from 1 m to 10 m spatial resolution using the
• Maximum for maximum vegetation height and TPI
• Average for mean vegetation height, slope, and elevation (only for watershed analysis)
• Median for aspect and roughness
• Standard deviation for TPI
4. Compute the Topographic Index using watershed analysis of the 10 m elevation 5. Create mask with the laser scanning data extent
Airborne orthophotos by the Northwest Territories Centre for Geomatics were pro- cessed in the following steps:
1. Download airborne orthophotos from the Northwest Territories Centre for Geo- matics http://www.geomatics.gov.nt.ca
2. Clip tiles to match the DEM extent 3. Merge all tiles to one
4. Merge three bands into one raster
5. Compute Hue-Intensity-Saturation (HIS) image
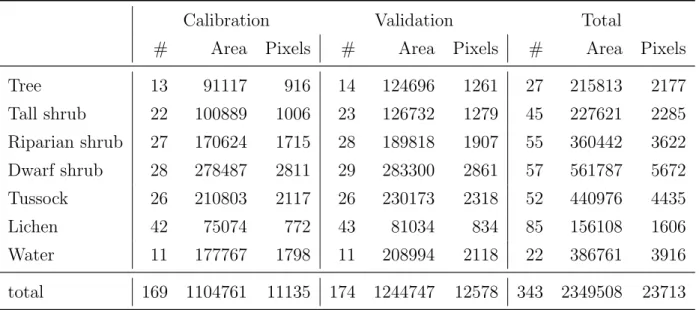
Table 1: Number of polygons, total area of the polygons (m2) and number of pixels (10 m·10 m) in the gridded dataset used for calibration and validation of the vegetation map; the areas differ slightly in the gridded version of the dataset.
Calibration Validation Total
# Area Pixels # Area Pixels # Area Pixels
Tree 13 91117 916 14 124696 1261 27 215813 2177
Tall shrub 22 100889 1006 23 126732 1279 45 227621 2285
Riparian shrub 27 170624 1715 28 189818 1907 55 360442 3622 Dwarf shrub 28 278487 2811 29 283300 2861 57 561787 5672
Tussock 26 210803 2117 26 230173 2318 52 440976 4435
Lichen 42 75074 772 43 81034 834 85 156108 1606
Water 11 177767 1798 11 208994 2118 22 386761 3916
total 169 1104761 11135 174 1244747 12578 343 2349508 23713
6. Resample the rasters from 0.5 m to 10 m spatial resolution using the
• Average for RGB and HIS (6 bands)
• Standard deviation for RGB (3 bands)
Manual identification of vegetation reference areas was needed for calibration and validation regions. We used point observations as a basis for interpreting high resolu- tion airborne orthophotos. In more detail, we followed the following workflow:
1. Load locations of field observations
2. Load high resolution airborne orthophotos
3. Identify polygons of distinct vegetation types within the laser scanning extent 4. Check that the polygons cover the same single vegetation type in all image sources
which are not perfectly co-registered
5. Divide the complete set of 343 polygons into calibration and validation subsets based on:
• All polygons based on field observations and pictures are used for validation
• All polygons per vegetation type are sorted by area and alternately assigned to each subset with exceptions of the field observations
• Guarantee that polygons in the validation subset have at least the same number and a bigger total area than in the calibration subset
6. Create raster masks of vegetation calibration and validation areas matching the extent and resolution of the other datasets
The final number and area of polygons per vegetation type in both subsets is summa- rized in Table 1.
5 Processing steps with Python 3.6.8
Compute extra band ratios from the topographic and optical data. In more detail, we followed the following workflow:
1. Smooth the Topographic Index map with the maximum of 9 cells 2. Add additional band with Maximum−Mean
Maximum+Mean vegetation height (called Vegetation Height Ratio)
3. Add additional band with Roughness−Meanvegetationheight
Roughness+Meanvegetationheight (called Height Roughness Ratio)
4. Add additional band with Intensity−4·Saturation
Intensity+4·Saturation (called Intensity Saturation Ratio) Combine the classification data from the 20 bands at 10 m by 10 m spatial resolution
to a single dataset:
1. Average slope 2. Median aspect 3. Median roughness 4. Maximum TPI
5. Standard deviation of TPI 6. Topographic Index
7. Maximum maximum vegetation height 8. Average mean vegetation height
9. Average of Red 10. Average of Green 11. Average of Blue 12. Average of Hue 13. Average of Intensity 14. Average of Saturation 15. Standard deviation of Red 16. Standard deviation of Green 17. Standard deviation of Blue 18. Vegetation Height Ratio 19. Height Roughness Ratio 20. Intensity Saturation Ratio
Visually analyse the band characteristics for each vegetation type using the cali- bration polygons. In more detail, we followed the following workflow:
1. Extract all pixel values within the manually classified calibration areas for each vegetation type
2. Calculate statistics (5th, 10th, 25th, 50th, 75th, 90th, 95th percentile, mean, minimum and maximum) for each vegetation type and water and for each of the 20 bands
Classify the complete image using a combination of manually defined thresholds for the 20 bands to discriminate between the vegetation types and water.
Filter the classified map by replacing all vegetation patches of less than 4 pixels by the vegetation type found in most of the surrounding pixels
Compute the classification accuracy based on the calibration and the validation data and an equal amount of pixels per vegetation type, namely 834 randomly selected from all validation data and 772 pixels from the calibration data, respectively.
6 Final result
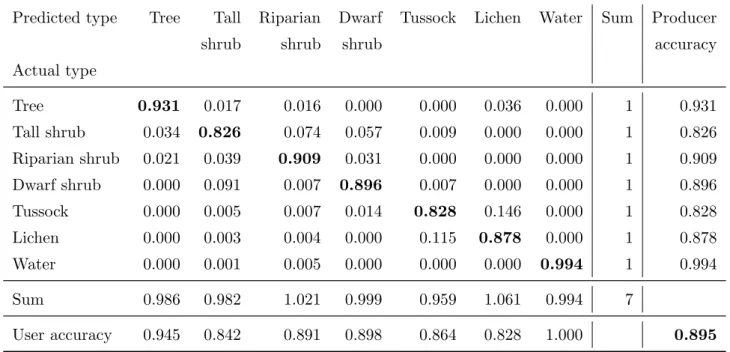
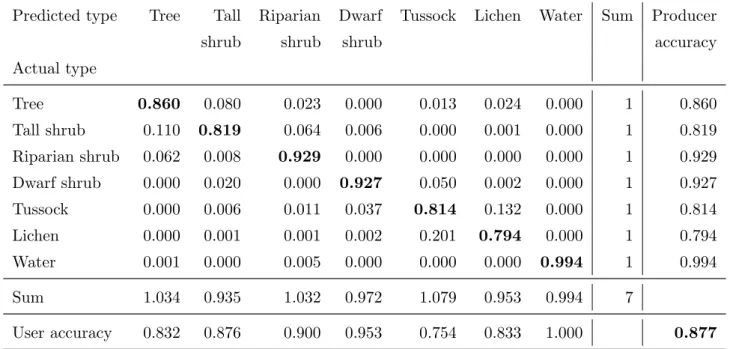
The user, producer, and final accuracy of the calibration and validation data is summarized in Tables 2 and 3, respectively. All vegetation types have a user and producer accuracy above 75% in the validation dataset and above 82% in the calibration dataset. The final map accuracy is 87.7% and 89.5%, respectively. The most similar types are tussock and lichen tundra, which are most often misclassified (Table 3).
Table 2: Confusion Matrix using the calibration data.
Predicted type Tree Tall Riparian Dwarf Tussock Lichen Water Sum Producer
shrub shrub shrub accuracy
Actual type
Tree 0.931 0.017 0.016 0.000 0.000 0.036 0.000 1 0.931
Tall shrub 0.034 0.826 0.074 0.057 0.009 0.000 0.000 1 0.826
Riparian shrub 0.021 0.039 0.909 0.031 0.000 0.000 0.000 1 0.909
Dwarf shrub 0.000 0.091 0.007 0.896 0.007 0.000 0.000 1 0.896
Tussock 0.000 0.005 0.007 0.014 0.828 0.146 0.000 1 0.828
Lichen 0.000 0.003 0.004 0.000 0.115 0.878 0.000 1 0.878
Water 0.000 0.001 0.005 0.000 0.000 0.000 0.994 1 0.994
Sum 0.986 0.982 1.021 0.999 0.959 1.061 0.994 7
User accuracy 0.945 0.842 0.891 0.898 0.864 0.828 1.000 0.895
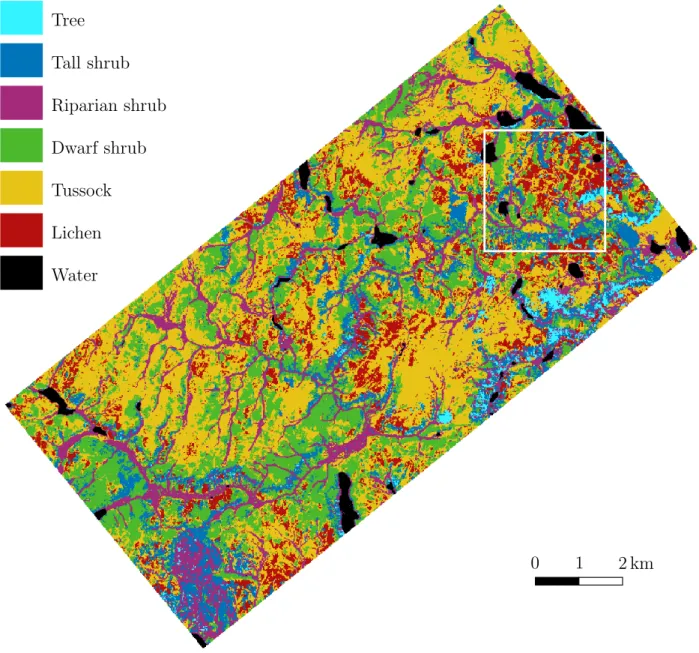
According to the final vegetation map, tussock tundra covers the largest area within the study region (37.0%), followed by dwarf shrub (23.9%), riparian shrub (13.6%), tall shrub (10.9%) and lichen tundra (10.4%) (Table 4). Lakes cover roughly 2.4% of the area and trees grow on 1.9%. However, these values can only serve as first estimate as they are sensitive to the applied thresholds. The final vegetation map is shown completely in Figure 1 and as a detail including the most important input data in Figure 2.
While the quantitative map quality is very good (accuracy of 87.7% for validation data, each class better than 75%), a careful observer can identify some areas where the classifica- tion does not provide good results:
Other surfaces than the seven classes can be found in the study area, in particular a few man-build structures (a road and a field camp with instrumented towers) and
Table 3: Confusion Matrix using the validation data.
Predicted type Tree Tall Riparian Dwarf Tussock Lichen Water Sum Producer
shrub shrub shrub accuracy
Actual type
Tree 0.860 0.080 0.023 0.000 0.013 0.024 0.000 1 0.860
Tall shrub 0.110 0.819 0.064 0.006 0.000 0.001 0.000 1 0.819
Riparian shrub 0.062 0.008 0.929 0.000 0.000 0.000 0.000 1 0.929
Dwarf shrub 0.000 0.020 0.000 0.927 0.050 0.002 0.000 1 0.927
Tussock 0.000 0.006 0.011 0.037 0.814 0.132 0.000 1 0.814
Lichen 0.000 0.001 0.001 0.002 0.201 0.794 0.000 1 0.794
Water 0.001 0.000 0.005 0.000 0.000 0.000 0.994 1 0.994
Sum 1.034 0.935 1.032 0.972 1.079 0.953 0.994 7
User accuracy 0.832 0.876 0.900 0.953 0.754 0.833 1.000 0.877
disturbed areas with bare soil or grass and sedge dominated vegetation. These surface types are very limited in area and were not considered in the classification. They also change more rapidly than the landscape in general. However, these areas were not excluded but misclassified.
Small scale patterns cannot be resolved in the vegetation map of 10 m spatial resolution.
This is in particular a problem in polygonal areas which show small scale differences between open water, sedges, shrubs on rims, and/or lichen vegetation in dry centres.
In the map, polygonal areas are typically classified as lichen or tussock tundra or as riparian shrubs.
Small patches of trees in riparian and tall shrub areas are unlikely at the study site and thus usually a result of misclassification. These are likely a result of very tall vegetation, as everything above 3 m is defined as tree. While shrubs of this size are indeed unlikely, it may well be that the LiDAR vegetation height is not accurate in areas of steep slopes, deeply incised channels and at densely vegetated lake shores.
In general, such small patches should correctly be classified as tall shrub or riparian shrub.
Lichen and tussock tundra are more often mixed up than other classes. The main rea- son is that both types appear bright on the orthophotos and vegetation heights below 30 cm are not properly resolved in the LiDAR data. The DEM is also too coarse to resolve the small scale hummocks.
Vegetation islands in lakes occur in a few cases if the LiDAR derived DEM has a higher roughness than expected for an open water surface or if the orthophotos are unusually bright because of reflections on the water surface.
These known issues could be improved by using orthophotos and airborne LiDAR of higher spatial resolution. To properly solve all problems, a manual postprossessing including an assessment of each vegetation patch would be necessary.
0 1 2 km Tree
Tall shrub Riparian shrub Dwarf shrub Tussock Lichen Water
Figure 1: Final vegetation map in its complete extent; the white square indicates the extent shown in Figure 2.
0 0.5 km
(a) (b)
(c) (d)
Figure 2: (a) Detail of the final vegetation map (please see legend in Figure 1) and examples of the input data: (b) airborne orthophotos from the Northwest Territories Centre for Geomat- ics, the white triangle indicates the location of the Trail Valley Creek Camp, (c) digital eleva- tion model obtained from airborne laser scanning data (the colour scale is dark blue: 40 m to red: 120 m) and (d) maximum vegetation height obtained from airborne laser scanning data (the colour scale is dark blue: 0 m to red: ≥2 m).
7 Explanation of the classification approach
We usedsupervised classificationinstead of clustering approaches because we needed to be able to relate the classes to specific vegetation types observed in the field. The main aim of our study was to provide a basis for potential upscaling approaches.
We usedmanually defined thresholdsto distinguish between different vegetation types and water. This is in contrast to often used other approaches such as Maximum Likelihood Classification or more recent tools of machine learning such as Random Forest. We com- pared our results to the output of several machine learning techniques using the default parameters of the implementation in the Python 3 sklearn package, namely Decision Tree, Extra Trees, K Neighbors, Linear Regression, Logistic Regression, Gaussian Naive Bayes, Linear Discriminant Analysis, Quadratic Discriminant Analysis, Random Forest, Gradi- ent Boosting, Ada Boost, and Bagging. Most algorithms yielded worse results for overall accuracy, minimum user and/or minimum producer accuracy as compared to the simple thresholds approach. We only got better results usingExtra Trees,Decision Tree, Gradient Boosting, andGaussian Naive Bayes. However, we decided to use the more simple approach because (I) the improvement in accuracy of the validation data was only moderate, up to 6% for the final accuracy, (II) the choice of parameters, the specific implementation and, in some cases, the random nature of the approaches yield less reproducible results, and (III) it is much more challenging to understand why certain results were obtained and why the approach works better or worse in specific cases.
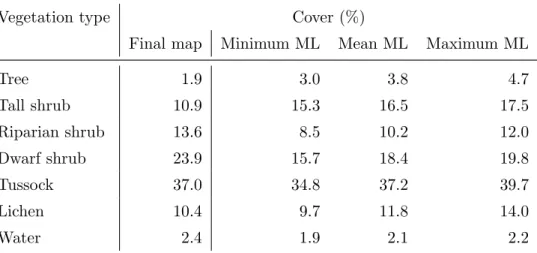
However, we used the machine learning results of the well-fitted models to assess whether the cover fractions of the different vegetation types were realistic. We found that our final vegetation map likely underestimates the cover fraction of trees and tall shrubs, while the area covered by riparian shrubs and dwarf shrubs is probably slightly overestimated (Table 4).
Table 4: Cover of each vegetation type according to the final vegetation map and the minimum, mean and maximum values of the four best machine learning (ML) approaches.
Vegetation type Cover (%)
Final map Minimum ML Mean ML Maximum ML
Tree 1.9 3.0 3.8 4.7
Tall shrub 10.9 15.3 16.5 17.5
Riparian shrub 13.6 8.5 10.2 12.0
Dwarf shrub 23.9 15.7 18.4 19.8
Tussock 37.0 34.8 37.2 39.7
Lichen 10.4 9.7 11.8 14.0
Water 2.4 1.9 2.1 2.2
Wefiltered the final mapand added all patches with less than four pixels to a surround- ing bigger patch. This processing step leads to the loss of information on small patches.
We decided to use the filtering because (I) it improved the overall accuracy from 83.4% to 87.7% for the validation data and (II) visual inspection of the final map suggested that most of the small patches did not correspond to different types.
Acknowledgments
This contribution was financially supported by Geo.X, the Research Network for Geosciences in Berlin and Potsdam (Grant-number: SO 087 GeoX) and the Alfred Wegener Institute through the MOSES (Modular Observation Solutions for Earth Systems) project by the Helmholtz Association.
References
Anders, K., Antonova, S., Boike, J., Gehrmann, M., Hartmann, J., Helm, V., H¨ofle, B., Marsh, P., Marx, S., and Sachs, T.: Airborne Laser Scanning (ALS) Point Clouds of Trail Valley Creek, NWT, Canada (2016), doi:10.1594/PANGAEA.894884, 2018.
Marsh, P., Pomeroy, J., Pohl, S., Quinton, W., Onclin, C., Russell, M., Neumann, N., Pietroniro, A., Davison, B., and McCartney, S.: Snowmelt Processes and Runoff at the Arctic Treeline: Ten Years of MAGS Research, pp. 97–123, Springer Berlin Heidelberg, Berlin, Heidelberg, doi:10.1007/978-3-540-75136-6 6, 2008.
Marsh, P., Bartlett, P., MacKay, M., Pohl, S., and Lantz, T.: Snowmelt energetics at a shrub tundra site in the western Canadian Arctic, Hydrological Processes, 24, 3603–3620, doi:10.1002/hyp.7786, 2010.