Effects of climate change on
alpine vegetation – functional analysis as a basis for future predictions
DISSERTATION ZUR ERLANGUNG DES DOKTORGRADES DER NATURWISSENSCHAFTEN (DR. RER. NAT.)
DER FAKULTÄT FÜR BIOLOGIE UND VORKLINISCHE MEDIZIN DER UNIVERSITÄT REGENSBURG
VORGELEGT VOM
Sergey Rosbakh
aus Bratsk, Russische Föderation
im Jahr 2013
ii
Das Promotionsgesuch wurde eingereicht am: 26.11.2013
Die Arbeit wurde angeleitet von: Prof. Dr. Peter Poschlod
Prüfungsausschuss:
Vorsitzender: Prof. Dr. Thomas Dresselhaus Erstgutachter: Prof. Dr. Peter Poschlod
Zweitgutachter: Prof. Mag. Dr. Georg Grabherr Drittprüfer: PD. Dr. Christoph Reisch
Unterschrift:
iii Моей семье, Александру, Наталье и Марии Росбах,
которые верят в меня и поддерживают, чем бы я не занимался и где бы я не был
iv
Contents
Acknowledgments V
Summary VIII
Chapter 1 General introduction 1
Chapter 2 Specific leaf area correlates with temperature: new evidence from trait variation at the population, species
and community levels 13
Chapter 3 The temperature sensitivity of pollen germination shapes
species distribution patterns 38
Chapter 4 Initial temperature of seed germination as related
to species occurrence along temperature gradient 58 Chapter 5 Altitude matters – contrasting effects of climate change
on the vegetation development at different elevations
in the Bavarian Alps 88
Chapter 6 Conclusions and perspectives 114
References 119
Appendix 139
Acknowledgments
v
Acknowledgments
One can imagine a PhD thesis as a pyramid, with the PhD student sitting on its tip and large number of people making the solid base of this monument. In the following lines I would like to thank all of you, who helped me to carry out the thesis.
My very first thanks go to my supervisor, Professor Dr. Peter Poschlod, for his believe in me, mental and physical support, knowledge and experience that enriched me a lot. I guess it was not an easy decision to give this PhD topic to an unfamiliar guy from Siberia and I hope I did not give you any single reason to regret about that. Thank you for the creative freedom and numerous fruitful discussion during my PhD! Second, I am very grateful to the Bavarian Ministry of Education, Science and Art for the financial support during my PhD (FORKAST project). Also, a very generous scholarship granted by the International Office at the University of Regensburg (Ms. Elli Wunderlich and Ms. Borislava Marinova) helped me to finish my PhD on time. I extend further my thanks to colleagues at the Institute of Botany (University of Regensburg), namely, Ingeborg Lauer, Christine Gutmann, Heike Pfaffenzeller, Petra Shitko, Sabine Fisher and the greenhouse staff for their support during lab work and daily routine at the University. Apart from teaching me skills and methods, several people contributed significantly to my development as a scientist. From Maik Bartelheimer I learned how to plan, organize and control all processes running in office as well as in lab. Christine Römermann showed me the way, how to enjoy the writing process; together with Markus Bernhardt-Römermann, they also could convinced me that making statistics is rather fun than a challenge. The best technician in world, Günter Kolb, always could find a solution for every complicated problem I got during work in the field or in the lab. For his support in learning (Bavarian) German I also would like to say
vi
“Merci Dir!”. Volker Debus, the best office neighbor one could wish, inspired me in last years with his experience in flora and vegetation of nearly all hidden places in the world.
The most complicated and at the same time the most exciting part of the thesis was to develop the ideas, which finally have been shaped in the form of the current thesis. Therefore, I would like to acknowledge the supportive atmosphere at our department: Simone Tausch, Martin Leipold, Phillip Glaab, Maria Hanauer, Christoph Reisch, Dany Listl always had enough time and passion for teaching and explanation. I am also appreciative to John Hodson, John Dickie and Kingsley Dixon and several anonymous referees, who generously provided several important comments on earlier versions of the thesis chapters.
In four and half years of my PhD study, I spent 19 months working in the Bavarian Alps, where the working conditions, including accommodation, transportation, technical and information support, were organized by the staff of the National Park Berchtesgaden. I appreciate very much all efforts, which were done by Michael Vogel, Helmut Franz, Doris Huber, National Park rangers and trainees, in order to make our ambitious scientific plans true. I would also like to thank my beloved colleagues from University of Würzburg, Bernhard Hoiss, Annette Leingärtner, Julian Gaviria, Katharina Kallnik and Myrthe, who accompanied me during long working days and nights in the field, for their support, humor and many great moments we experienced together. Joint work in the mountains brought us together and I am very glad that it turned in the friendship. A great number of students, trainees and volunteers helped me in the field as well as in the lab: Helena Schmidt, Leonie Schaefer, Christopher Parzefall, Florian Neumayer, Daniel Piehlmaier, Isabel
Acknowledgments
vii Berger, Susanne Weissflog, Wolfgang Gass, Darja Barteneva, Stefanie Meier, Theresa Lehmair, Fridtjof Glick, Patricia Krickl, Nico Zankl, Jennifer McCaw, Irina Rakitschenkova, Hias Amann, Fabian Arene, Marine Pouget, Katja Fleckenstein, and many others, whose names I could forget. Together we shared long hikes at rain and shine, long working hours, lab routine and cultural mismatches. Thank you for your priceless help and support!
Lastly, I would like to thank people, who always made me feeling stronger during this long journey. First of all, I am infinitely grateful to Mehdi Abedi, who was always my second shoulder from my very first day in Germany, whenever I needed any help. Not only long scientific, but also deep philosophical discussions with him in our office with a cup of black tea affected me positively and made me who I am now. My family, although being very far away, has provided me enormous amount of love and support that helped me to survive the long separation with them and my homeland. Three wonderful girls, Desiree Dotter, Patrizia Estler and Franziska Bucher, brightened up the everyday life at the University and were always ready to listen to my complaints about the hard life of a PhD student. Without you lunch breaks would be not so tasty, I will miss all of you!
I am very grateful to my Otto-Hahn and Regensburg families, Peter Pröls, Peter Sothmann, Adelina Gomez, Gena Yordanova, Javi Maceda, Theresa Bonafe, Robert Hirche, Karolina Werner, Milan Obradovic, Tanya Yakovleva, Corinna Rossner, Christoph Staar, Sabine Moll and Orsi Farkas for showing me other exciting sites of the life, very different but not less exciting than science. Thanks to all of you!
viii
Summary
Despite broad evidence that climate change continuously effects alpine vegetation at different levels, the mechanistic understanding of these changes is still missing. The aims of the present thesis were elucidating three key aspects regarding the application of a functional approach to explore climate-induced changes of alpine vegetation. In the first part of the thesis, climate relevance of three key plant functional traits (specific leaf are (SLA), seed germination, pollen germination and pollen tube growth) was examined, in order to prove the possibility to use them as direct correlates of species distribution ranges.
Second, I aimed to provide recommendations for correct application of the functional traits, considering trait intraspecific variability, trait variations at species and community levels, effect of other environmental factors on trait- climate relation and trait’ phylogenetic constraints. In the last part of the thesis the functional approach as suitable tool to detect mechanisms ruling recent changes of alpine vegetation was verified.
Chapter 2 deals with the strength of the relationship between SLA and temperature at the population, species and community levels, including impacts of other environmental habitat characteristics on this relationship. The results of this chapter indicated that the intraspecific variability of SLA values was relatively low. Only 5 out of 28 studied species showed significant differences
Summary
ix in their trait values along the temperature gradient. SLA was significantly correlated with temperature at the species (r²=0.04, p<0.001) and community levels (r²=0.08, p<0.001). The correlation between SLA and the mean annual temperature was modified by the effects of disturbance and soil phosphorous content, explaining 9.8% and 8.9% of the modelled variation, respectively (r²=0.89, p<0.001). We suggest that the strong relationship between SLA and temperature provides convincing evidence that this easy-measurable trait can be used as a predictor of species distribution ranges under changing temperature conditions.
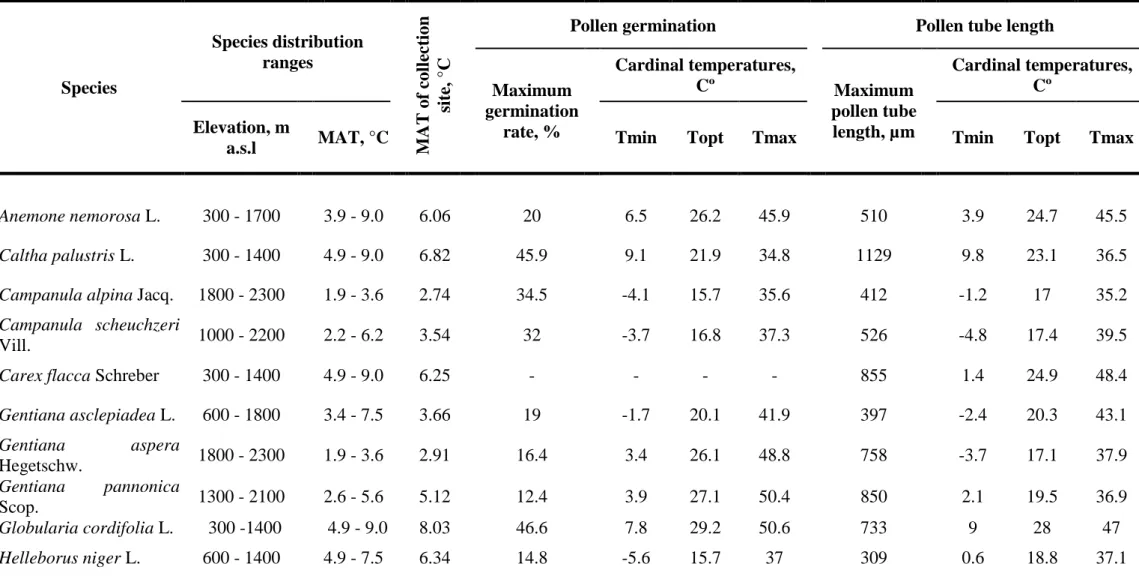
In chapter 3 I tested whether temperature requirements of pollen germination and tube growth could be used as direct correlates for predicting species distribution ranges. The results of this study revealed a strong and positive relationship between the minimal and optimal temperatures of pollen germination and temperature conditions at our collection sites (r²=0.41, p<0.01 and r²=0.2, p<0.05, respectively). For pollen tube growth, the minimal and optimal temperatures of the process were also significant predictors of species occurrence under the respective climatic conditions (r²=0.61, p<0.001 and r²=0.57, p<0.001, respectively). The strong relationship found between the temperature requirements of the progamic phase and habitat temperature could help in understanding the present species distribution along climatic gradients
x from a functional perspective and assist in better projecting of future distributional range alterations caused by environmental changes.
Chapter 4 explores to which extent germination requirements of species with different geographic boundaries are related to their habitat macroclimatic characteristics. The results of the study show that initial temperature of seed germination (Tm in) is direct correlate for predicting species distribution ranges along temperature gradient. The study reveals that Tm in is strongly negatively correlated to habitat temperature; among the studied species Tm inclearly increased with decreasing mean annual temperature (MAT)(r²= 0.57, p<0.001).
Considering phylogenetic biases, coevolution of seed traits as well as precipitation along with microclimatic factors did not affect the strength of this relationship. Our results suggest that the Tm in-MAT relation can particularly provide insights into species distribution patterns, vegetation dynamics and community assembly rules along altitudinal and latitudinal gradients. We argue that including the Tm in in species distribution models may help to improve the accuracy and specificity of predictions of vegetation shifts under global change scenarios.
The chapter 5 deals with changes in subalpine, lower and upper alpine vegetation belts in the Bavarian Alps in last 50 years. In order to reveal mechanisms standing behind the changes, functional traits, along with several common floristic and phytosociological methods, were applied. The results of
Summary
xi the study indicate that the direction and magnitude of the changes differed considerably among the studied communities and were dependent on initial species composition, vegetation structure and geographical context of individual vegetation belts. Although the species richness did not change significantly over last 50 years in the dense subalpine Seslerio-Caricetum sempervirentis communities, the immigration of species from lower altitudes and increased environmental favorability for already present thermophilous species led to increase of plant cover (+23%). The most pronounced changes were found in sparse low alpine Caricetum firmae communities. Due to gap availability and low competitive ability of alpine species, significant increase in species richness and plant cover (+6.4 species and +18%, respectively) were detected in this vegetation belt. The analysis revealed that in both communities species with traits that are advantageous under warmer conditions, such as higher specific leaf area, high stature and heavier seeds, significantly increased their frequencies and abundances. Floristic and vegetation changes of upper alpine communities were contrasting to those found in the study region as well as in the close mountain ridges. Despite temperature increase and available for colonization gaps in the communities, species richness (–4.7 species) and plant cover (–25%) significantly decreased. We argue that increased instability of high alpine habitats, due to upward retreat of the permafrost zone (as a consequence of recent warming), could hamper the colonization of high altitudes by montane
xii and subalpine species, since they demand developed soils with high water- retention capacity.
Finally, in chapter 6 we conclude that functional approach has a big potential to improve understanding of climate-induced vegetation changes at high altitudes and better predict the direction and magnitude of these changes under future climate scenarios. Some aspects of future studies in this field are also discussed.
Chapter 1 General introduction
1
Chapter 1
General introduction
Climate change at high altitudes and the need for other research tools
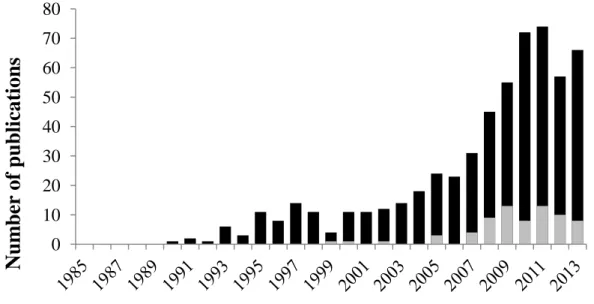
It has been nearly 20 years, since Georg Grabherr, Michael Gottfried and Harald Paull from University of Wien have published a paper in Nature on effects of global warming on mountain plants (Grabherr, Gottfried & Pauli 1994). In the one-page paper they provided first conclusive evidences of significant effects of global warming on alpine vegetation, namely an increase of species richness during past few decades at alpine and nival summits in the Alps. After the problem of negative impacts of human-induced climate change on alpine vegetation was recognized first time at such high scientific level, alpine plant ecology has experienced tremendous growth (Figure 1). Since then, numerous studies have confirmed that ongoing climate change continuously effects alpine vegetation at different levels (Grabherr, Gottfried & Pauli 1994; Theurillat &
Guisan 2001; Walther et al. 2002; Gottfried et al. 2012). Shifts in plant life- history (McKone, Kelly & Lee 1998; Mondoni et al. 2012), disruptions of biological relationships (Klanderud 2005; Hegland et al. 2009), general upward shifts of species’ distributional ranges (Walther, Beißner & Burga 2005;
Jurasinski & Kreyling 2007; Pauli et al. 2012) belong to the most often observed responses of alpine vegetation to recent global warming. The latter is
2 particularly considered to be a serious warning, because, due to highly specific ecological conditions (Körner 1999; Nagy & Grabherr 2009) and low competitive ability of cryophilous species, it could lead to a drastic decrease of the distribution area or even extinctions of alpine species (Pauli, Gottfried &
Grabherr 2003), retreat upwards and habitat loss of alpine vegetation (Thuiller et al. 2005; Gottfried et al. 2012). That is why this problem is of high importance for nature conservation and management decisions around the world, since there is now ample evidence that the recent climatic changes are affecting a broad range of mountain regions across all continents, except of Antarctic (Walther et al. 2002; Danby et al. 2011; Jump, Huang & Chou 2012; Pauli et al. 2012;
Venn, Pickering & Green 2012).
Figure 1. Number of studies on effects of climate change on alpine vegetation. Date of information gathering: September 2013. Source: ISI Web of Science. Black bars represent papers with terms climate change and alpine vegetation and the corresponding combinations in abstract of title. Grey bars represent the proportion of papers in which plant functional traits were applied (additional term to the research query “functional trait”).
0 10 20 30 40 50 60 70 80
Number of publications
Chapter 1 General introduction
3 During the last years several research projects have been launched in order to observe, understand and predict the vegetation changes in alpine biomes (e.g.
GLORIA (Grabherr, Gottfried & Pauli 2000), ITEX (Henry & Molau 1997).
Among them is FORKAST, a research cooperation on impacts of climate change on different ecosystems of Bavaria (Germany), including alpine grasslands (www.bayceer.uni-bayreuth.de/forkast/). This thesis was carried out within a FORKAST-subproject (TP 12 Poschlod) with the aim to understand the mechanisms standing behind the present distribution of plant species along an altitudinal gradient, in order to provide a reliable basis for future predictions of climate-induced vegetation dynamics in the Bavarian Alps. The need for such study is explained by fact that, despite extensive evidences of high impacts of climatic change on alpine vegetation (574 papers published on this topic in last 23 years; Figure 1), there is still a gap in mechanistic understanding of these changes. Indeed, mainly biodiversity changes (e.g. number of gained and lost species, changes in species richness) and changes in vegetation (changes in plan cover, structural changes of plant communities) were employed as research methods in the majority of studies on the topic. Although both approaches allow to track the climate-induced changes in floristic and vegetation patterns over wide territories (e.g. GLORIA project (Gottfried et al. 2012; Pauli et al. 2012)), they hardly provide information on causes and mechanisms why a plant species or plant community changed its abundance and/or presence at a certain place and composition, respectively, in consequence of the environmental change.
4 Consequently, without a clear understanding of plant-climate relationships any conclusions on present shifts of alpine vegetation and projections of its future changes are suspect (Pearson & Dawson 2003; Thuiller et al. 2008).
Functional ecology meets alpine botany – a promising approach to understand vegetation changes in high altitudes
It is generally agreed that climate controls species distribution through ecophysiological processes of temperature and precipitation tolerance (Sakai 1987; Woodward & Williams 1987; Walther et al. 2002; Larcher 2004). To explain the controlling role of climate on a species’ geographical distribution, two approaches, differing in basic concepts, are usually employed. The first approach is based on a concept that species distribution is determined by physiological capacity of adult plants to cope with critical climate events (e.g.
frost, drought, etc.). For example, the poleward spread of particular vegetation type is strongly controlled by ability of plants to survive low temperatures or late frost events (Sakai 1987; Woodward 1987). In second approach the climatic control of species distribution is seen as a process which is mediated through population dynamic (Woodward 1987). In this case it is assumed that progressive reductions in probabilities of survival and production at one or number of life-cycle stages is critical in controlling distribution (Woodward &
Williams 1987). For instance, Pigott and Huntley (1981) have demonstrated that
Chapter 1 General introduction
5 the temperature sensitivity of pollen tube growth and the short period of stigmoid and stylar receptivity in Tilia cordata could account for the northern limit of the species in the British Isles. Although the first approach is widely used in biogeography (Sakai 1987; Woodward 1987), including modeling of potential species distribution in future (e.g. (Guisan, Theurillat & Kienast 1998;
Thuiller et al. 2005)), it explains only a portion of large-scale distribution ranges, such as the borders of main floristic or vegetation zones, as the survival limits of plant species from different biomes are often overlapping (Sakai 1987;
Körner 1999; Larcher 2004). Additionally, the geographical limits of vegetative survival may be determined by very different environmental conditions than those at other stages of the plant life cycle (Woodward 1987; Woodward 1997;
García et al. 2000). Therefore, the second approach was selected as a theoretical framework for the thesis, because it could provide a better mechanistic base for the observed alpine vegetation responses to climate change.
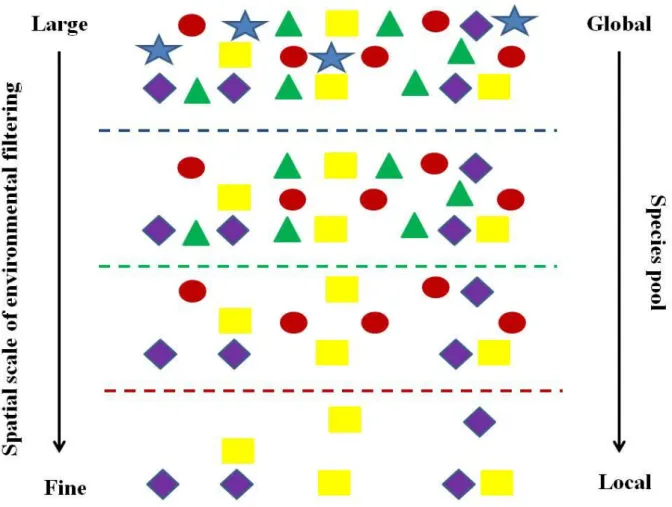
As a practical framework for the thesis (Figure 2), we employed a functional approach, which connects ecophysiological responses of plant species to changing environment and both distribution patterns and vegetation dynamics through a set of common biological attributes (functional traits; FT)(Diaz &
Cabido 1997; Lavorel et al. 1997; Westoby 1998; Weiher et al. 1999; Wilson, Thompson & Hodgson 1999; Lavorel & Garnier 2002; Canadell et al. 2007).
The functional approach is based on the assumption that plants with similar biology/ecology respond to environmental changes in comparable ways, thus
6 allowing us to reduce the enormous complexity of individual species and population needs into a relatively small number of general recurrent patterns (Diaz et al. 1999; Lavorel & Garnier 2002). The advantage of the functional approach is that ecosystem processes are determined by the traits and functional diversity of the dominant species and, thus, are relatively insensitive to the richness of other species (Grime 1998). In combination with the simplicity of measurements of FTs, in contrast to elaborated ecophysiological studies (e.g.
photosynthetic gas exchange), it notably simplifies ecosystem service assessment and/or modelling of vegetation dynamics at any scale (Canadell et al. 2007).
In the last two decades a big effort has been done to approve the relevance of FTs to changing environmental factors; dozens of plant traits were found to respond to temperature, water, availability of soil resources and levels of disturbance ((Woodward & Cramer 1996; Bernhardt-Römermann et al. 2011;
Klaiber et al. 2013); for detailed review see (Cornelissen et al. 2003)). Several broadly used functional traits such as plant life form, plant height or SLA have become very popular and have been used in the majority of environment-plant functioning related studies (e.g. (Kleyer et al. 2008)).
Chapter 1 General introduction
7
Figure 2. The graphical representation of functional approach in regard to species distribution patterns. Dashed lines are different environmental filters.
Additionally, several powerful statistical methods were developed, allowing inclusion of FTs into analysis of vegetation or flora changes by means of ordination techniques (e.g. RLQ ordination (Dolédec et al. 1996). Despite this popularity and widespread occurrence, the functional approach has hardly ever (however, see (Kudernatsch et al. 2005; Vittoz et al. 2008)) been applied to get a better understanding of alpine vegetation changes caused by global warming.
In the existing papers pool only 13% of all studies applied functional traits to explain response of alpine vegetation to changing environment (Figure 1).
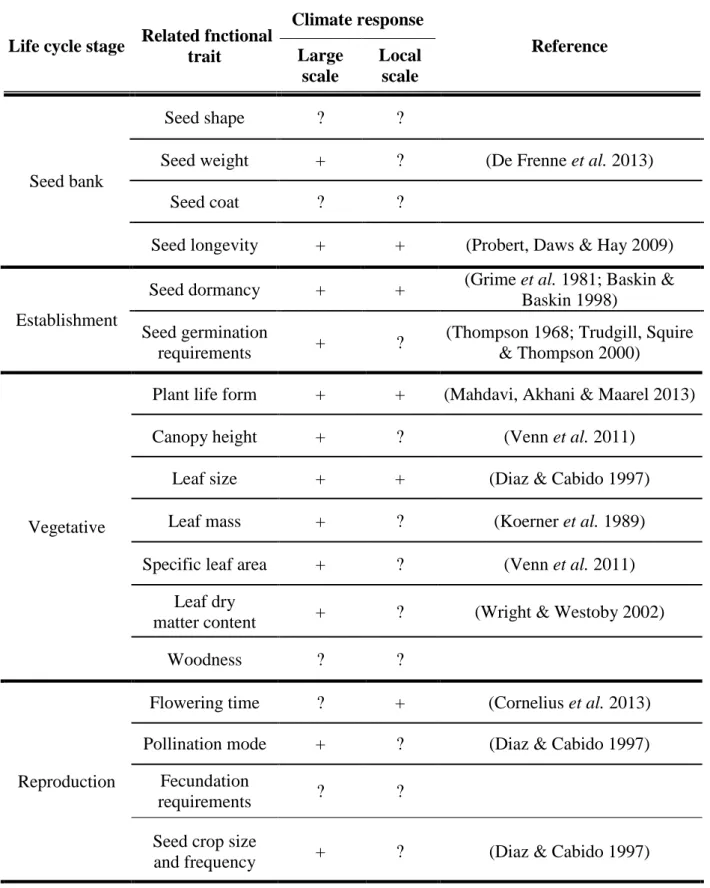
8 Moreover, the most of the used traits were only related to the morphology and growth rate of species. The little attention paid by alpine botanists to FTs is explained by fact that their relevance to climate is based mainly on some case studies, mainly comparing trait values of species originating from contrasting climatic conditions (Table 1). Although these comparisons aid to explain the large scale differences in climate response between species with different distributional ranges, such as lowland and alpine species, they are not helpful at regional and local scales (e.g. species with distribution within one vegetation belt). Meta-analyses of trait variation along climatic gradients (e.g. SLA, (Poorter et al. 2009)), with more species included, therefore, did not improve the strength of the trait-climate relationships, because they usually disregarded all important sources both internal and external of the trait variation (Ackerley et al.
2002; Vile et al. 2006; Albert et al. 2010; Lepš et al. 2011). Another reason which explains low interest of alpine botanists to functional traits is that mainly vegetative traits (whole plant, leave and stem traits) are applied to determine plant-climate interactions and regenerative traits are often remain underrepresented (Kleyer et al. 2008; Kattge et al. 2011; Pérez-Harguindeguy et al. 2013). However, recent studies demonstrate that reproductive stages of plant life cycle such as fecundation, seed germination and seedling recruitment may be more temperature sensitive and are essential to understand plant distribution over the landscape (Grubb 1977; Diaz & Cabido 1997; Fenner & Thompson 2005; Bykova et al. 2012; Poschlod et al. 2013).
Chapter 1 General introduction
9
Table 1. Climate response of functional traits. See also (Kiebacher 2008; Cornelissen et al.
2003) for detailed reviews.
Life cycle stage Related fnctional trait
Climate response
Reference Large
scale
Local scale
Seed bank
Seed shape ? ?
Seed weight + ? (De Frenne et al. 2013)
Seed coat ? ?
Seed longevity + + (Probert, Daws & Hay 2009)
Establishment
Seed dormancy + + (Grime et al. 1981; Baskin &
Baskin 1998) Seed germination
requirements + ? (Thompson 1968; Trudgill, Squire
& Thompson 2000)
Vegetative
Plant life form + + (Mahdavi, Akhani & Maarel 2013)
Canopy height + ? (Venn et al. 2011)
Leaf size + + (Diaz & Cabido 1997)
Leaf mass + ? (Koerner et al. 1989)
Specific leaf area + ? (Venn et al. 2011)
Leaf dry
matter content + ? (Wright & Westoby 2002)
Woodness ? ?
Reproduction
Flowering time ? + (Cornelius et al. 2013)
Pollination mode + ? (Diaz & Cabido 1997) Fecundation
requirements ? ?
Seed crop size
and frequency + ? (Diaz & Cabido 1997)
10
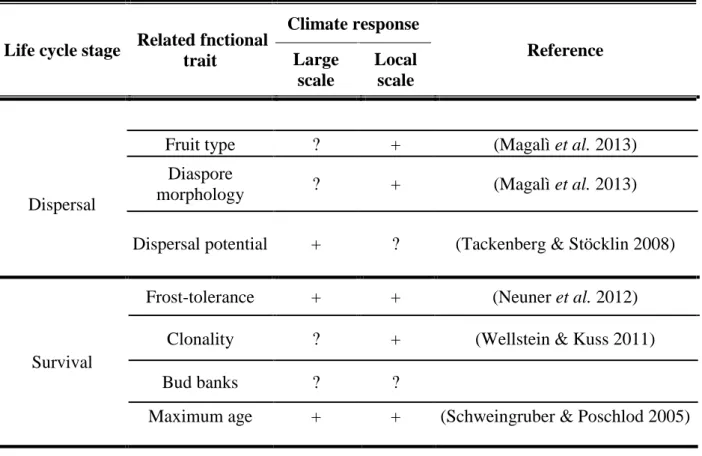
Table 1. Climate response of functional traits (continued).
Life cycle stage Related fnctional trait
Climate response
Reference Large
scale
Local scale
Dispersal
Fruit type ? + (Magalì et al. 2013)
Diaspore
morphology ? + (Magalì et al. 2013)
Dispersal potential + ? (Tackenberg & Stöcklin 2008)
Survival
Frost-tolerance + + (Neuner et al. 2012)
Clonality ? + (Wellstein & Kuss 2011)
Bud banks ? ?
Maximum age + + (Schweingruber & Poschlod 2005)
Therefore, more research on regeneration processes is urgently needed to fully reveal processes controlling species distribution and abundance (Walck et al.
2011; Bykova et al. 2012; Poschlod et al. 2013).
Thesis outline
The present thesis aims at elucidating three key aspects regarding the application of a functional approach to explore climate-induced changes of alpine vegetation. First, I examined climate relevance of several key FTs (SLA, seed germination, pollen germination and pollen tube growth), in order to prove the possibility to use them as direct correlates of species distribution ranges. The
Chapter 1 General introduction
11 particular emphasis was placed on temperature relevance of the selected traits, since temperature is the most important driver of species distribution in cold habitats (Woodward & Jones 1984). Second, I aimed to provide recommendations for correct application of the FTs, considering trait intraspecific variability, trait variations at species and community levels, effect of other environmental factors on trait-climate relation and trait’ phylogenetic constraints. Finally, I verified the functional approach as suitable tool to detect mechanisms ruling recent changes of alpine vegetation.
In the following an overview is provided about the topics that are addressed in the individual chapters and how they are linked to the aims of our study:
Chapter 2 explores the strength of the relationship between SLA and temperature at the population, species and community levels, including impacts of other environmental habitat characteristics on this relationship. Based on an extensive data set of original SLA values, I tested whether this trait can be used in further studies as an indicator of plant performance under changing temperature conditions. The knowledge on strength of the SLA-temperature relationship at different levels is essential for practical applications of the traits, since it considers effects of internal and external sources of the trait variation.
In chapter 3 I aimed to test whether temperature requirements of pollen germination and tube growth could be used as direct correlates for predicting species distribution ranges. Knowledge regarding the ecophysiological mechanisms that control the geographical ranges of plant species is scarce.
12 Therefore, this study could aid to reach a better understanding of the existing patterns of plant species distribution and to improve the accuracy and specificity of predictions of vegetation shifts under global change scenarios.
After fecundation and seed production, seed germination and seedling establishment are another two highly vulnerable stages of plant life cycle.
Therefore, in Chapter 4 I explored to which extent germination requirements of species with different distributional ranges are related to their habitat macroclimatic characteristics. Character and strength of the relationship between initial temperature of seed germination and habitat temperature particularly investigated in this study could reveal the role of germination ecology in mechanistic understanding of species distribution patterns, vegetation dynamics and community assembly rules along environmental gradients.
In Chapter 5 I verified the functional approach as an additional tool to common floristic and phytosociological methods, to reveal mechanisms standing behind climate-induced vegetation changes in the Bavarian Alps in last 50 years. The application of traits could help to explain the often reported patterns of floristic and vegetation changes from functional point of view.
Finally, the results of the previous chapters were reviewed with regard to their implications for application of functional approach in alpine botany (Chapter 6:
Conclusion and perspectives).
Chapter 2 SLA along temperature gradient
13
Chapter 2
Specific leaf area correlates with temperature: new evidence from trait variation at the population, species and community levels
Abstract
Previous studies indicate that temperature could explain only a part of the variation of specific leaf area (SLA). We assume that this is because 1) intraspecific variation of SLA values were not considered, 2) studies were focused on species level and 3) this relation was tested on single environmental gradients regardless of associated factors potentially determining complex responses of the trait.
Using originally measured SLA values for 202 species occurring in 29 calcareous grasslands along the temperature gradient, we explored the intraspecific (population), interspecific (species) and community-weighted variations in SLA and investigated the relative impact of soil moisture content, soil depth, soil fertility, disturbance and potential solar radiation on SLA variation along the temperature gradient.
The intraspecific variability of SLA values was relatively low. Only 5 out of 28 studied species (18%) showed significant differences in their trait values along
14 the temperature gradient. SLA was significantly correlated with temperature at the species (r²=0.04, p<0.001) and community levels (r²=0.08, p<0.001). The correlation between SLA and the mean annual temperature was modified by the effects of disturbance and soil phosphorous content, explaining 9.8% and 8.9%
of the modelled variation, respectively (r²=0.89, p<0.001).
The detected variation in SLA along the temperature gradient provides strong evidence that this trait can be used in further studies as an indicator of plant performance under changing temperature conditions. We argue that a strong SLA-temperature relationship is achieved when community-weighted trait values are used and when intraspecific variability as well as the effects of environmental parameters other than temperature are considered.
Introduction
Specific leaf area (SLA, one-sided leaf area per unit of dry mass) is one of the most frequently used functional traits in ecological studies (Westoby 1998;
Weiher et al. 1999; Grime 2002). Due to its positive and linear scaling with the relative growth rate (RGR) of plants (Poorter & Remkes 1990; Cornelissen et al.
1996; Hunt & Cornelissen 1997; Reich et al. 1999; Villar et al. 2005), SLA has been considered in both theoretical and applied studies as a key trait explaining the distribution of species along environmental gradients (Grime 1974; Lavorel et al. 1997; Wilson et al. 1999; Garnier et al. 2004; Poorter et al. 2009). SLA
Chapter 2 SLA along temperature gradient
15 values have been found to be dependent on differences in irradiation levels (Meziane & Shipley 2001), soil fertility (Poorter & De Jong 1999; Garnier et al.
2004), water supplies (Reich et al. 1999), carbon dioxide (Larigauderie et al.
1988) and ozone concentrations (Bussotti 2008), disturbance (Kleyer 1999) and land-use types (Diaz et al. 1999). In addition to explaining the locations of species along a resource gradient or changes in the species composition due to varying levels of resource availability, SLA reflects a number of important ecosystem properties such as productivity (Poorter & De Jong 1999; Garnier et al. 2004), litter decomposition (Cornelissen et al. 1999) and flammability (Lavorel & Garnier 2002). The global relevance of this functional trait has been confirmed to be independent of taxonomic affinity through analyses encompassing different floras from different biomes and biogeographic regions (Reich et al. 1999; Diaz et al. 2004). Thus, SLA is an easily measured, universally applicable tool for estimating the responses of single plant species, communities or whole ecosystems to environmental changes (Diaz & Cabido 1997; Hodgson et al. 1999; Cornelissen et al. 2003; Diaz et al. 2004; Vile et al.
2006).
It is generally accepted that SLA is correlated with the temperature conditions of a habitat (Woodward 1983; Körner 1999; Cornelissen et al. 2003; Luo et al.
2004; Wright et al. 2004; Poorter et al. 2009; De Frenne et al. 2013). Reduced ambient temperatures and increased temperature stress along altitudinal or latitudinal gradients lead to species turnover in plant communities, from fast-
16 growing species with high temperature thresholds for cell extension to slow- growing species that exhibit cell extension at lower temperature thresholds (Woodward et al. 1986; Körner & Woodward 1987). Low rates of cell expansion relative to the rates of cell wall and protein synthesis in elongating cells as a consequence of slow growth rates (Atkin et al. 1996; Körner 1999) lead to a large number of small cells per unit area and, accordingly, smaller and denser leaves on plants in cold habitats (Atkin et al. 1996; Poorter et al. 2009).
Additionally, the accumulation of large pools of non-structural carbon (e.g., soluble and non-soluble sugars) and high investment in (hemi)cellulose-rich sclerenchymatic tissues, which assist in coping with the frost and wind experienced at high altitudes and latitudes, can also contribute to a higher leaf density on alpine and arctic plants (Woodward 1983; Atkin et al. 1996; Körner 1999). Therefore, it is assumed that species with low SLA values will mainly be found in the cold part of temperature gradients, whereas species with relatively high SLA values should be largely restricted to the sites exposed to higher temperatures (Woodward 1983; Grime 2002; Poorter et al. 2009).
Although SLA has been proposed to reflect plant responses to climatic changes (Cornelissen et al. 2003; De Frenne et al. 2013), a close examination reveals that the link between SLA and temperature has never been systematically evaluated.
The existing studies display several limitations that may affect the strength and, thus, the predictive power of the SLA-temperature relationship:
Chapter 2 SLA along temperature gradient
17 Due to plastic responses or adaptive differentiation, similar to many other leaf traits, SLA may exhibit substantial levels of intra-specific variation along environmental gradients (Albert et al. 2010; Auger & Shipley 2013).
Despite the fact that species differ with respect to their responses to changing environmental conditions, the trait values of single species have mainly been used to estimate the relationship between temperature and SLA (Woodward 1979; Atkin et al. 1996; Luo et al. 2004; Milla et al. 2009; for a detailed review, see Kiebacher 2008). However, ignoring important aspects of the variation and distribution of a trait within a site may significantly modify the trait- environment relationship (Ackerly et al. 2002; Ackerly & Cornwell 2007).
Because the SLA-temperature relationship is usually tested along complex environmental gradients, the direct effect of temperature on SLA is often confounded by the influence of other environmental factors, such as soil fertility (Canadell et al. 2007; Kőrner 2007; De Frenne et al. 2013).
Therefore, it is not surprising that in previous studies, including global syntheses (Wright et al. 2004; Ordoñez et al. 2009; Poorter et al. 2009), the correlation between SLA and temperature has been found to be weak.
The aims of the current study were to test the strength of the SLA-temperature relationship at three different levels (population, species and community) along a temperature gradient and to estimate the relative impact of habitat characteristics (besides temperature) on the variation of SLA. More specifically, we measured SLA values in a total of 202 species found in 29 calcareous
18 grasslands located along an altitudinal gradient (1400 m difference in altitude, with a mean annual temperature range of 4°C) in the Bavarian Alps (Germany).
We analysed the data with respect to (i) the intraspecific variation of SLA associated with changes in the mean annual temperature (MAT) (population level), (ii) the interspecific variation of SLA associated with MAT (species level) and (iii) the variation in community-weighted SLA values associated with MAT (community level). In a final model (iv), we estimated the effect of habitat characteristics such as soil nutrients, disturbance levels and irradiation in addition to temperature on community-weighted SLA variations.
Materials and methods
Altitudinal gradient and characteristics of the study sites
We selected an altitudinal gradient as a suitable tool for estimating trait variations because there is clear evidence that the mean annual temperature is strongly negatively altitudinal elevation (0.6K per 100 m or shortening of the vegetation period by 3-5 days per 100 m; see also Appendix 1) (Sakai 1987;
Diaz & Cabido 1997; Körner 1999; Körner 2007).
Field work was carried out in Berchtesgaden National Park (Bavaria, Germany), which is situated in the Bavarian Alps (northern part of the Calcareous Alps) and is approximately 200 km² in size. The relief of the National Park can be characterised as typically alpine, with steep mountain peaks composed of
Chapter 2 SLA along temperature gradient
19 Triassic lime and dolomite rocks (Marke et al. 2013). The climate in the region is a typical mountain climate, showing a large decrease in mean annual air temperatures from +7° to –2°C (from 603 to 2713 m above sea level (a. s. l.), respectively). The mean annual precipitation varies from year to year, ranging from approximately 1500 to 2600 mm per year (Marke et al. 2013).
All measurements were performed at 29 sites located along a gradient from 641 to 2032 meters a. s. l. Every site, with a size of approximately 1 ha, was characterised in terms of its vegetation composition, climate (mean annual temperature (MAT), mean annual precipitation), soil moisture content, soil depth, soil fertility (potassium, phosphorous and total nitrogen content) and potential solar radiation. The last parameter was selected as an aggregate measure of site’s irradiation conditions because it shows a good correlation with UV-B radiation (Németh et al. 1996) and photosynthetically active radiation (Meek et al. 1984; Papaioannou et al. 1993). The potential solar radiation was calculated from the slope and aspect of the study sites using a solar radiation calculator (http://www.meteoexploration.com). Only estimates obtained for the summer solstice were used. Additionally, estimates of the level of disturbance (at two levels: disturbed by, e.g., heavy grazing and avalanches, versus undisturbed) were recorded at every study site.
The vegetation composition of the sites was characterised through surveys conducted from May to August in 2009. To carry out these vegetation surveys,
20 we set up ten 1 m x 1 m plots at each site. In every plot, we recorded the presence of each vascular plant species and estimated their percentage of cover.
The relative abundance of a species at a site was then calculated as the mean value of its abundance in all plots.
Data on the mean annual temperature and precipitation were obtained from the weather stations located in the National Park and are presented as the mean values for the last 7 years of observations. The soil moisture content was measured once at all sites in the middle of the vegetation period (August 2009) within 3-5 days after the last rainfall event using an HH2 moisture meter (Delta T Devices, Cambridge, UK). Soil depth was estimated by thrusting an iron rod with a 0.6 mm diameter into the soil. Both the soil moisture content and soil depth are presented as the mean values of 25 random measurements per site.
All soil samples were collected within two weeks at the end of the vegetation season (September 2009). At each site, six random pits were dug, and the soil from a depth of 5-10 cm was collected, thoroughly mixed, air dried, sieved (2 mm) and subsequently analysed. Plant-available phosphorus and potassium were extracted from the collected soil samples with a calcium acetate lactate solution (VDLUFA 1991). Phosphorus contents were determined using a UV-visible spectrophotometer (Thermo-Spectronic UV-1 model, Thermo Electron Corporation, USA) after visualising the phosphorus content with ammoniumheptamolybdate. Potassium contents were determined using an
Chapter 2 SLA along temperature gradient
21 atomic absorption spectrometer (Solaar AA model, Thermo Elemental, USA).
Total nitrogen was quantified via gas chromatographic measurement with an element analyser (Vario EL III model, Elementar Analysensysteme GmbH, Germany). The data on phosphorus, potassium and nitrogen contents are presented as the mean values of the six replicates per site.
Specific leaf area measurements
Based on the vegetation surveys, we first selected all species showing a relative abundance of greater than 1% of the total vegetation cover of a plot (in total 202). The species’ relative abundances among plots were compared, and the plot with the highest value (i.e., showing optimal ecological conditions) was taken as the site where SLA measurements of single species were subsequently carried out.
To estimate the intraspecific variation of the examined trait with temperature, SLA values were obtained for the 28 most abundant species from six to twelve additional locations. In all cases, the collection sites were spanned more than 1000 meters along the altitudinal gradient.
Specific leaf area was measured following standardised protocols (Garnier et al.
2001; Cornelissen et al. 2003; Kleyer et al. 2008). For these measurements, three fully expanded, illuminated, non-damaged leaves with petioles were collected from 10 randomly selected full flowering individuals per site. In some cases (for rare or threatened species), only two or three leaves from five
22 individuals were collected. Due to the strong effect of the water leaf status on SLA values, the collected plant material was stored in sealed humidified plastic bags in a refrigerator at a temperature of +5°C prior to processing (Garnier et al.
2001). The storage time did not exceed 48 hours (Cornelissen et al. 2003).
Following rehydration, the leaves were scanned on a flat-bed scanner (HP Scanjet G4010) at a resolution of 600 dpi, and the leaf area was measured with the aid of ImageJ software (Abramoff et al. 2004). Then, the leaves were oven- dried at 60°C for 72 hours and weighed. SLA is given by the ratio of the fresh leaf area to the leaf dry mass expressed in mm2 mg-1.
Data analysis
Relationship between SLA and temperature at the population level
The within-species SLA variation associated with MAT at the collection sites was analysed using separate linear models for each species. Nonlinear terms (SLA ~ MAT + MAT2) were also considered in these models because a trait- environment relationship can be non-linear when the effects of the species composition on community dynamics and ecosystem functioning are not additive (e.g., plant-soil feedback, complex biotic interactions, functional complementarity; Diaz et al. 2007). In cases where the quadratic term was not significant, the model was simplified. The model assumptions (a normal distribution of residual errors and homogeneous variances) were met in all cases.
Chapter 2 SLA along temperature gradient
23 Relationship between SLA and temperature at the species and community levels Prior to estimating the variation of SLA associated with temperature at the species level, we calculated an estimated value of K, which is a parameter indicating phylogenetic correlation within a trait that ranges from zero to one (Blomberg et al. 2003). Values that are not significantly different from 0 suggest that there is no phylogenetic signal in a trait, while a value of one indicates that species traits are distributed as expected under a Brownian model of evolution.
The calculation of the K values was based on a dated phylogeny of a large European flora (Durka & Michalski 2012) and was implemented in the R statistical environment (picante package) (R Development Core Team 2012;
Kembel et al. 2010).
To test the correlation between SLA and temperature at the species level, single SLA values for all selected species (see above) were associated with the corresponding MAT at the collection sites.
Community-weighted SLA values were computed as the mean trait values weighted by the relative abundance of each species. The associations between community-weighted SLA and MAT were tested using linear models following the procedure described above.
Effect of environmental factors on SLA
Because the aggregated trait values of species that co-occur in a local community better reflect the integrated effects of multiple environmental factors
24 (Ackerly & Cornwell 2007), only community-weighted SLA values were used to estimate the effect of habitat characteristics on the SLA-temperature relationship. To test the relative effects of environmental factors on community- weighted SLA values, we set up a full linear model. As explanatory variables for SLA, we included MAT, annual precipitation, soil moisture content, soil depth, soil potassium, phosphorus and total nitrogen contents, potential solar radiation and disturbance levels as both simple and quadratic terms. Colinearity was not a problem, as the explanatory variables were only weakly correlated with each other (Appendix 2). To obtain estimates of the relative effects of all environmental factors, these factors were scaled to zero mean unit variance prior to analyses. The full model was reduced via backward selection of the least significant variables until we achieved the minimal adequate model (Crawley 2007). Following model fitting, the model requirements (a normal distribution and homogeneous variances in the residuals) were checked.
All statistical calculations were performed with the open source software R, version 2.14.0 (R Development Core Team 2012).
Result
The characteristics of the collection sites are presented in Appendix 1. The specific leaf area values of the studied species ranged from 6.32 (Erica herbacea, evergreen dwarf shrub) to 48.61 mm2 mg-1 (Myosotis sylvatica,
Chapter 2 SLA along temperature gradient
25 perennial forb), displaying a median of 22.01 mm2 mg-1. The 5th and 95th percentiles of the overall distribution of our data showed that the SLA values of the most common species in the study area ranged from 12.16 to 36.4 mm2 mg-1. The community-weighted values of the investigated plots (Appendix 3) ranged from 11.15 (site 25, 2032 m a.s.l.) to 26.15 mm2 mg-1 (site 26, 960 m a.s.l.).
Variation of SLA with temperature among populations
The SLA values of five (Gentiana verna, Potentilla erecta, Ranunculus montanus, Thymus pulegiodes and Tofieldia calyculata) of the 28 investigated species were significantly correlated with MAT (see Table 2 for statistical test values). Four of these species showed significant positive correlations with MAT, whereas the SLA of Ranunculus montanus was negatively correlated with MAT. Trends were also detected in the relationship between SLA and MAT (p<0.1) for Galium anisophyllon and Phyteuma orbiculare.
Relationship between SLA and temperature at the species and community levels The low and non-significant K-value (K=0.15, p=0.31) calculated for the dataset including all single SLA values indicated that the variation of this trait is not phylogenetically constrained.
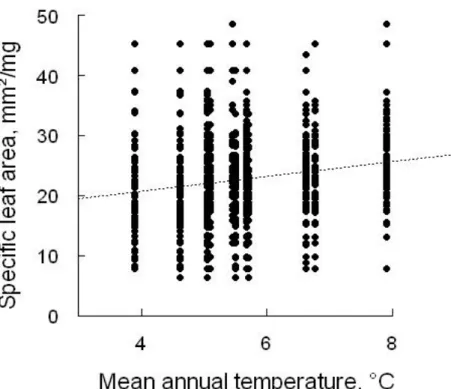
The results of the linear models associating species and community-weighted SLA values with MAT are presented in Figure 3 and 4. At the species level, we revealed a significant negative (though very weak) correlation between SLA and the mean annual temperature (r²=0.04, F=71.32, df=1522, p<0.001).
26 Additionally, a great deal of variation was observed among the SLA values obtained at each site (Figure 3). We also detected non-linear associations between MAT and community-weighted SLA values (r²=0.8, F=52.58, df=27, p<0.001).
Effect of environmental factors on community-weighted SLA values
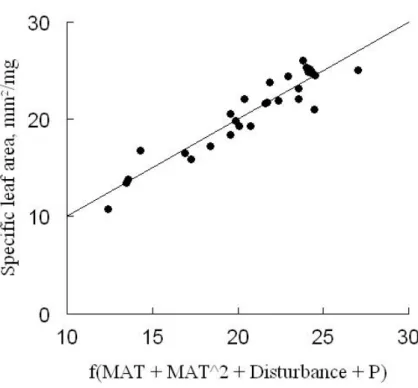
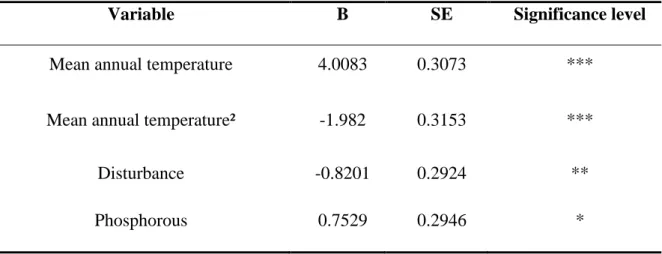
The minimal adequate model revealed that in addition to the mean annual temperature (with both linear and quadratic components included), the disturbance level and soil phosphorous content also had a significant effect on the community-weighted SLA values (r²=0.89, F=47.63, df=27, p<0.001, see model results in Table 3). The mean annual temperature explained 70.3% of the variation in SLA, while the disturbance level and soil phosphorous content explained 9.8 and 8.9%, respectively. Figure 5 graphically displays the fit of the model results.
27
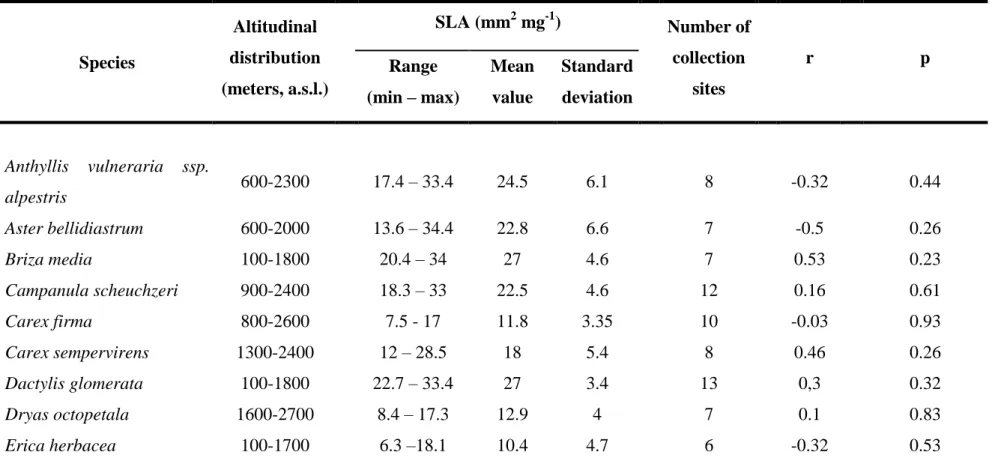
Table 2. Intraspecific variation in the SLA values of the 28 investigated species along the temperature gradient. The altitudinal distribution, SLA range, mean and standard deviation values and the number of sites are given for each species. The Pearson correlation coefficient, r, and its p values were obtained from linear models testing the relationship with temperature. Significant results are shown in bold.
Species
Altitudinal distribution (meters, a.s.l.)
SLA (mm2 mg-1)
Number of collection
sites
r p
Range (min – max)
Mean value
Standard deviation
Anthyllis vulneraria ssp.
alpestris 600-2300 17.4 – 33.4 24.5 6.1 8 -0.32 0.44
Aster bellidiastrum 600-2000 13.6 – 34.4 22.8 6.6 7 -0.5 0.26
Briza media 100-1800 20.4 – 34 27 4.6 7 0.53 0.23
Campanula scheuchzeri 900-2400 18.3 – 33 22.5 4.6 12 0.16 0.61
Carex firma 800-2600 7.5 - 17 11.8 3.35 10 -0.03 0.93
Carex sempervirens 1300-2400 12 – 28.5 18 5.4 8 0.46 0.26
Dactylis glomerata 100-1800 22.7 – 33.4 27 3.4 13 0,3 0.32
Dryas octopetala 1600-2700 8.4 – 17.3 12.9 4 7 0.1 0.83
Erica herbacea 100-1700 6.3 –18.1 10.4 4.7 6 -0.32 0.53
28
Table 2 continued
Species
Altitudinal distribution (meters, a.s.l.)
SLA (mm2 mg-1)
Number of collection
sites
r p
Range (min – max)
Mean value
Standard deviation
Galium anisophyllon 500-2500 20.8 – 25. 23 1.5 7 0,72 0.07
Gentiana clusii 400-2400 9.1 – 14.2 11.2 2.1 7 -0.12 0.79
Gentiana verna 400-2600 12.3 – 17.3 15.9 1.7 9 0.68 0.04
Globularia cordifolia 600-1800 6.9 – 18.5 12.5 4.3 6 0,39 0.45
Helianthemum
nummularium ssp.
grandiflorum
100-2400 13 – 19 15.9 2.6 7 -0.14 0.77
Hypericum maculatum 600-1800 22.6 – 37.2 29.8 5.4 7 0.48 0.28
Leontodon hispidus s.l. 100-2000 25.2 – 32.5 29.1 2.2 7 -0.49 0.27
Lotus alpinus 600-2000 16 – 28 22.9 3.7 12 -0.25 0.44
Phyteuma orbiculare 600-2200 18.6 – 25.8 21.7 2.6 6 -0.77 0.08
Pinguicula alpina 600-2400 27.6 – 37.4 32.6 3.9 6 -0.63 0.18
Potentilla erecta 100-2200 22.4 – 35 26.7 4.1 11 0.6 0.05
Ranunculus montanus 1500-2500 20.5 – 31 23.4 3.3 11 -0.86 < 0.001
29
Table 2 continued
Species
Altitudinal distribution (meters, a.s.l.)
SLA (mm2 mg-1)
Number of collection
sites
r p
Range (min – max)
Mean value
Standard deviation
Sesleria albicans 400-2600 16.4 – 23.1 19.6 2.3 11 -0.26 0.44
Soldanella alpina 1000-2900 9.7 – 12.6 11.2 1.2 8 0.46 0.25
Thymus pulegiodes 100-1800 18.2 – 28.2 23.1 3.8 7 0.78 0.04
Tofieldia calyculata 400-2100 13 – 20 15.9 2.9 6 0.82 0.05
Trifolium pratense 100-1800 19.4 – 28.1 23.9 2.9 8 0.08 0.86
30 Discussion
The obtained results show that specific leaf area is significantly related to temperature. However, the strength of this correlation varies considerably depending on the scale of investigation. Analysis of the variation in SLA with changing temperatures at the population level indicated that 18% (5 out of 28) of the investigated species tend to show differences in SLA values along the examined temperature gradient (Table 2). Significant changes in SLA values associated with temperature were detected for all species (except for Ranunuculus montanus). Although our sampling strategy did not allow us to distinguish between different phenotypes and genotypes, we suspect that the source of the intraspecific variability observed in our study is genotypic differentiation. All species for which intraspecific variability was detected show a high level of genetic variability: they either belong to taxonomically complex species with indistinct morphological differences among microspecies (e.g., Thymus pulegioides; Morales 2002), or they tend to present different ecotypes in contrasting ecological conditions (e.g., Potentilla erecta; Richards 1973; Watson
& Fyfe 1975; Leht & Paal 1998).
31
Figure 3. Correlation between SLA values and the mean annual temperature at the species level
(r²=0.04, F=71.32, df=1522, p<0.001).
Figure 4. Correlation between SLA values and the mean annual temperature at the community level (including SLA values weighted
with the abundances of the species in the community) (r² = 0.8, F=52.58, df=27, p<0.001).