Research Collection
Master Thesis
Modeling of Exercise Induced Effects on Blood Glucose Dynamics in T1DM Patients
Author(s):
Schneider, Kevin Publication Date:
2020-06
Permanent Link:
https://doi.org/10.3929/ethz-b-000471912
Rights / License:
In Copyright - Non-Commercial Use Permitted
This page was generated automatically upon download from the ETH Zurich Research Collection. For more information please consult the Terms of use.
ETH Library
Master’s Thesis
Modeling of Exercise Induced Effects on Blood Glucose Dynamics in T1DM Patients
Author
Kevin Schneider
Date
2020-06
Supervisor 1
Dr. Eng. Marcela Moscoso-Vasquez
Centros de Sistemas y Control Instituto Tecnológico de Buenos Aires (ITBA)
Supervisor 2
Prof. Dr. Ricardo S. Sánchez Peña
Centros de Sistemas y Control Instituto Tecnológico de Buenos Aires (ITBA)
Supervisor 3
Prof. Dr. Roy Smith
Automatic Control Laboratory
Swiss Federal Institute of Technology Zurich (ETH)
ii
Declaration of originality
The ig ed decla a i f igi ali i a c e f e e e e e a e , Bachel he i , Ma e he i a d a he deg ee a e de ake d i g he c e f die , i cl di g he respective electronic versions.
Lecturers may also require a declaration of originality for other written papers compiled for their courses.
__________________________________________________________________________
I hereby confirm that I am the sole author of the written work here enclosed and that I have compiled it in my own words. Parts excepted are corrections of form and content by the supervisor.
Title of work (in block letters):
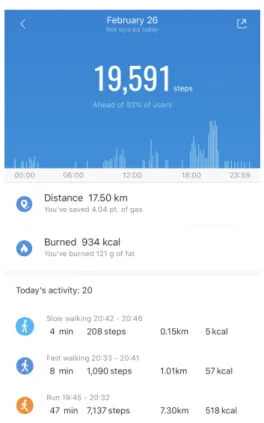
Authored by (in block letters):
For papers written by groups the names of all authors are required.
Name(s): First name(s):
With my signature I confirm that
I ha e c i ed e f he f f lagia i de c ibed i he Citation etiquette i f a i sheet.
I have documented all methods, data and processes truthfully.
I have not manipulated any data.
I have mentioned all persons who were significant facilitators of the work.
I am aware that the work may be screened electronically for plagiarism.
Place, date Signature(s)
For papers written by groups the names of all authors are required. Their signatures collectively guarantee the entire content of the written paper.
Modeling of Exercise Induced Effects on Blood Glucose Dynamics in T1DM Patients
Schneider Kevin Patrick
Zürich, 26th of June 2020
iv
Abstract
Keeping Blood Glucose (BG) concentrations in a healthy range is despite long on- going research a difficult task in individuals suffering from Type 1 Diabetes Mellitus (T1DM). Especially, the effects that physical activity imposes on the BG dynamics are still one of the major challenges. While first attempts have been made to model the effects of aerobic exercise on BG. No one has yet focused on the anaerobic exercise and its unique impact on glycemic control. Although anaerobic activity is common in the general population, mostly in form of resistance exercise, and is seen to improve glycemic control, no one yet has focused on modeling its unique impact on glycemic levels. Together with the recent development of wrist-worn fit- ness trackers, it has become easier than ever to classify exercise type, intensity, and duration non accurately and non-invasively.
Thus, this project focuses on learning models from data obtained by fitness trackers to classify exercise accurately. This is done by fusing Heart Rate (HR) data with motion data. Additionally, a stand-alone exercise model is proposed capable of cap- turing aerobic and anaerobic activity. The performance of this model is validated with HR data during different exercise types.
The exercise model is built in a LPV-like manner and can thus be used for direct controller design or to enhance Virtual Patient Population (VPP) simulators such as the famous FDA approved UVa-Padova simulator.
Lastly, the proposed exercise model is used as an extension to the well known Bergman Minimal Model and evaluated on in-silico data. It is seen to capture the opposing effects of aerobic and anaerobic exercise as widely mentioned in the literature. Thus it lays pioneering work in the field of capturing anaerobic effects.
Nevertheless, the group is further working on validating the model’s performance within-vivo data obtained from a specifically designed clinical trial.
v
vi
Acknowledgment
I would like to express my sincere gratitude to my direct supervisors Dr. Marcela Moscoso-Vásquez and Prof. Dr. Ricardo Sánchez-Peña, for their warm welcome at ITBA in Buenos Aires and for letting me be part of this high impact project.
This project would not have been possible if not for their valuable guidance and constructive advice throughout the entire time.
Additionally, all the people from the office had been very helpful and understand- ing with my little knowledge of Spanish. They all gave great recommendations for making the most of my time in the lovely capital of Argentina.
Due to the outbreak of the pandemic in March 2020, I returned home prematurely.
Thanks to the ongoing advice through virtual meetings and the exchange of several emails I was gratefully able to continue the work from distance.
Lastly, I would like to thank Prof. Dr. Roy Smith who allowed me to conduct my thesis abroad by agreeing to supervise me from the ETH side.
It had been an enriching experience for me with many lessons learned. Being part of their team far away from home, with the ambitious goal to develop a fully autonomous AP-system has been a wonderful experience I will never forget. I am truly thankful for everybody who helped me a pursuing this dream of mine.
Kevin Schneider, June 2020
vii
viii
Contents
List of Figures x
List of Tables xi
Abbreviations xiii
1 Introduction 2
1.1 The Artificial Pancreas . . . 4
1.2 Motivation . . . 6
2 Background and Recent Work 9 2.1 Physiological Effects of Exercise . . . 9
2.1.1 Insulin Independent Glucose Uptake . . . 13
2.1.2 Endogenous Glucose Production . . . 13
2.1.3 Insulin Sensitivity . . . 14
2.1.4 Catecholamine . . . 14
2.1.5 Effects of Physical Exercise on Blood Glucose in T1DM . . . 14
2.2 Exercise Detection . . . 16
2.2.1 Energy Expenditure (EE) . . . 16
2.2.2 Percent of Maximal Oxygen Uptake (%VO2max) . . . 16
2.2.3 Metabolic Equivalent of Task (MET) . . . 17
2.2.4 Rating of Perceived Exertion (RPE) . . . 17
2.2.5 Heart Rate (HR) . . . 18
2.2.6 Percent Active Muscle Mass (PAMM) . . . 19
2.2.7 Respiratory Rate (RR) . . . 19
2.2.8 Blood Lactate Concentration . . . 20
2.2.9 Movement Data . . . 20
2.2.10 Additional Physical Activity (PA) Information . . . 20
2.2.11 Exercise Detection Summary . . . 20
2.3 Exercise Models . . . 22
2.3.1 Bergman’s Minimal Model . . . 22
2.3.2 Lenart and Parker’s Exercise Model . . . 22
2.3.3 Roy and Parker’s Exercise Model . . . 23
2.3.4 Hernández-Ordoñez’s Exercise Model . . . 24 ix
x CONTENTS
2.3.5 Breton’s Minimal Model Exercise Extension . . . 25
2.3.6 Breton’s Extension to UVa Padova Simulator . . . 26
2.3.7 García-Tirado’s Exercise Uncertainty . . . 27
2.3.8 OHSU Simulator with Hernández-Ordoñez Model . . . 28
2.3.9 Rashid’s Simulator . . . 29
2.3.10 Exercise Models Summary . . . 30
3 Data Collection 31 3.1 Clinical Trial . . . 31
3.2 Collecting Exercise Data . . . 33
3.2.1 Wrist Worn Fitness Tracker . . . 34
3.2.2 HR monitor . . . 36
4 Exercise Detection 37 4.1 Data Preprocessing . . . 38
4.2 Logistic Regression Model . . . 39
4.2.1 Results . . . 41
4.3 K-Nearest Neigbors . . . 43
5 Exercise Extension to Minimal Model 45 5.1 Aerobic and Anaerobic Classification . . . 46
5.1.1 Aerobic States . . . 47
5.1.2 Anaerobic States . . . 48
5.1.3 Validation . . . 51
5.2 Extension to Minimal Model . . . 52
5.2.1 Identification with Clinical Data . . . 53
5.2.2 In-SilicoValidation . . . 56
6 Conclusion 61 6.1 Exercise Classification . . . 61
6.2 Aerobic and Anaerobic Exercise Modelling . . . 62
Bibliography 65
List of Figures
1.1 Glucose Profile of Healthy and T1DM Subjects . . . 3
1.2 Signal Flow of an AP-System . . . 4
1.3 From Identification to Controller Design . . . 8
2.1 Energy Sources over Time during Exercise . . . 10
2.2 BG Response to Aerobic and Resistant Exercise . . . 15
2.3 BG Response to Exercise UVa Padova . . . 28
2.4 BG Response to Exercise OHSU . . . 29
3.1 Mi-Fit App Screenshot . . . 35
4.1 PA Labels based on Raw HR and Step Data . . . 39
4.2 Mi Band 4 Data with FP and FN . . . 40
5.1 Raw HR Data for Aerobic and Anaerobic Exercise . . . 46
5.2 Qualitative Schematic of Aerobic and Anaerobic States . . . 47
5.3 Thresholding Performance for Anaerobic Exercise Detection . . . 50
5.4 Running Sessions with Identified Parameters . . . 51
5.5 Gym Sessions with Identified Parameters . . . 52
5.6 Seven Non-Exercising Data Sets . . . 54
5.7 Exercise Extension vs Nominal Model Performance . . . 56
5.8 Identification of Bergman Model Parameters against OHSU simulator 57 5.9 Exercise States Response to different PA . . . 58
5.10 Aerobic/Anaerobic Extension vs Existing Exercise Models . . . 59
xi
List of Tables
2.1 Bloodflow Rates in Different Tissues . . . 12
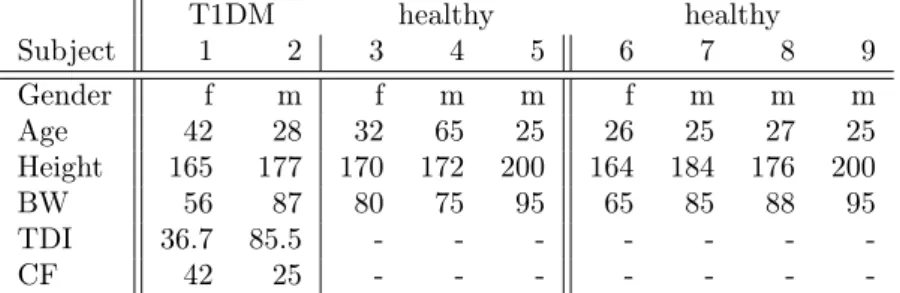
3.1 Demographic Information of Volunteers . . . 33
3.2 Exercise Intensities by Xiaomi . . . 35
4.1 Training vs. Validation Accuracy . . . 41
4.2 Logistic Regression Prediction Performance . . . 42
4.3 Logistic Regression Weights and Features . . . 42
5.1 Bergman Minimal Model Parameters . . . 55
xii
Abbreviations
SI Insulin Sensitivity.
HRb Basal Heart Rate.
HRmax Maximal Heart Rate.
VO2max Maximal Oxygen Uptake.
ANMAT Administración Nacional de Medicamentos, Al- imentos y Tecnología Médica.
AP Artificial Pancreas.
ARMAX Autoregressive Moving Average with Exogenous Inputs.
ARX Autoregressive with Exogenous Inputs.
ATP Adenosine Triphosphate.
BG Blood Glucose.
BW Body Weight.
CGM Continuous Glucose Measurement.
CHO Carbohydrates.
CP Creatine Phosphate.
CSII Continuous Subcutaneous Insulin Infusion.
CSTS Cross Sectional Time Series.
EE Energy Expenditure.
EGP Endogenous Glucose Production.
FDA Food and Drug Administration.
FN False Negatives.
FP False Positives.
GIR Glucose Infusion Rate.
HGP Hepatic Glucose Production.
xiii
Abbreviations 1
HR Heart Rate.
HRR Heart Rate Reserve.
IMUs Inertial Measurements Units.
IVGTT Intravenous Glucose Tolerance Test.
LPV Linear Parameter Varying.
MA Moving Average.
MET Metabolic Equivalent of Task.
OHSU Oregon Health and Science University.
PA Physical Activity.
PAMM Percent Active Muscle Mass.
PCA Principal Components Analysis.
PGU Peripheral Glucose Uptake.
PIU Peripheral Insuiln Uptake.
PPG Photoplethysmogram.
Ra rate of appearance.
Rd rate of disappearance.
RPE Rating of Perceived Exertion.
RR Respiratory Rate.
RSA Respiratory Sinus Arrhythmia.
T1DM Type 1 Diabetes Mellitus.
TDI Total Daily Insulin.
TEE Total Energy Expenditure.
UVa University of Virginia.
VPP Virtual Patient Population.
Chapter 1
Introduction
According to Statista [1], there were more than 463 million people diagnosed with Diabetes in 2019. Out of these, it is estimated that between 5-15% suffer from Type 1 Diabetes Mellitus (T1DM) [2]. In 2019, a total of 672 billion dollars were spent globally on the treatment of diabetes. Nevertheless, in the same year, nearly 2 million people died worldwide before the age of 60 due to diabetes-related diseases according to the WHO [3].
The number of people suffering globally from diabetes is expected to rise to about 700 million people by 2045. While the rising number of patients living with Type 2 diabetes can be explained by increasing levels of sedentary lifestyles, unhealthy diets, and obesity, T1DM is likewise rising for up to now unclear reasons.
Whereas Type 2 Diabetes can easily be prevented through a healthy lifestyle, T1DM is an autoimmune disease and cannot be prevented in the same way. T1DM results from the autoimmune destruction of the insulin-producing pancreaticβ-cells.
Therefore, T1DM patients can produce little to no insulin. Insulin and its antago- nist glucagon are both protein hormones relevant in regulating blood glucose Blood Glucose (BG) levels.
The secretion of insulin enhances the absorption of Carbohydrates (CHO) from the blood into the liver and inhibits glucose production, thereby lowering the BG levels.
The secretion of glucagon on the other hand stimulates glucose production, leading to rising BG concentrations.
The absence of insulin results in constantly high BG-levels in T1DM patients, so- called hyperglycemia. Chronic hyperglycemia can lead to cardiovascular diseases, nephropathy, retinopathy leading to blindness, and neuropathy in the long run [4].
Since insulin analogs can be produced synthetically, treating T1DM subjects with it through subcutaneous infusion will result in better glycemic control. However, keeping the BG-levels in the normal range, so-called euglycemia is not an easy task.
The euglycemic range for individuals suffering from diabetes is usually defined as 70-180 mg of glucose per deciliter of blood.
Injecting too much insulin will lead to an undesired state of low BG, so-called hy- 2
CHAPTER 1. INTRODUCTION 3
poglycemia. Severe hypoglycemia can lead to loss of consciousness, seizures, and even death [2].
To reduce the risk of hypo- and hyperglycemia, treatments typically require mea- surement of blood glucose combined with insulin injections and CHO ingestion at regular intervals. This imposes a heavy burden on T1DM-subjects and reduces their life quality significantly. Moreover, maintaining euglycemia is extremely diffi- cult this way.
With the development of insulin pump technology in late 1970s, Continuous Sub- cutaneous Insulin Infusion (CSII) became possible. CSII allows delivery of not only boluses of insulin at discrete instances of time as it was done before these devices were available, but also for continuous basal infusion. This feature greatly reduces the risk of severe hypoglycemia by up to threefold [5].
In the early 2000s, Continuous Glucose Measurement (CGM) devices appeared on the market which cleared the path towards more automated systems. Instead of measuring the BG levels manually with a finger stick glucose meter, glucose could now be measured up to every 5 minutes subcutaneously [6]. This led to the de- velopment of half automated systems, with patients only having to calculate the correct dose of insulin depending on their glucose reading and estimated meal size.
However, it is not that simple. While it is true that the bolus of insulin heavily depends on CHO consumption, there are many more factors in play. For example, the exercise amount, the personal stress level, and the meal composition are influ- encing glucose dynamics greatly.
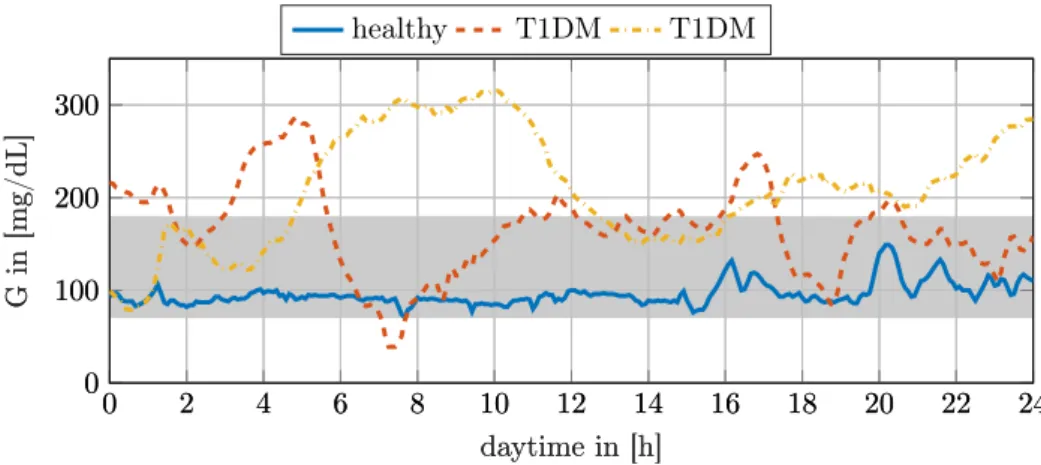
Considering that CHO counting is heavily error-prone it becomes apparent that keeping euglycemia is not an easy task to solve [2]. Figure 1.1 shows the glucose profiles of a healthy- and two T1DM-subjects, both using CSII to control their BG- level. Hence, presenting the difficulty of keeping blood sugars in the healthy range.
healthy T1DM T1DM
0 2 4 6 8 10 12 14 16 18 20 22 24
0 100 200 300
daytime in [h]
Gin[mg/dL]
0 2 4 6 8 10 12 14 16 18 20 22 24
0 100 200 300
daytime in [h]
Gin[mg/dL]
Figure 1.1: Three different glucose profiles over the course of a day. The raw data from the CGM is shown here. The continuous line shows a healthy individual while the other two dashed lines correspond to two T1DM subjects using a CSII pump.
The gray background indicates the euglycemic range commonly defined for T1DM.
4 CHAPTER 1. INTRODUCTION
Finally, through the ability to collect continuous subcutaneous glucose data and the aim to increase a patient’s quality of life it comes by no surprise that closed-loop glucose control, so-called Artificial Pancreas systems became a significant focus of research.
1.1 The Artificial Pancreas
The Artificial Pancreas (AP) is a system that automates insulin delivery, trying to imitate the natural pancreas through control engineering techniques. In its minimal configuration, it consists of a control algorithm, an insulin pump, and a CGM sensor.
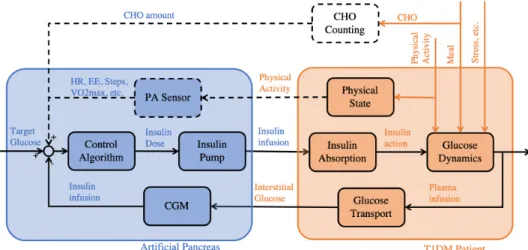
Figure 1.2 shows the interaction between the Artificial Pancreas and a patient schematically. The input to the controller is a target BG-value. The controller uses the current glucose concentration in the subcutaneous tissue measured by the CGM as feedback to compute the optimal insulin infusion rate.
While several disturbances act on the nonlinear glucose-insulin dynamics some can be estimated and used as additional inputs to the control algorithm. For example, the CHO amount or the activity level can be estimated by counting carbs or mea- suring activity related physiological variables such as Heart Rate (HR) as shown by the dashed lines in Figure 1.2.
Furthermore, the nonlinear glucose dynamics are influenced by the delayed insulin absorption into the bloodstream. This is due to the insulin pump infusing the op- timal insulin dose computed by the algorithm into the subcutaneous tissue rather than directly into the bloodstream.
The feedback loop to the controller is closed by obtaining the subcutaneous glucose concentration with the CGM. This again introduces another delay as the plasma glucose level needs to diffuse to the tissue.
Figure 1.2: The Signal Flow of an extended AP system. The blue part shows the AP system while the orange part indicates the patient. Some lines are showed as dashed as they are not necessarily required.
CHAPTER 1. INTRODUCTION 5
After all, the mentioned effects make glucose prediction and control difficult.
The following section elaborates on the most important challenges for accurate BG control.
• Great Variability of Glucose Dynamics
While the biological system itself is characterized by nonlinear dynamics that are difficult to model, there is also great variability in the dynamics [7]. These can be subdivided into variations within a patient (intra-patient variability) and variations between different patients (inter-patient variability).
– Intra-Patient Variability
It is widely accepted that postprandial glycemic response is time-varying within a patient. Additionally, it seems that stress, sickness, menstrual cycles, and in general circadian variations have significant effects on In- sulin Sensitivity (SI) and hence subcutaneous insulin absorption. Thus,d causing variability in the insulin glucose dynamics [2, 8–12].
– Inter-Patient Variability
Likewise, different patients react differently to CHO intake or insulin boluses. Due to the general impairment to maintain normal glycemia and frequent hyperglycemia, T1DM patients are generally less sensitive to insulin [13] and there is a greater range inSI as compared with healthy individuals. This increases the difficulty of developing a general model .
• Serious Delays
– Subcutaneous Insulin Delivery
While subcutaneous insulin pumps are minimally invasive implants and therefore do not interfere in everyday life, they are not ideal when it comes to absorption time. The time for insulin analogs to diffuse through the subcutaneous tissue to its peak appearance in the plasma is between 50 to 90 minutes for rapid-acting insulin analogs [2, 14].
– Subcutaneous Glucose Measurement
The same holds for CGM devices. Their minimal invasive application just below the skin leads to 10 to 15 minutes of time-lag between the reading and the actual BG-level [2].
• Disturbances
There are many disturbances at play that lead to higher variability of the system’s dynamics. However, the most important ones are the meal intakes and exercise:
– Meal intake
As stated above, counting carbohydrates is crucial for precise glycemic control. However, it is heavily error-prone and the meal’s absorption rate into the bloodstream depends on its composition. Generally, a lower absorption rate is seen in meals with higher fat components [15].
6 CHAPTER 1. INTRODUCTION
– Physical Activity
PA is known to have significant immediate effects on BG. Additionally, it has long term effects on Insulin Sensitivity up to 48 hours after exercise.
During light activity and aerobic exercise blood glucose drops immedi- ately after the onset. In contrast, anaerobic exercise is known to cause glucose levels to rise. This makes accurate exercise classification crucial for precise control [16–18].
Despite all challenges, the first hybrid AP was approved by the Food and Drug Ad- ministration (FDA) in 2016. Hybrid design means it requires keeping track of CHO intake and exercise bouts. The so-called MiniMed 670G from Medtronic (Dublin, Ireland) suffers from a low time in normal glycemia range compared to other pro- posed systems, despite being hybrid. On average, patients are about 65% of the time between 70 and 180 mg Glucose per dL of blood [19, 20].
Another hybrid AP based on Tandem Diabetes Care (San Diego, USA) Control- IQ technology got approved in 2019. Brown et al. [21] has found 2.6 hours daily increase in the target range. Likewise, another study [22] states about 66% of time- in-range compared to about 54% when controlled with a sensor-augmented pump.
Although, both systems remarkably increase life quality and finally paved the way to partially automated systems, the time in target range is still something to be improved upon. Besides, both commercially available systems depend on a patient’s intervention and are far from being fully autonomous solutions. Both lack sensing of PA. Thus, one still needs to announce exercise for them to perform appropriately [20–22].
Yet, recently algorithms have been proposed that do not require a patient’s exercise input [19, 23, 24]. Garcia-Triado et al. found good in-silico performance and are currently awaiting clinical trial approval [19]. Fabris et al. [25] showed good perfor- mance of a smart insulin bolus calculator that adapts the infusion rate depending on the currentSI. In a clinical trial, this method reduced postprandial hypoglycemia following exercise significantly.
Furthermore, Castle et al. [26] have already proven better glucose control in a clinical trial with their automated exercise detection compared to non-exercise in- formed algorithms. A recent reference on different solutions around the world can be found in Chapter 10 of Sánchez-Peña and Cherñavvsky (eds), Artificial Pancreas, Academic Press, 2019 [27].
1.2 Motivation
As seen in the previous section a great effort has already been made within the last decades to automate insulin injection. However, even the most advanced systems on the market do not perform as desired.
In recent years exercise-informed AP systems became an active field of research.
CHAPTER 1. INTRODUCTION 7
As shortly mentioned in the previous section exercise has a significant impact on glucose-insulin dynamics.
Several studies [19, 23, 24, 26, 28–32] have concluded, that using PA variables as input to the AP greatly facilitates control and improves time spent in euglycemia.
Some research aims towards the development of complex simulation models trying to capture all exercise effects on glucose dynamics accurately based on first princi- ples [33, 34]. Others try to use a more data-oriented approach [23, 35]. Working on controller design, most focus on developing advanced controllers that use the exercise information to adjust basal insulin without specifically modeling its effects [30, 36]. Others use activity variables to create a model-based prediction and thus improving controller performance [19, 32, 37].
Yet, none of the existing complex simulation models can capture all the exercise- induced effects. Additionally, having a simple linear control-oriented model able to capture the time-varying dynamics is of great value. With such a model, one can make statements about stability and robustness using control theory. Additionally, finding the metabolic parameters of a complex time-varying model is intractable.
Thus, there is a great need for breaking down the model’s high order of complexity [38].
Thus, the initial goal of this thesis was to develop a simple control-oriented model able to predict the effects of exercise on glucose dynamics. Therefore input- output data from a clinical trial should have been used to identify a black-box model and using approaches such as Autoregressive with Exogenous Inputs (ARX) and Autoregressive Moving Average with Exogenous Inputs (ARMAX).
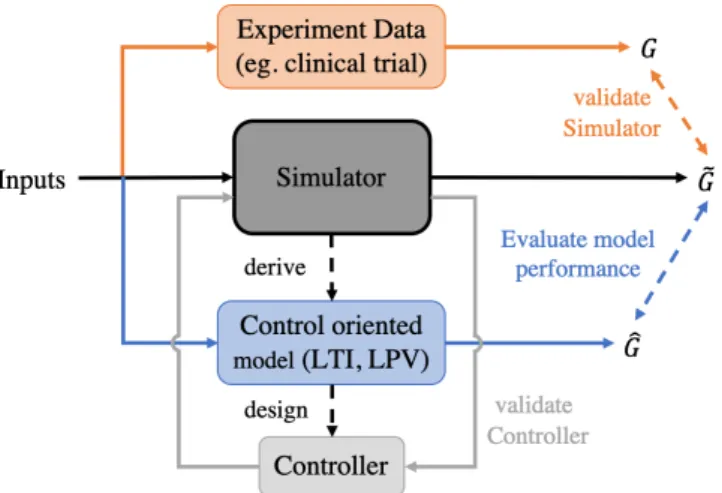
By changing its representation to a Linear Parameter Varying (LPV) model, one could then be able to personalize it to individual subjects. The control-oriented model could then be used for controller design. A schematic of this workflow is shown in Figure 1.3.
As it becomes apparent, obtaining physical exercise variables and glucose mea- surements through a clinical trial is a prerequisite to achieving the goal of this thesis.
Unfortunately, the clinical trial, initially scheduled to take place in Hospital Garra- han (Buenos Aires, Argentina) at the end of 2019, has been pending to get approved by the Administración Nacional de Medicamentos, Alimentos y Tecnología Médica (ANMAT). ANMAT is the Argentinian version of the USA’s FDA.
Adapting the clinical protocol allowed rescheduling the trial to the beginning of April. One shouldn’t be lucky. With the outbreak of COVID-19 and the resulting global pandemic, all of Argentina was in lockdown from 21st of march. Thus, van- ishing the hopes of conducting a clinical trial before the deadline of this project.
Having the above in mind, this thesis is set to focus rather on an extensive literature review. This goal of this review is to state the different possibilities of
8 CHAPTER 1. INTRODUCTION
Figure 1.3: Overall concept that leads to controller design. First of all, a complex simulation model is created, secondly, it is validated through clinical data. Af- terwards, the control-oriented model is derived from the simulation and finally, a controller is designed based on it.
obtaining physiological variables and their practicality for tracking exercise intensity accurately. Furthermore, machine learning methods are utilized to predict exercise intensity based on activity related variables obtained from wearable fitness trackers.
Likewise, the physiological effects of PA at different intensities on the metabolism are reviewed to fully capture all effects on glucose dynamics. Lastly, HR data of healthy individuals during exercise is used to propose a PA extension, able to extend existing glucose-insulin models and thus capturing the unique and distinctive effects of aerobic and anaerobic exercise.
Chapter 2
Background and Recent Work
Two main parts can be differentiated when it comes to modeling the induced effects of PA on glycemic response.
Firstly, the correct detection of exercise, together with its intensity, duration, and type. Secondly, the modeling of the exercise-induced effects on BG, which is de- pending on the latter.
Therefore, before digging deeper into the modeling, one has to understand the un- derlying physiological effects that arise from activity.
2.1 Physiological Effects of Exercise
The fundamental biological processes that take part in the body during greater en- ergy demand are highly complex and still not all factors are completely understood.
Several recent studies [39–46], involving clinical trials, focused on understanding what effect exercising has on glucose dynamics. The results are not consistent.
Generally, exercising at low to medium intensity is associated with dropping BG levels. However, these levels are often seen to rise if the workload is anaerobic [39, 40, 44]. This suggests, that it is not entirely understood how the metabolism changes due to different intensities and how it influences the BG-concentration.
This section tries to summarize the body’s used pathways to deliver energy at dif- ferent intensities. Additionally, several physiological effects and their influence on BG-concentration during exercise will be elaborated on.
In short, the variation in BG-concentration depends on the mass balance be- tween the rate of appearance (Ra) and rate of disappearance (Rd) of glucose from the bloodstream [41]. However, BG is not the only energy source during exercise.
The metabolic pathways used to provide the increased energy demand differs by exercise types (e.g. running, cycling), intensities (aerobic, anaerobic, mixed), and duration. Varying these parameters have significantly different short- and long-term effects on BG-levels [17, 47].
The CHO and fats ingested through meals cannot be used directly to generate the 9
10 CHAPTER 2. BACKGROUND AND RECENT WORK
bodies required energy. CHO is broken down into smaller sugars (glucose, fructose, etc.) to be used as energy in immediate tasks. Likewise, fats are broken down into free-floating fatty acids in the bloodstream. Both are then converted into Adenosine Triphosphate (ATP), which is the molecule that together with water releases free energy through the working muscles [48].
While fatty acids can only be converted aerobically (with oxygen), glycogen can also be converted anaerobically (without oxygen) to ATP. Thereby lactic acid is created as a byproduct.
Unused BG is stored as glycogen in limited reservoirs of liver and muscle cells. If these reservoirs are full, glucose and fatty acids are converted to triglycerides in adipose tissue (body fat) [48].
As seen in Figure 2.1, at the onset of activity the small reservoirs of ATP and Cre- atine Phosphate (CP) (reacts rapidly to ATP without oxygen) are used to provide the necessary energy. These stores are depleted within seconds. As oxygen uptake increases gradually, a purely aerobic reaction at the beginning of exercise is not pos- sible, and glucose is thus used anaerobically to form ATP and lactic acid (anaerobic glycolysis) [49, 50].
After several minutes of exercise, oxygen uptake is in steady-state. Depending on the exercise intensity and the amount of CHO ingested prior to exercise several scenarios with different metabolic pathways are possible (aerobic and anaerobic glycolysis in muscle and liver). After long exercise, the glycogen stores are depleted and lipids are mainly fueling the body (aerobic lipolysis) (Figure 2.1).
𝑒𝑛𝑒𝑟𝑔𝑦 𝑠𝑜𝑟𝑐𝑒𝑠 [%]
𝐴𝑇𝑃 𝐶𝑃
𝑎𝑛𝑎𝑒𝑟𝑜𝑏𝑖𝑐 𝑔𝑙𝑦𝑐𝑜𝑙𝑦𝑠𝑖𝑠
𝑎𝑒𝑟𝑜𝑏𝑖𝑐 𝑔𝑙𝑦𝑐𝑜𝑙𝑦𝑠𝑖𝑠 𝑖𝑛 𝑚𝑢𝑠𝑐𝑙𝑒
𝑎𝑒𝑟𝑜𝑏𝑖𝑐 𝑔𝑙𝑦𝑐𝑜𝑙𝑦𝑠𝑖𝑠
𝑖𝑛 𝑙𝑖𝑣𝑒𝑟 𝑎𝑒𝑟𝑜𝑏𝑖𝑐 𝑙𝑖𝑝𝑜𝑙𝑦𝑠𝑖𝑠 100
50
0
10 100 1
0.1 𝑡 [𝑚𝑖𝑛]
Figure 2.1: Qualitative contribution of different energy sources during exercise over a logarithmic time scale [50].
Exercise intensity is usually measured as a percentage of Maximal Oxygen Up- take (VO2max), which is defined as the maximal volume of oxygen a body can utilize per minute:
• Resting State (∼8% of VO2max)
At rest, an untrained human consumes about 8% of their maximal oxygen uptake [51]. More aerobically-trained individuals have a higher VO2max, thus
CHAPTER 2. BACKGROUND AND RECENT WORK 11
they relatively consume less while expending the same amount of energy at rest. The Heart Rate at rest is referred to as the basal HR (
glsHRb). It corresponds to about 50-70 beatsmin−1 depending on the age and training state.
• Low Exercise Intensity(∼25% of VO2max)
This intensity corresponds to walking and predominantly takes its energy from fat oxidation in the fasted state. Hereby about 85% of the fatty acids are derived from the plasma. Relatively more CHO is used in the unfasted state [48]. Low-intensity exercise is considered to increase HR to about 50-70% of Maximal Heart Rate (HRmax).
• Aerobic Threshold
The aerobic threshold is the limit to where energy is purely delivered aerobi- cally. It is defined as a maximal lactic acid concentration of 2mmol L−1in the blood [52]. This threshold varies widely in each individual and moves closer to the VO2max and the anaerobic threshold with a better training state. Above this limit, some energy is produced through anaerobic glycolysis which leads to increasing lactic acid levels [53]. Besides, it has been shown that exercis- ing at the aerobic threshold corresponds well to the maximal fat utilization rate [54].
• Moderate Exercise Intensity (∼60% of VO2max)
With intensity increasing to about 60% around 50/50 come from intramuscu- lar triglycerides and fatty acids in the plasma. In most untrained individuals this corresponds approximately to the aerobic threshold. Fat oxidation is at its highest level, but it cannot deliver all the energy needed to sustain the exertion. Since oxidation of glucose requires less oxygen and is two times quicker than fat oxidation, CHO becomes the preferred fuel from this point on [48].
Generally the longer the exercise lasts the higher the fats energy contribution due to glycogen depletion. In the fasted state this eventually leads to lower performance because the rate of fat oxidation can not meet the energy de- mand.
However, in the non-fasted state blood, glucose from food intake can be uti- lized. Therefore, CHO oxidation is further elevated which increases perfor- mance that can be sustained for longer [48]. This intensity correlates to a HR of about70−80%HRmax [55].
• Anaerobic Threshold/ Lactate Threshold
The anaerobic threshold is defined as the limit to where the rate of lactate disappearance is approximately equal to lactate appearance. It is defined as the crossing of 4 mmol lactic acids per liter of blood [52]. Above this limit, more lactate is produced through fast anaerobic glycolysis than is converted back to glucose through the liver. For untrained individuals, this threshold
12 CHAPTER 2. BACKGROUND AND RECENT WORK
lies somewhere between 50-60% VO2maxwhereas it is around 75% for athletes [56, 57]. This refers to about 85% of HRmax, however, it is highly varying in individuals as well.
Interestingly, even when keeping the exercise intensity constant, VO2 con- sumption and HR continuously increases above this point of exertion and never reaches steady-state [58].
• Vigorous Exercise Intensity (>85% of VO2max)
At 85% VO2max oxygen is slowly becoming scarce. While CHO is the major fuel most of the energy is delivered through anaerobic glycolysis which is a, around 100 times, faster process. Fat oxidation thereby decreases below mod- erate intensity levels.
This intensity is far above the anaerobic threshold leading to the vast accu- mulation of lactic acid and eventually to fatigue [48].
The following paragraphs summarize the widely agreed-upon biological body adap- tions in response to exercise:
Increased Blood Circulation and Respiration Rate
When exercising, the respiration rate is increased and the heartbeat accelerated to boost the capillary blood flow [47]. The overall blood circulation can thereby be increased by three- to fourfold compared to the resting state.
As the brain’s energy consumption stays constant so does its blood flow [59]. How- ever, the peripheral tissue, primarily the working muscles experience an almost linear increase of blood flow with respect to exercise intensity since increased blood flow provides greater oxygen and glucose availability. At maximal exertion blood flow to the muscles can be up to 20 fold. Similarly, liver, gut and kidneys are less supplied by blood [47, 49]. Table 2.1 shows the increased blood flow rates with respect to different tissue groups.
Tissue Group %V O2max
8% 30% 60% 90%
Brain (qB) 5.9 5.9 5.9 5.9
Heart/Lungs (qH) 43.7 74.2 115.4 158.2
Gut (qG) 12.6 9.8 6.1 2.3
Liver (qL) 12.6 9.8 6.1 2.3
Kidneys (qK) 10.1 8.1 5.3 2.5
Periphery (qP) 15.1 50.6 99.1 147.5 (muscle and adipose tissue)
Table 2.1: Bloodflow rates indL min−1 to different tissues as a function of relative exercise intensity [49, 59]. Functions qX are fitted second order polynomials for each group mapping %VO2max to blood flow.
At the onset of exercise, the respiratory system takes about 2-4 minutes to adapt to the increased oxygen demand until it reaches a steady-state. During this time the
CHAPTER 2. BACKGROUND AND RECENT WORK 13
body experiences a so-calledO2-deficit which leads to some anaerobically produced energy [50, 59].
As a side effect, insulin absorption from tissue to plasma is accelerated through higher blood circulation [17, 59].
2.1.1 Insulin Independent Glucose Uptake
The body’s increased energy demand during exercise leads to increased BG-uptake and disposal from the working muscles, which is independent of insulin. Increased glucose uptake is only active during exercise and increases linearly with the exercise intensity [47]. The increase can be anywhere between 1.5 to 10 times the amount of the resting state [16]. Other sources state it can increase by up to 50 times [17].
The release of growth hormones during exercise is assumed to inhibit glucose uptake [39, 44]. Training leads to an overall increased glucose uptake due to the increase of muscle mass and greater energy expenditure at the same level of exertion.
2.1.2 Endogenous Glucose Production
Endogenous Glucose Production (EGP) rates are increasing during exercise due to increased glucose demands. The additional glucose availability results from in- creased gluconeogenesis and glycogenolysis.
• gluconeogenesis
The formation of glucose using protein’s amino acids and fat’s glycerol. These processes happen predominantly in the liver and kidney.
• glycogenolysis
The breakdown of glycogen to glucose, where glycogen serves as energy stor- age. This mainly happens in liver and muscle cells. Glycogenolysis is pro- moted by glucagon, however high levels of insulin make glucagon less effective.
A study in healthy individuals showed that a 60-minute moderate-intensity exercise bout increased EGP by a factor of eight. This is promoted by doubling the plasma glucagon concentrations [47]. During mild exercise, gluconeogenesis is the main en- ergy source. With increasing intensity glycogenolysis is getting prevalent, however, since the glycogen storage is limited to approximately 100g in the liver and 500g in the muscles it is depleted within 1-2 hours of moderate exercise. Meaning the body has to recourse to gluconeogenesis if exercise is long-lasting [49].
Gluconeogenesis is a much slower process than glycogenolysis, which is not able to keep up with the high energy demand during intensive activity [48, 49]. Fur- ther, growth hormones released especially during weight lifting exercises are known to stimulate hepatic glycogenolysis [39]. At the end of the exercise, EGP decays gradually to its basal values.
14 CHAPTER 2. BACKGROUND AND RECENT WORK
2.1.3 Insulin Sensitivity
The ability of insulin to stimulate the uptake of glucose (insulin-dependent glucose uptake) by a human’s tissue is defined as SI. An increase in SI thus corresponds to a lower amount of insulin needed to achieve the same quantity of glucose uptake by the target tissue and vice versa [60]. The high blood flow rate during exercise allows for more insulin to be transported to the tissue and therefore resulting in increased uptake [59].
High insulin levels during exercise are known to inhibit lipolysis [48], while high levels of lactate probably cause insulin resistance [40]. SI remains increased up to 24-48h after exercise. Therefore, after exercise, insulin-dependent glucose uptake stays elevated and slowly decays to its basal value within 24-48 hours [17, 47].
Whereas muscle contractions itself lead to insulin-independent glucose uptake the effects of increased sensitivity are additive. Despite this phenomenon, insulin- dependent glucose uptake shows a threshold [47].
2.1.4 Catecholamine
The group of Catecholamine summarizes neurotransmitters such as epinephrine (adrenaline), norepinephrine (noradrenaline), and dopamine. It was shown that the body’s level of adrenaline and noradrenaline rise significantly above the anaerobic threshold. A small correlation between exercise intensity and levels of catecholamine was found below the anaerobic threshold [52]. Dopamine seems to increase linearly with intensity.
Increased levels of catecholamines have been shown to inhibit glucose uptake [61].
Marliss es al. [43] further showed that injection of adrenaline and noradrenaline at low exercise intensities reproduced the observed hepatic glucose production and the glucose uptake rates during higher intensities.
2.1.5 Effects of Physical Exercise on Blood Glucose in T1DM
Several studies have shown [7, 23, 24, 33], and it is generally agreed upon that BG-values drop temporarily during mild to moderate exercise in individuals liv- ing with T1DM. This is mainly due to the increase in glucose uptake from the bloodstream. However, during intense aerobic and anaerobic exercise study results diverge. Some studies [32, 42, 45, 46] show that at intense and resistance exercise BG-concentrations decline less than during aerobic exercise with same Energy Ex- penditure (EE).
Yet, BG-levels are seen to increase during resistance and anaerobic training accord- ing to others [17, 39–41, 43, 44, 62]. For glucose levels to rise, glucose uptake has to be lower than glucose production. Interestingly, Fahey et al. [44] state that the increase in BG results from lower levels of glucose uptake rather than increased glu- cose production compared to pre-exercising levels during short sprints. This could be due to higher levels of growth hormones and lactate during resistant training
CHAPTER 2. BACKGROUND AND RECENT WORK 15
which restricts glucose uptake through decreased temporary SI [41]. However, for intense exercises above 80% VO2max it is seen that EGP is vastly elevated [44].
Additionally, at the end of the exercising period, glucose uptake into the muscles de- creases quicker to its basal state than glucose production. However, glucose disposal stays elevated to boost the replenishment of glycogen stores after exercise. Further- more, it is expected that high hormonal levels of adrenaline and noradrenaline are related to higher BG-levels [43].
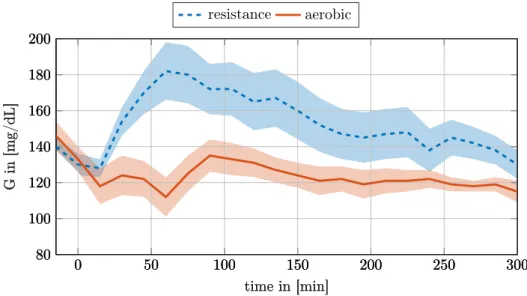
Figure 2.2 shows the mean response of T1DM subjects under resistance and aerobic exercise obtained from a pilot clinical trial by Quirós et al. [62]. As can be seen, the BG response of the two types of exercise is inherently different which further affirms the importance of detecting and modeling exercise accurately.
resistance aerobic
0 50 100 150 200 250 300
80 100 120 140 160 180 200
time in [min]
Gin[mg/dL]
0 50 100 150 200 250 300
80 100 120 140 160 180 200
time in [min]
Gin[mg/dL]
0 50 100 150 200 250 300
80 100 120 140 160 180 200
time in [min]
Gin[mg/dL]
Figure 2.2: Effects of aerobic and resistance exercise on BG-levels according to the results obtained from a pilot clinical trial by Quirós et al. [62]. The dashed line shows the averaged BG-response of resistance exercise from five T1DM subjects.
The continuous line shows the mean response of aerobic exercise from the same five subjects. The shaded area indicates the standard deviation. Even though the mean insulin injection over the graphed period has been higher during the resistance exercise the BG response is very different [62].
16 CHAPTER 2. BACKGROUND AND RECENT WORK
2.2 Exercise Detection
There are several approaches to quantify exercise and utilize it as input to AP- systems. This section elaborates on the most relevant ideas and tries to state its potential by taking into account the troublesomeness of measuring the physical variable.
2.2.1 Energy Expenditure (EE)
EE is exactly correlated to exercise intensity. The more energy one is expending at a certain time the higher the exercise intensity. EE can be computed using either direct- or indirect- calorimetry. Direct calorimetry measures the biologic heat produced by an individual through a heat flow device. It needs to be big enough to fit a person.
Indirect calorimetry however, is noninvasive, known to be highly accurate and much cheaper. Indirect calorimetry measures O2consumption and CO2production using a facial mask. From this EE is calculated using the Weir formula (Equation (2.1)) [51, 63], which maps the oxygen consumption and carbon dioxide production, both in inmL min−1, to the Total Energy Expenditure (TEE) as kcald−1as follows [51].
TEE= 1.440·(3.9·VO2+ 1.1·VCO2) (2.1)
2.2.2 Percent of Maximal Oxygen Uptake (%VO
2max)
The amount of oxygen consumed is known to be linearly proportional to the EE at least up to the anaerobic threshold and thus is a reliable estimate of the exer- cise intensity up to that point. At rest, the average person consumes about 3.5 mL kg−1min−1 oxygen, which corresponds to about 8% of VO2max in untrained individuals [49, 51].
As quickly touched upon in section 2.1, using the relative scale is still problematic.
More trained and younger individuals have higher VO2max values, thus having a lower percentage of oxygen consumption at equal EE [58].
The problem further intensifies considering that training pushes the aerobic and anaerobic threshold closer to VO2max. While the goal is to make intensities com- parable between individuals using the percentage of maximal uptake as scale, this is unfortunately not the case. The two mentioned thresholds that closely match different metabolism effects still vary widely in percentages of VO2max.
Moreover, to measure oxygen consumption accurately indirect calorimetry and a graded exercise test are needed to find VO2max. Although indirect calorimetry is noninvasive it is not something that can be used in everyday life. Thus, real-time oxygen consumption is difficult to estimate.
Currently available fitness watches advertise the estimation of personal VO2max.
CHAPTER 2. BACKGROUND AND RECENT WORK 17
A study [64], comparing commercial fitness trackers to indirect calorimetry, con- cluded that these estimates are not accurate enough to be used in any application.
Having in mind that usual values for the healthy individuals lie between 40 to 50 mL kg−1min−1, they found a mean deviation of 2.1 mL kg−1min−1 for the best device.
Lastly, the devices do not provide real-time information on the current oxygen con- sumption, thus making the V O2maxestimation superfluous for this application.
2.2.3 Metabolic Equivalent of Task (MET)
Metabolic Equivalent of Task (MET) is related to EE andV O2max. It is computed as multiples of the resting EE. MET and METmax are defined as
MET= VO2
VO2rest
and METmax= VO2max
VO2rest
.
While MET makes it easy to compare the relative expended energy concerning the basal state between individuals, the underlying biological processes could be very different depending on each’s training state. Thus, making it difficult to compare the biological processes involved in energy delivery. A trained person at 5 MET could well be below the aerobic threshold while an untrained person with the same MET is above the anaerobic threshold [51].
This is not to be confused %VO2max. Here the basal condition puts every individual on the same level regardless of their training condition. Thus, the relative MET scale maps intensities different from the %VO2max scale, which puts the metabolic changes even less into the same region.
This explains a short example: At maximal exertion, the metabolic pathways rele- vant for providing the energy of two people should be equal. However, one person might reach METmax of 10 while a more aerobically trained person might reach 15.
Thus, the metabolic pathway for the more trained individual at 10 MET can be very different.
2.2.4 Rating of Perceived Exertion (RPE)
The Rating of Perceived Exertion (RPE) is frequently used as a quantitative mea- sure of subjective perceived exertion during exercise. It was developed by Swedish scientist Gunnar Borg and is therefore sometimes referred to as the Borg scale rang- ing from 6 (no exertion) to 20 (maximal exertion). The 6-20 rating is based on the average HR, initially thought to followRP E= 0.1·HR[65].
While it seems to be very subjective since heavily influenced by the psychological resistance of each individual, some have shown a good correlation between RPE and %VO2max [28] as well as RPE and HR [66].
18 CHAPTER 2. BACKGROUND AND RECENT WORK
2.2.5 Heart Rate (HR)
Although, HR is not the most accurate measure to detect exercise intensity and type (aerobic, anaerobic) it is frequently used.
Most likely, because it is easily obtained with low-cost solutions. Recent develop- ments in Photoplethysmogram (PPG) [67] led to affordable wearable wristbands flooding the market, able to measure HR relatively accurately without imposing an additional burden on individuals. PPG uses light pulses, illuminating the skin to detect blood volume changes that arise from heartbeats [68, 69].
Usually, a percentage of the maximal HR (%HRmax) is used as an input. HRmaxcan be obtained through a maximal treadmill or bicycle stress tests in the laboratory supervised by cardiologists. However, mostly Fox and Haskells [70] formula (Equa- tion (2.2)) is used as a rough estimate for maximum HR.
HRmax= 220−AGE (2.2)
While this algebraic equation is easy to apply and widespread, mainly through the early adaption from companies like Polar Electro (Kempele, Finland) it is by no means accurate.
The formula results from a collection of several published studies where people were tested for their maximum heart rate. However, this was never meant to be a representative sample, since Fox’s goal was rather to find how intensely patients with Coronary Heart Disease could exercise. Furthermore, no standard deviation is referenced [70].
Rohbergs et al. [71] compared 43 different formulas estimating maximum HR with data from 225 subjects to find the best fit. While the data is highly varying, and no acceptable formula was found,Inbars formula
HRmax= 205.8−(0.685·AGE) (2.3) was found to be the most accurate. The authors similarly estimated the standard error using Fox and Haskells formula (Equation (2.2)) to be greater than 10 beats min−1. Using Inbar’s formula this reduced to around 6 beatsmin−1.
Another method for exercise intensity classification was presented by Karvonen et al. [72]. Instead of using the percentage of the maximum heart rate the concept of Heart Rate Reserve (HRR) is introduced as in Equation (2.4).
%HRR= HR−HRbase
HRmax−HRbase (2.4)
It has been stated thatHRreserve closely matches the EE expressed as %V O2max [73]. Furthermore, it has been shown [74] that HRreserve correlates even better with%V O2reserve.
CHAPTER 2. BACKGROUND AND RECENT WORK 19
2.2.6 Percent Active Muscle Mass (PAMM)
Percent Active Muscle Mass (PAMM) is used as an input in several simulation ex- ercise models based on Lenart and Parker [59]. To estimate the PAMM, knowledge of the exercise type is required.
Legged exercise such as cycling is usually stated as 25% of active muscle mass, for running 50% is used and for sports like where most muscle groups are used like in swimming, percentages are even higher. PAMM is seen to linearly depend on active muscle glucose uptake [49].
2.2.7 Respiratory Rate (RR)
A good indicator of PA, especially when used in conjunction with HR or EE, is the respiratory rate. While elevated HR can sometimes be caused by stress or substances like caffeine, respiratory rate can be used as an additional physiological variable to more reliably classify activity [75].
While Respiratory Rate (RR) is being measured in every VO2max test, it is often doomed to be the forgotten vital sign [76]. VO2max is computed as the product of RR and the tidal VolumeVT (Equation (2.5))
V O2max=VT ·RR (2.5)
Both variables are measured using indirect calorimetry with a face mask in a lab- oratory test. While obtaining the exact value of VT and thusV O2max with non- obtrusive devices is difficult, measuring RR accurately can be done with several low-cost solutions. RR can be obtained by measuring the thoracic strain exerted on chest straps during respiration. Fusing the strain data with accelerometry data makes the result more robust to movements [76].
Additionally, recent advancements in PPG make it possible to register heartbeats accurately enough to make use of a biological phenomenon called Respiratory Si- nus Arrhythmia (RSA) [77]. RSA states that HR is synced in a sinusoidal pattern with RR. HR thus increases with inspiration and decreases with expiration. Thus, paving the way for low-profile mobile wearable devices [78].
Recent evidence shows [76], that RR correlates better with RPE than any mea- surement based on HR or VO2max. Similarly, the nonlinear increase in RR correlates well with the lactic acid levels and thus with the aerobic and anaerobic thresholds.
Lastly, the quick response at onset and offset of exercise sets RR apart from other physiological variables.
20 CHAPTER 2. BACKGROUND AND RECENT WORK
2.2.8 Blood Lactate Concentration
By getting frequent blood samples and analyzing the lactate concentration one can accurately determine the aerobic and anaerobic thresholds [52]. These thresholds are of great importance as they vastly correlate with a change in metabolism, chang- ing the energy source as seen in section 2.1.
While it is not feasible to measure lactate concentration in everyday life, it could be measured once in a laboratory and mapped to a HR orV O2 consumption [58].
2.2.9 Movement Data
Several activity trackers have build-in Inertial Measurements Units (IMUs) that are equipped with accelerometers and gyroscopes [79, 80]. With the fusion of these, it is possible to obtain the absolute orientation of the tracker in 3D space as well as linear accelerations in real-time.
This can be used to make assumptions on the type of exercise (swimming, team sport, running, etc.) and measure relevant parameters for that type. For example, counting the strokes in swimming or the steps during a walk.
As stated by the SenseWear developers [81], knowing the exercise type can be used for a more precise estimation of other PA related variables. For example, knowing the type helps in estimating PAMM and thus the overall EE.
2.2.10 Additional PA Information
Many wrist-worn activity trackers or other wearable sensors like the SenseWearPro 3 [81] assess PA using HR and additional physiological variables. Most wrist-worn devices additionally utilize data from build-in 3-axis-accelerometers to increase their predictive power of estimating PA correctly [79, 80]. Several others can be used:
• heat flux sensor
• galvanic skin response sensor
• skin temperature sensor
• near-body temperature sensor
2.2.11 Exercise Detection Summary
This section aimed to show, how many different possibilities there are to detect exercise. Some try to capture intensities on an absolute scale (EE, RR), some are relative to the basal state (HRR methods [7, 82] and MET [31]) and others capture intensity relatively to an individuals maximal effort (%VO2max [49, 59], RPE [28]
and %HRmax).
CHAPTER 2. BACKGROUND AND RECENT WORK 21
Most of them are not feasible to be measured in everyday life since they require obtrusive devices. Thus, they can be discarded in this project.
However, efforts have been made to use easily obtainable activity information like motion data, HR, or RPE and fuse them to predict %VO2max or EE and use this as an input to the model.
For example, Resalat et al. [31] uses a fitness tracker armband that computes MET internally from other variables. Later they compute %VO2max by dividing MET with METmax. Similarly, Balakrishnan et al [28] use RPE to predict %VO2max by obtaining two linear fits for male and female individuals. Additionally, Turksoy et al. [16] developed models capable of learning to distinguish between aerobic and anaerobic exercise.
Further studies investigated converting from one scale to another (RPE to HR [66], RPE to %VO2max [28] and HR to %VO2max [83]). Generally, it was seen that the
"reserve" formulation (Equation (2.4)) correlates much better among each other [58, 74, 83]. This becomes intuitively clear, considering their very different basal percentages.
The approach of taking easily obtainable variables to predict more frequently used parameters for exercise intensity prediction is used as a starting point to develop models in chapter 4.
As seen in section 2.1, the aerobic and anaerobic threshold are the two most informative barriers when it comes to exercise intensity detection [58]. These two directly reflect changes in metabolic pathways and thus changes in BG-dynamics.
HR and %V O2max are probably the most widely used markers of intensity. Never- theless, there does not exist one precise percentage that corresponds to a threshold, due to great inter-patient variation [58].
However, it is generally considered for VO2max to be more precise than HRmax. Mostly, because more disturbances are affecting HR, such as caffeine and stress.
Yet, obtaining instantaneous V O2 consumption is not feasible. Still, it is used in several exercise models as will be seen in the following section.
Even though not measurable in real-time on wrist-worn devices yet, the RR is a good indicator of intensity as it rises and decays quicker than other variables. It is also seen to follow the lactic acid levels which in turn are used to define aerobic- and anaerobic- thresholds. This should be further investigated once PPG technology is advanced enough to measure RR with mobile devices accurately.
22 CHAPTER 2. BACKGROUND AND RECENT WORK
2.3 Exercise Models
This section summarizes the efforts that have been made so far to model the exercise- induced effects on the glucose-insulin dynamics in T1DM-subjects as elaborated in section 2.1. A chronological approach is taken, starting from the oldest and simplest model, working the way up to more sophisticated and recent models at the end of this section.
With the acquired knowledge about physiological exercise-induced effects, special attention is given to how the exercise is being modeled. Likewise, it is important to understand how these signals influence the insulin glucose subsystem specifically.
2.3.1 Bergman’s Minimal Model
In 1979 Bergman et al. [60] proposed a two-state inulin-glucose system designed to capture the dynamics from an Intravenous Glucose Tolerance Test (IVGTT). While this model does not illustrate any exercise effects it is often used as a basis of more sophisticated models due to its uniquely identifiable form.
Equation (2.6) depict the plasma glucose dynamics in mg/dL, Gb represents the basal glucose, D is the amount of injected glucose into the plasma in mg kg−1 bodyweight.
G(t) =˙ −p1(G(t)−Gb)−X·G+ D
Vg (2.6)
X˙(t) =−p2X+p3(I(t)−Ib) (2.7) Furthermore, X(t) which is a dynamic variable itself (Equation (2.7)) represents the amount of Insulin in the interstitial fluid and influences the insulin dependent glucose uptake in Equation (2.6). I(t)−Ib represents the insulin concentration in the plasma above the basal value in µUmL−1. Finally,p1,p2,p3,Vg,Gb are patient specific parameters that can be identified with collected data.
Insulin Sensitivity (SI) and glucose EffectivenessSGcan then be derived as follows:
SG=−∂G(t)˙
∂G(t) =p1
SI =− ∂2G(t)˙
∂I(t)∂G(t)= p3
p2
2.3.2 Lenart and Parker’s Exercise Model
Lenart and Parker [59] use %VO2max and PAMM to quantify the level of exertion in their model. They model the Peripheral Glucose Uptake (PGU) by the working muscles (Equation (2.8)) the Hepatic Glucose Production (HGP) (Equation (2.9)) and Peripheral Insuiln Uptake (PIU) (Equation (2.10)) as the 3 sources that reflect the Ra and Rd of glucose from the bloodstream.
The dimensionless parameters MG, MI, and MΓ represent the effects of glucose,
CHAPTER 2. BACKGROUND AND RECENT WORK 23
insulin, and glucagon respectively. The exercise related parameters MP GUE ,MHGPE andMP IUE in Equations (2.8), (2.9) and (2.10) are multiplied by PAMM to increase uptake and production linearly with the amount of muscle mass involved.
Furthermore, the glucose uptake factor P GUA is modeled as a first-order differ- ential equation, with a slow time constant of τ = 30 min, since it was seen that glucose uptake increases slowly to a steady-state value.
HGPA on the other hand balances the increased uptake, however not further ex- plained. eP GUA represents the steady-state value of glucose uptake that depends on %VO2max.
Peripheral insulin uptake P IU is known to be dependent on insulin concentration IP in the muscle.
Gup=P GU=MG·MI ·MΓ·MP GUE ·35 (2.8) MP GUE = 1 + P GUA·P AM M·28
35 dP GUA
dt =−1
30·P GUA+ 1
30·eP GUA(%V O2max)
Gprod=HGP =MG·MI ·MΓ·MHGPE ·155 (2.9) MHGPE = 1 +HGPA·P AM M
155
Iup=P IU=MP IUE ·P IU0(IP(t)) (2.10) MP IUE = (1 + 2.4·P AM M)
2.3.3 Roy and Parker’s Exercise Model
Like the original model from Lenart and Parker [59], their updated model [84] uses
%V O2max as exercise intensity input. Since their initial model from 2002 did only follow the true dynamics for up to 90 minutes, they concluded that the depletion of the hepatic glycogen storage is responsible for the deviation.
Therefore, in the updated model, a thresholdAT H is introduced that decreases the hepatic glycogenolysis by a constant ratek, if the integrated exercise intensityA(t) exceedsAT H.
If there is no exercise input the reservoir refills with first-order dynamics according to the time constantT1= 6min in Equation (2.11). This means the glycogen reservoir would be restored to 95% of its depletion after only 18 min (1−exp(−18/T1)<0.05).
Similarly, A(t) decreases with time constant τ = 16h after an exercise. Thus, a second exercise bout within a day leads to much quicker depletion effects of hepatic glycogen.
dGgly
dt =
0 A(t)< AT H
k A(t)≥AT H
−GglyT(t)
1 u3(t) = 0
(2.11)
24 CHAPTER 2. BACKGROUND AND RECENT WORK
Likewise, glucose uptakeGup, glucose productionGprodand exercise induced rate of Insulin removalIupare modeled as first order differential equations with%V O2max
as the driving force.
Comparing the dynamics ofGup with the one from Lenart and Parker shows even slower kinetics. Especiallyτrise, set to about8.5h, is about 17 times greater. τdecline on the other hand is similar and set to about 20 min in Equation (2.12).
Although being different to Lenart and Parkers model, the parameters of Gup are very similar to the ones obtained forGprod, which yields the same structure. There- fore, the effects on G(t)in Equation (2.13) almost vanish, making the necessity of a dynamic state questionable.
G˙up= 1
τuprise%V O2max− 1
τupdeclineGup (2.12) After all, the relative size of τuprise/τprodrise and τupdecline/τproddecline in Gup and Gprod is more important than their respective absolute values when being substracted in equation (2.13).
Equation (2.13) furthermore shows howGup,GprodandGgly extend Equation (2.6) of Bergmans minimal model:
G(t) =˙ −p1(G(t)−Gb)−X(t)·G(t) +BW
Vg
(Gprod(t)−Ggly(t))−BW Vg
Gup(t) + D Vg
(2.13)
Note, that Ggly is subtracted from Gprod in Equation (2.13). Adding a state to follow the hepatic glycogen storage has its reasoning. Nevertheless, the authors state that further validation has to be done using clinical data.
2.3.4 Hernández-Ordoñez’s Exercise Model
Similarly to Roy and Parker [84], Hernández-Ordoñez et al. [49] build upon the ideas of Lenart and Parker (section 2.3.2) and extended their initial exercise model.
The PGU dynamics are assumed to be identical to the one presented by Lenart and Parker [59] in Equation (2.8). Likewise, the peripheral insulin uptake PIU is not altered (Equation (2.10)).
However, Lenart and Parker did not capture the sigmoid like nonlinearity observed in the hepatic glycogen depletion due to PA within parameter MHGPE of Equation (2.9).
Instead of modeling the depletion as a steady decrease like in section 2.3.3, param- eterMHGPD is added as a factor to Equation (2.9). ForMHGPD a hyperbolic tangent is used with respect to the glycogenolysis dynamics.
The glycogenolysis dynamics is defined as a balance of the glycogenolysis rate Φ, that is a quadratic function of %V O2max and the hepatic glucose replenishment rateΨ. Both with a time constant of 1 min. The replenishment rate is considered constant until its storage is full.
![Figure 2.1: Qualitative contribution of different energy sources during exercise over a logarithmic time scale [50].](https://thumb-eu.123doks.com/thumbv2/1library_info/5343730.1682087/24.892.247.670.697.915/figure-qualitative-contribution-different-energy-sources-exercise-logarithmic.webp)
![Table 2.1: Bloodflow rates in dL min −1 to different tissues as a function of relative exercise intensity [49, 59]](https://thumb-eu.123doks.com/thumbv2/1library_info/5343730.1682087/26.892.267.655.836.1001/table-bloodflow-different-tissues-function-relative-exercise-intensity.webp)