Metric-based Data Quality Assessment -
Developing and Evaluating a Probability-based Currency Metric
Authors:
Heinrich, Bernd, Department of Management Information Systems, University of Regensburg, Universitätsstraße 31, D-93040 Regensburg, Germany, bernd.heinrich@ur.de
Mathias, Klier, Department of Management Information Systems, University of Regensburg, Universitätsstraße 31, D-93040 Regensburg, Germany, mathias.klier@ur.de
Citation: Bernd Heinrich, Mathias Klier, Metric-based data quality assessment — Developing and evaluating a probability-based currency metric, Decision Support Systems, Volume 72, April 2015, Pages 82-96, ISSN 0167-9236, http://dx.doi.org/10.1016/j.dss.2015.02.009.
(http://www.sciencedirect.com/science/article/pii/S0167923615000299)
2
Metric-based Data Quality Assessment -
Developing and Evaluating a Probability-based Currency Metric
Abstract:
Data quality assessment has been discussed intensively in the literature and is critical in business. The im- portance of using up-to-date data in business, innovation, and decision-making processes has revealed the need for adequate metrics to assess the currency of data in information systems. In this paper, we propose a data quality metric for currency that is based on probability theory. Our metric allows for a reproducible configura- tion and a high level of automation when assessing the currency of attribute values. The metric values represent probabilities and can be integrated into a decision calculus (e.g., based on decision theory) to support decision- making. The evaluation of our metric consists of two main steps: (1) we define an instantiation of the metric for a real-use situation of a German mobile services provider to demonstrate both the applicability and the practical benefit of the approach; (2) we use publicly available real world data provided by the Federal Statistical Office of Germany and the German Institute of Economic Research to demonstrate its feasibility by defining an in- stantiation of the metric and to evaluate its strength (compared to existing approaches).
Keywords: Data quality, Data quality assessment, Data quality metric, Currency of data
1. INTRODUCTION
Data quality issues are discussed intensively in the literature and are critical in business. High-quality data in information systems (IS) are needed as a basis for business, innovation, and decision-making processes (Al- Hakim 2007, Ofner et al. 2012). Thus, poor data quality often results in bad decisions and economic losses (Even et al. 2010, Forbes 2010, Gelman 2010, Qas 2013). In addition, great effort is required to ease or solve data quality problems (Even and Shankaranarayanan 2007, IBM 2012). The growing relevance of data quality has also revealed the need for adequate assessment (e.g., IBM 2012, Qas 2013). Quantifying data quality (e.g., quality of customer data) is essential for taking into account data quality aspects in decision-making (e.g., to select the customers to be addressed in a mailing campaign considering the quality of the address data stored).
Moreover, assessing data quality constitutes an indispensable step toward the ability to decide whether a data quality measure (e.g., address data cleansing) should be taken from an economic perspective. In this context, it is necessary to quantify and consider the effects of measures with respect to the data quality level – a fact that is
often illustrated as part of the data quality loop (for details cf. e.g., Heinrich et al. 2009).
A recent report (cf. Qas 2013) has revealed that one of the most common data defects is outdated data, which primarily results in wasted budgets, loss of potential customers, and reduced customer satisfaction. For exam- ple, two-thirds of surveyed organizations observe several problems in the context of customer relationship management, such as sending mailings to the wrong address or sending the same mailing to the customer mul- tiple times; this indicates that outdated address and customer data negatively affect customer perceptions. In- deed, several investigations have shown that time-related aspects (e.g., up-to-date data) are particularly important in data quality management (Klein and Callahan 2007, Sidi et al. 2012).
Despite their relevance for theory and practice, however, there is still a lack of well-founded and applicable da- ta quality metrics to assess the currency of data in IS. Therefore, we state the following research question:
How should a metric be defined to assess the currency of data in IS?
To contribute to this question, we propose a probability-based currency metric (PBCM). By means of this met- ric, information about the currency of the assessed data can be considered in decision-making and add value in terms of better decisions. Indeed, the PBCM can also be seen as a possible basis for integrating data quality as- pects in the theoretical framework of the value of information and particularly its probability-based normative concept (Carter 1985, Hilton 1981, Lawrence 1999, Marschak et al. 1972, Repo 1989).
The remainder of the paper is organized as follows. Section 2 illustrates the problem context and provides an overview of prior works. In Section 3, we develop a metric that is based on probability theory. The evaluation in Section 4 consists of two steps. First, we instantiate the metric for a real-use situation at a mobile services provider to demonstrate both its applicability and practical benefit. Second, we use publicly available real world data to demonstrate feasibility by defining an instantiation of the metric and to evaluate its strength. Fi- nally, we summarize, reflect on the results, and provide an outlook on future research.
2. BACKGROUND
First, we provide some basic definitions and present the problem context. We then discuss existing contribu- tions with respect to assessing the data quality dimension currency and identify the research gap.
2.1 Basic Definitions and Problem Context
Parssian et al. (2004, p. 967) use the terms information quality and data quality to “characterize mismatches between the view of the world provided by an IS and the true state of the world” (for a similar definition cf. Orr
4
1998). We take this definition as a basis. Data quality is a multi-dimensional construct (Lee et al. 2002, Red- man 1996) comprising several dimensions such as accuracy, completeness, currency, and consistency (for an overview cf. Wang et al. 1995). Each dimension provides a particular view on the quality of attribute values in IS. We focus on currency and investigate how to assess this dimension by means of a metric.
Due to its relation to accuracy, we briefly discuss this data quality dimension in a first step. Afterwards, we de- fine currency and delimit it from accuracy. Many authors (e.g., Batini and Scannapieco 2006, Redman 1996) define accuracy as the closeness of an attribute value stored in an IS to its real world counterpart. Usually, comparison or distance functions are used to determine the closeness of the attribute value with respect to its real world counterpart (Batini and Scannapieco 2006). The assessment of accuracy involves a real world test that constitutes a direct evaluation, for example by means of a survey or interview (cf. e.g., Wang and Strong 1996). Thus, both the stored attribute value and its real world counterpart are known when assessing accuracy.
In contrast to the widely accepted definition of accuracy, the definitions of time-related data quality dimensions are much less uniform in the literature (cf. Batini and Scannapieco 2006, Batini et al. 2009, Chayka et al. 2012).
To express and specify time-related aspects, a number of different terms are used such as currency, timeliness, staleness, up-to-date, freshness, temporal validity, etc. Some contributions use different terms to define very similar or equal concepts while others use the same term describing different concepts. Ballou et al. (1998), for instance, refer to currency as the age of an attribute value at the instant of assessment. They use the term timeli- ness to describe whether “the recorded value is not out of date” (Ballou et al. 1998, p. 153). In contrast, Batini and Scannapieco (2006, p. 29) highlight that “currency concerns how promptly data are updated”. Other au- thors such as Redman (1996, p. 258) state that currency “refers to a degree to which a datum in question is up- to-date. A datum value is up-to-date if it is correct in spite of possible discrepancies caused by time-related changes to the correct value”. A similar definition is proposed by Nelson et al. (2005). Cho and Garcia-Molina (2003, p. 3) address an analog concept but use the term up-to-date to express that previously stored values
“equal those of their real-world counterparts”. Xiong et al. (2008, p. 952) also refer to a similar concept as that discussed by Redman (1996) and Nelson et al. (2005) but use the terms fresh and freshness, stating that “a real- time data object is fresh (or temporally valid) if its value truly reflects the current status of the corresponding entity in the system environment”. This brief discussion illustrates that there is no widely accepted definition of such time-related data quality dimensions. As we primarily build upon the definitions of Redman (1996) and Nelson et al. (2005), we also use the term currency and clearly define the concept behind it for our context.
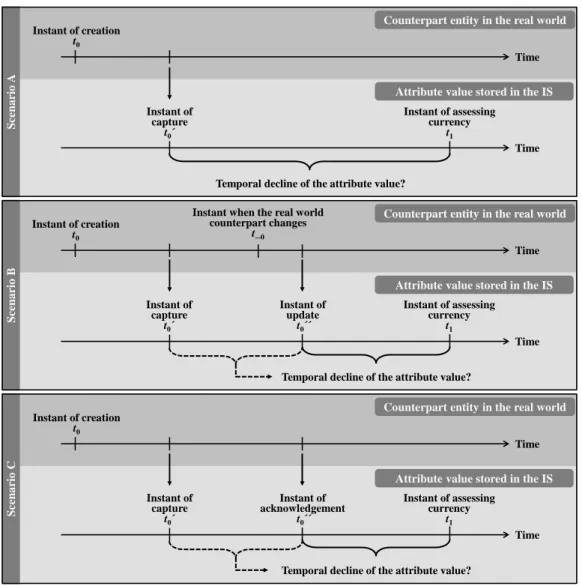
At its heart, currency expresses whether an attribute value that was stored in an IS in the past is still the same as the value of that attribute in the real world at the instant of assessment (i.e., in the present). This means that the attribute value, which was accurate when it was initially captured (Scenario A), updated (Scenario B), or acknowledged (Scenario C), is still the same as the current value of that attribute in the real world at the instant when its data quality is assessed. Currency explicitly focuses on the temporal decline of a stored attribute value.
To illustrate this focus, we clarify the Scenarios A to C (cf. Figure 1).
Scenario AScenario BScenario C
Instant of creation t0
Instant of capture
t0´
Instant of assessing currency
t1
Time Counterpart entity in the real world
Time
Attribute value stored in the IS
Temporal decline of the attribute value?
Time Counterpart entity in the real world
Time
Attribute value stored in the IS Instant of
update t0´´
Temporal decline of the attribute value?
Time Counterpart entity in the real world
Time
Attribute value stored in the IS
Temporal decline of the attribute value?
Instant when the real world counterpart changes
t_0
Instant of assessing currency
t1 Instant of
capture t0´
Instant of capture
t0´
Instant of assessing currency
t1
Instant of acknowledgement
t0´´
Instant of creation t0
Instant of creation t0
Fig. 1. Important Scenarios when Assessing the Currency of an Attribute Value
Scenario A shows the basic case: An attribute value was initially captured at the instant t0’ (i.e. the accurate value was stored in the IS). The instant of creation of its real world counterpart is represented by t0. Here, it must be assessed whether the stored attribute value is still the same as the value of that attribute in the real world at the instant of assessment t1. Thus, the question arises whether the real world counterpart has changed (which is unknown) since the attribute value was captured at t0’. In Scenario B, it is known that the real world counterpart changed (e.g., at the instant t_0). The stored attribute value was therefore updated accordingly at the
6
the real world counterpart. Both additional known instants (update and acknowledgement) can be useful (see below) when assessing the currency of the attribute value at the instant t1.
When assessing the accuracy at the instant t1, a real world test is needed. The result represents a statement un- der certainty. In contrast to assessing accuracy, assessing currency does not involve a real world test. Instead, a metric for currency delivers an indication, not a verified statement, as to whether an attribute value has changed in the real world since the instant it was captured, updated, or acknowledged.
An assessment of currency seems to be helpful in the following settings:
(a) Unknown shelf life of the considered attribute value: Assessing currency is helpful if the shelf life of the considered attribute value is unknown. Otherwise, the attribute value’s currency can trivially be determined under certainty. The shelf life is defined as the length of time the stored attribute is still the same as the val- ue of that attribute in the real world. In Scenario B, for example, the attribute value was created at the in- stant t0 and changed at the instant t_0. Hence, the attribute value’s shelf life was t_0-t0. Possible application settings include customer master data such as name, address, phone number, marital status, number of chil- dren, profession, educational background, employer, and income, as the shelf life of the respective stored attribute values is usually unknown. However, even in the case of real world objects with a rather fixed shelf life such as credit cards that have a validity period of two years, for example, the shelf life of single attribute values may be unknown as the credit cards can become invalid earlier due to events such as with- drawal, theft, or loss of creditworthiness. Therefore, assessing currency can even be helpful in such cases.
In addition to customer master data, the shelf life of product data, transaction data, and project data may al- so be unknown, which leads to further promising fields of application. The processes in production plan- ning, for example, are typically based on data from a variety of internal and external sources (e.g., from suppliers or manufacturing partners) with the results strongly depending on the quality of the data used. In this context, the shelf life of the attribute values is unknown as well and assessing currency can provide helpful indications of whether the stored data are still the same as in the real world.
(b) Real world test not possible or time-consuming or cost-intensive: In the event the shelf life of an attribute value is unknown (cf. (a)), one can propose a real world test that directly compares the stored attribute val- ue and the value of that attribute in the real world. However, such a real world test is often not practicable or too time-consuming and cost-intensive, for example, when customers have to be surveyed. For instance, analyses of data from a firm with more than 20 million customers show that every year about 2 million cus-
tomers change their place of residence, 230,000 die, and 60,000 get divorced (Schönfeld 2007). In this case, it would be very cost-intensive and impractical to regularly survey all customers in order to assess ac- curacy and update or acknowledge the stored attribute values. However, ignoring such data quality defects results in outdated data causing an annual loss of more than EUR 2 million for the firm due solely to inade- quate customer contacts (Franz and von Mutius 2008). In other settings, for instance in distributed systems (e.g., in supply chains involving different firms), a real world test is hardly possible either. Therefore, it seems promising to assess currency and draw on indications whether a stored attribute value is still the same as the value of that attribute in the real world.
2.2 Related Work and Research Gap
A number of well-known and important contributions have been made with respect to the assessment of data quality (e.g., Batini et al. 2009, Batini and Scannapieco 2006, English 1999, Lee et al. 2002, Pipino et al. 2002, Redman 1996). In this subsection, we provide an overview of works on concrete metrics for assessing currency.
One of the first and most renowned contributions was provided by Ballou et al. (1998). They define their met- ric1 as a function depending on the age of the attribute value at the instant of assessing currency (t1-t0), the (fixed and given) shelf life of the attribute value, and a sensitivity parameter to adapt the metric to the context of application. The values of the metric are mapped on the interval [0; 1], with a value of one representing per- fectly good and a value of zero perfectly bad currency. Hinrichs (2002) defines a metric for currency providing values normalized to the same interval. The values of this metric depend on how often the attribute values are (approximately) updated on average in the real world and the length of time between the instant of assessing currency and the instant of capturing the attribute value (t1-t0’) or updating or acknowledging it (t1-t0’’), respec- tively. Another metric is presented by Even and Shankaranarayanan (2007) in terms of a function depending on the length of time between the instant of assessing currency and the instant of capturing the attribute value (t1- t0’) or updating or acknowledging it (t1-t0’’). The main idea of their approach is to define the metric in such a way that its values denote the utility (represented by the interval [0; 1]) resulting from the currency of an attrib- ute value. Two examples of utility functions (either the utility declines exponentially or completely when a cer- tain threshold is reached) are discussed. Li et al. (2012) present a metric for currency in pervasive
environments. This metric is defined based on the attribute value’s storage age with respect to its last update (t1-
1 Ballou et al. (1998) actually propose a metric for the data quality dimension timeliness. Their understanding of timeli-
8
t0’’) and its shelf life. To represent the update dynamics of pervasive data sources, the authors use the volatility in terms of the probability that another update happened since the last update (i.e., between t0’’ and t1) as an exponent of an exponential function (“scaling factor”), which is added in a multiplicative way. Heinrich and Hristova (2014) present a metric based on expert estimations. Their metric is modelled as a fuzzy inference sys- tem consisting of a set of parallel IF-THEN rules. In this context, the authors also provide methods to estimate the input parameters for their metrics (i.e., age of the attribute value and its decline rate) by experts.
Another idea is to define currency based on probability theory. Heinrich et al. (2009) propose a procedure to develop probability-based metrics but explicitly do not seek to provide a concrete, mathematically noted one.
Their procedure consists of six generic development steps – from selecting the attribute to be considered in the assessment via the identification of the impact factors that influence the shelf life of the respective attribute values through to defining and applying the metric. Heinrich et al. (2007, 2012) as well as Heinrich and Klier (2009, 2011) provide a formally defined metric. Assuming that the shelf life of attribute values is exponentially distributed, the values of the metric by Heinrich et al. (2007) and Heinrich and Klier (2011) can be interpreted as the probability that the attribute values are still current. Wechsler and Even (2012) propose a metric2 based on a Markov-Chain model. Assuming memoryless transitions and an exponential probability distribution, this metric is similar to that of Heinrich et al. (2007) and Heinrich and Klier (2011). Obviously, however, the as- sumption of an exponential distribution does not hold for all attributes, which heavily affects the applicability of these approaches. Heinrich and Klier (2009) build on the idea of these probability-based approaches for at- tribute values characterized by an exponentially distributed shelf life. While providing first insights into how to consider supplemental data and an illustrative application scenario (using the metric to determine the Customer Lifetime Value), Heinrich and Klier (2009) as well as Heinrich et al. (2012), however, do not focus on missing or unknown supplemental data and a wide range of different data attributes and their specific characteristics.
Important contributions with respect to metrics for assessing currency in a wider sense are presented by Cap- piello et al. (2003) as well as Pernici and Scannapieco (2003). Cappiello et al. (2003) provide insights into time-related dimensions of data quality in multichannel IS. They define mathematical functions to represent the currency of data on the level of operational databases as the average fraction of data that have not been modi- fied or deleted in the interim in another operational database. Representing or assessing the currency of single
2 They actually propose a metric for accuracy degradation. However, as Wechsler and Even (2012, p. 1) “observe accuracy and currency as related issues” and “address accuracies that are caused by failures to update data even when changes in the real-world entity require us to do so”, their approach is well within our scope.
attribute values and assessing currency with regard to possible changes to the data in the real world, however, is beyond the focus of their work. Pernici and Scannapieco (2003) propose a data model and a methodological framework to associate quality information with data in web IS. They define a mathematical function to repre- sent the volatility of data in terms of the temporal dynamics of the expiration of data. Their function corre- sponds to the probability that the expiration time associated with the data will change in the time interval starting from the instant of publication and ending with their expiration time. They do not aim to define a met- ric to assess the currency of attribute values in our sense; rather, the authors assume that the expiration time of data is given and stored in the IS when publishing the data, and try to declare the quality of the published data in terms of possible future changes and updates from the time the volatility is quantified onwards.
In summary, important contributions have been made with respect to metrics for currency. Compared to other approaches, a probability-based metric has some advantages. For instance, the metric values in terms of proba- bilities have a concrete unit of measurement and are interval scaled. However, there is still a research gap re- garding a probability-based metric to assess currency that
(1) can cope with missing or unknown metadata (e.g., unknown shelf life and unknown instant of creation t0 of the attribute value in the real world) for any number of attribute values,
(2) is able to cope with a wide range of different data attributes and their specific characteristics (e.g., chang- ing decline rates) and does not depend on limiting assumptions (e.g., exponential distribution),
(3) is formally modeled (e.g., what are the exact underlying assumptions?) and mathematically defined (e.g., how can the metric be instantiated and how can its values be calculated?),
(4) takes into account additional data (e.g., other attribute values that are characterized by a statistical associa- tion with the considered attribute value’s shelf life) to improve the strength of the metric, and
(5) has been rigorously evaluated (e.g., using publicly available real world data).
In the following section, we aim to develop and evaluate a probability-based metric that fills this gap and al- lows for a reproducible configuration and a high level of automation when assessing currency.
3. DEVELOPMENT OF THE PROBABILITY-BASED CURRENCY METRIC
In this section, we outline the conceptual foundations of our approach. On this basis, we develop the basic model of the PBCM. To improve the strength of the metric and to be able to cope with further realistic cases we then provide important extensions. Finally, possible ways to design instantiations of the PBCM are discussed.
10
3.1 Conceptual Foundations
Currency expresses whether an attribute value ω is still the same as the value of that attribute in the real world at the instant of assessment. In many contexts, the metadata of a real world counterpart, which means its shelf life and sometimes even its instant of creation, are unknown. Therefore, a metric for currency usually delivers an indication or estimation rather than a verified statement. We argue that the principles and the knowledge base of probability theory are adequate and valuable, providing well-founded methods to describe and analyze situations under uncertainty. Developing our metric, we interpret currency as the probability that an attribute value ω is still the same as the value of that attribute in the real world at the instant of assessing currency t1 and has not become outdated due to temporal decline. In case of a limited and unknown shelf life, this probability decreases over time. If the shelf life of an attribute value ω is unlimited, the attribute value does not become outdated. This case is trivial and does not require an assessment. In addition, in contrast to some existing ap- proaches we generally do not assume a fixed and known maximum shelf life of the attribute values because many attribute values either do not have a fixed maximum shelf life or it is not known.
Defining the metric values as a probability has several advantages: (1) Representing them as a probability en- sures a concrete unit of measurement of the metric values; this means that the values of the metric are unam- biguously defined and interpretable (Bureau International des Poids et Mesures 2006). (2) It seems natural and reasonable because a metric for currency delivers an indication or estimation under uncertainty. (3) The values of the metric are interval scaled, which means that the metric values as well as changes and differences in these values are meaningful (Frank and Althoen 1994). An interval scaled metric is necessary to compare, for in- stance, the effects of two or more data quality measures with each other and to interpret the resulting differ- ence(s). (4) The metric values in terms of probabilities can be integrated, for instance, into the calculation of expected values to evaluate decision alternatives and support decision-making. Thus, each measure’s data quality improvement can be compared to its costs to find out which measure is economically worthwhile.
3.2 Development of the Basic Model
Our basic model is based on the following assumptions and definitions (see Appendix A for an overview of all symbols and the mathematical notation used):
A.1 An attribute value ω is characterized by its real world counterpart’s instant of creation t0, which is initial- ly known. The shelf life TR+ of the attribute value ω is limited and unknown. It is regarded as stochas- tic (continuous random variable). The instant of assessing currency is represented by t1 (with t1t0).
The age tR+ of the attribute value ω can be determined by means of the instant of assessing currency t1 and the instant of creation t0 of the real world counterpart: t=t1t0. An attribute value ω is current if and only if it is still the same as the value of that attribute in the real world at the instant of assessing currency t1. This is the case, if and only if its shelf life T is greater than or equal to its age t. Because the shelf life T is unknown and is therefore regarded as stochastic, the currency of the attribute value ω cannot be determined under certainty.
Consequently, currency is defined as the probability that the shelf life T is greater than or equal to the age t.
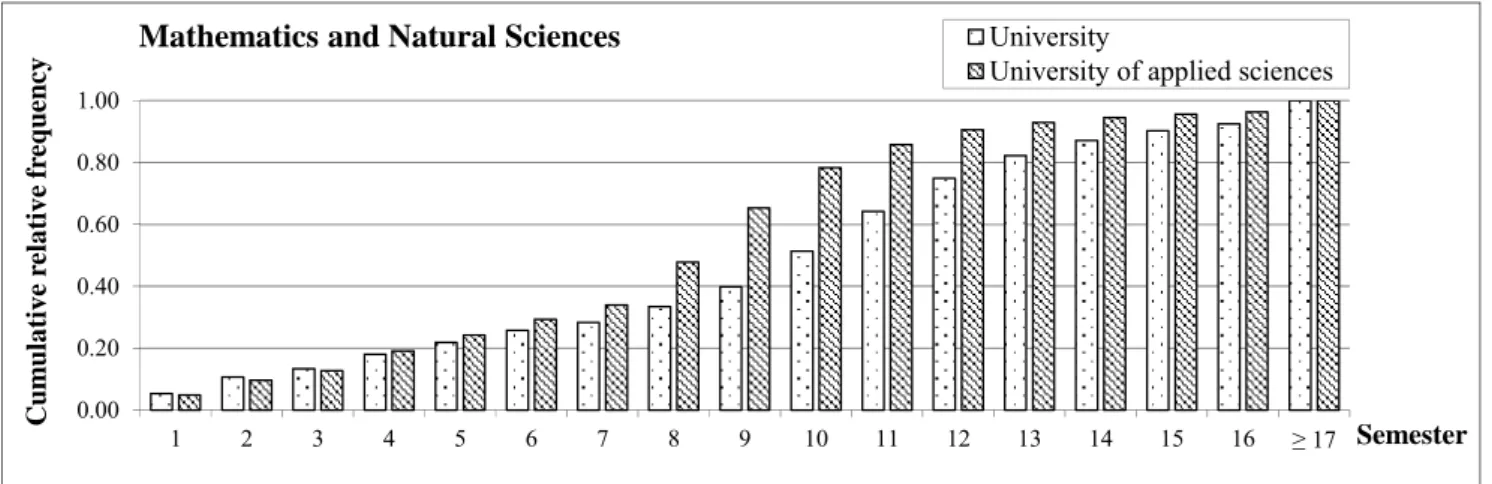
To support this currency assessment, additional data are considered. These additional data are characterized by a statistical association with the unknown shelf life T and therefore allow conclusions to be drawn about the shelf life T and the currency of the attribute value ω. To illustrate the relevance of additional data, we focus on the attribute value “student”. Figure 2 illustrates the existence of a statistical association between the duration of study (including dropouts) – i.e., the shelf life T of the stored attribute value “student” – and the type of uni- versity (university vs. university of applied sciences). The cumulative frequency distributions are based on data provided by the Federal Statistical Office of Germany (2005-2008) and the Higher Education Information Sys- tem GmbH (Heublein et al. 2003, 2008). Referring to persons whose data were captured in an IS when they started their study of Mathematics and Natural Sciences ten semesters ago: If it is additionally known that these persons enrolled at a university of applied sciences, it is expected that approximately 78% of them have already finished their studies and that the stored attribute value “student” is still current for only approximately 22% of them. If the persons enrolled at a university, however, it is expected that approximately 49% of the respective attribute values are still current. Thus, additional data – such as the type of university – seem to be relevant when assessing currency.
0.00 0.20 0.40 0.60 0.80 1.00
1 2 3 4 5 6 7 8 9 10 11 12 13 14 15 16 ≥ 17
Cumulative relative frequency
Semester Mathematics and Natural Sciences University
University of applied sciences
Fig. 2. Cumulative Frequency Distributions of the Duration of Study (incl. Study Dropout)
Assumption A.2 takes this aspect into account. Moreover, it also reflects the fact that in real databases parts of
12
the relevant additional data may not be stored (i.e., they are not known) for all attribute values ω.
A.2 The cumulative distribution function Fω(t|w1,…,wn):=Pω(Tt|W1=w1,…,Wn=wn) of the shelf life T of at- tribute value ω is given. It depends on the additional data wi (with i=1,…,n) being part of the data record.
The additional data wi represent realizations of the random variables Wi. At the instant of assessing cur- rency t1 – without any loss of generality – only the additional data wj (with j=1,…,l and l≤n) are known.
Based on assumptions A.1 and A.2, we define the PBCM for the attribute value ω as the conditional probability that the shelf life T of the attribute value ω is greater than or equal to its age t. The known additional data wj
(with j=1,…,l and l≤n) serve as conditions W1=w1, …, Wl=wl. The additional data wk (with k=l+1,…,n) are un- known for the attribute value ω. Hence, currency has to be assessed without knowing the realizations of the random variables Wk. Because these realizations are part of the distribution function Fω(t|w1,…,wn) (see A.2), we use an expected value calculus in order to remove them from the corresponding density function
fω(|w1,…,wn). This can be done by integrating the density function over the universal sample spaces Wk of the random variables Wk (with k=l+1,…,n) (cf. proof in Appendix B; note that ... ( ,..., ) ... 0
1
1
1
n
W Wl
n l
n dw dw
w w f
is necessary):
Wn Wl Wn Wl
n l
n
n l
n
l f w w dw dw
dw dw w w f w
w f
1 1
...
) ,..., ( ...
...
) ,..., , ( ...
) ,...,
| (
1 1
1 1
1
(1)
We define the PBCM QCurr .(t,w1,...,wl) as denoted in Term (2):
t
l l
l l l l
Curr
d w w f
w W w W t T P
w W w W t T P w w t Q
0
1 1
1 1 1 1
.
) ,...,
| ( 1
) ,...,
| ( 1
) ,...,
| ( : ) ,..., , (
(2)
The PBCM is defined based on the complementary probability Pω(T<t|W1=w1,…,Wl=wl), which represents the probability that the attribute value is outdated at the instant t1 (T<t=t1–t0) considering the known additional data wj (with j=1,…,l and l≤n) as conditions. As the complementary probability represents whether the attribute val- ue ω has become outdated before the age t is reached, the definite integral of the determined density function fω(|w1,…,wl) is calculated over the interval [0; t]. In contrast to existing approaches, our approach allows us to consider additional data in a well-founded way. Using the expected value calculus according to Term (1) en- sures that even in the case of missing additional data the metric can be applied in a widely automated way and
does not require any further manual configuration. To illustrate this expected value calculus, we use the exam- ple introduced in Figure 2. In the event the additional data regarding the type of university is unknown when assessing the currency of the attribute value “student” of a specific person, all possible values of the additional data (realizations of the random variable type of university) and their probabilities have to be taken into ac- count. Hence, we do not consider only one single realization when assessing currency, but rather integrate each possible realization of the random variable with its corresponding probability into our calculation (cf. Term (1)). In the example, the probabilities that the person enrolled at a university and a university of applied scienc- es, respectively, are considered. However, it has to be noted that the strength of the metric is affected if addi- tional data are unknown. A mathematical discussion of this fact is provided in Appendix C.
As the shelf life T is limited, the decline rate zω(t|w1,…,wl) is a key characteristic of Pω(T≤t|W1=w1,…,Wl=wl) and therewith the cumulative distribution function Fω(t|w1,…,wn). By multiplying this decline rate with the length h of the time interval [t; t+h] (with hR+), it is possible to approximate the probability that the attribute value ω which is still current at an age t becomes outdated in the following time interval of length h
(Pω(T≤t+h|W1=w1,…,Wl=wl,T>t)). Based on Term (1), zω(t|w1,…,wl) can be represented as follows:
. ) ,...,
| ( 1
) ,...,
| (
) ,...,
| (
) ,...,
| ( ) ,...,
| lim (
) , ,...,
| lim (
: ) ,...,
| (
0
1 1
1 1
1 1 1
1 0
1 1 1 0
t
l l
l l
l l l
l h
l l l h
d w w f
w w t f
w W w W t T P h
w W w W t T P w W w W h t T P
h
t T w W w W h t T w P
w t z
(3)
The continuous decline rate zω(t|w1,…,wl) is defined as the limit of the quotient of the conditional probability Pω(T≤t+h|W1=w1,…,Wl=wl,T>t) and the length h of the time period [t; t+h] as h approaches zero. Multiplying the decline rate zω(t|w1,…,wl) with h can only serve as an approximation of Pω(T≤t+h|W1=w1,…,Wl=wl,T>t).
This is because the decline rate may be piecewise constant, increasing and/or decreasing depending on
Fω(t|w1,…,wn). Moreover, by using the decline rate zω(t|w1,…,wl) it is possible to (intuitively) represent the spe- cific characteristics of data attributes in terms of constant, increasing, decreasing, or changing decline rates.
3.3 Extensions of the Basic Model
In the following subsection, we provide extensions of the basic model to improve the strength of the PBCM and have the ability to address realistic cases when (additional) metadata are available or unknown.
14
3.3.1 Considering Additional Metadata Referring to Data Updates or Acknowledgements
In Scenarios B and C, the PBCM has to deliver an indication whether a stored attribute value , which was up- dated or acknowledged in the meantime, is still current. In the following, we extend the basic model to take into account such additional metadata distinguishing the cases of (a) updates and (b) acknowledgements.
(a) According to Scenario B, attribute value constitutes an update of a formerly stored attribute value ’ at the instant t0’’. This update is due to a change of the real world counterpart at the instant t_0 (cf. Figure 1).
When assessing currency, the formerly stored attribute value ’ may serve as additional metadata. Such data are usually available in case of temporal databases and bitemporal timestamps. Indeed, it is possible to observe former changes of the attribute value over time, as well as the lengths of time the attribute value was stored. To take these additional metadata into account the PBCM has to be extended. Here, the addi- tional metadata serve as further conditions apart from the conventional additional data. Term (4) shows the extended PBCM considering the formerly stored attribute value ’ (the respective random variable is de- noted as W’) when assessing the currency of the attribute value with age t=t1t_0:
t
l
l l l
Curr
d w w f
w W w W W
t T P w w t Q
0
1
1 1 '
1 .
) ,..., ,'
| ( 1
) ,...,
,'
| ( : ) ,..., ,' , (
(4)
Considering the formerly stored attribute value ’, the strength of the metric can be improved (this can be proven analogously to the case of conventional additional data; cf. Appendix C). The relevance of consid- ering such additional metadata can be illustrated by using the attribute value “student”. The average drop- out rates depend heavily on a person’s former school education and are much higher for persons who graduated from an evening school or a vocational college compared to those who attended a regular sec- ondary school. Considering the additional metadata referring to the previous school education of a person significantly affects the probability of that person still being a student and, consequently, the currency.
(b) According to Scenario C, the attribute value was acknowledged at the instant t0’’ (cf. Figure 1). One could believe that knowing about the instant of acknowledgement is worth nothing when assessing curren- cy. However, it can easily be shown that considering the instant t0’’ as additional metadata can significant- ly improve the strength of the PBCM. We illustrate this fact using the example of the attribute value
“student”. Referring to persons whose data were captured when they started their studies of Mathematics and Natural Sciences at a university of applied sciences ten semesters ago, it is expected that the stored at-
tribute value “student” is still current for only approximately 22% of them (cf. Figure 2). If it is additional- ly known that the attribute value “student” was acknowledged one semester ago (at the instant t0’’), it is expected that the attribute value “student” is still current for approximately 63% (=(1-0.78)/(1-0.65)) of them (cf. Figure 2). Additional metadata regarding the instant t0’’ are obviously relevant. Hence, in Term (5) we extend the basic model by considering the age t’ in terms of the length of time between the instant when the attribute value was acknowledged t0’’ and its instant of creation t0 (i.e., t’=t0’’t0).
). ,..., , (
) ,..., , (
) ,...,
| ( 1
) ,...,
| ( 1
) ,...,
| (
) ,...,
| : (
) ,..., , , (
1 .
1 .
0
1 0
1 1
1 1 1 1
.
l Curr
l Curr
t'
l t
l
l l
l l l
Curr
w w t' Q
w w t Q
d w w f
d w w f
w W w W t' T P
w W w W t T w P
w t' t Q
(5)
The contribution of this extension does not only stem from the fact that an enhanced solution is provided for relevant cases. In fact, the metric as defined in Term (5) does not require another cumulative distribu- tion function but can be traced back to applying the basic model as defined in Term (2) for t and t’.
3.3.2 Addressing an Unknown Instant of Creation t0
According to assumption A.1, the instant of creation t0 is known for all attribute values. This may be unrealistic as an attribute value’s instant of creation t0 may be stored only sporadically when capturing the attribute value.
Therefore, we will address the case of an unknown instant of creation t0.
Many databases store the instants when attribute values were captured, updated, or acknowledged as metadata (e.g., “last modified” attribute). In the following, the latest of these instants will be referred to as the instant of data entry t0* (with t0≤t0*≤t1). In case the instant of creation t0 is unknown, the known instant of data entry t0* is used to assess currency. Here, the age t*R+ of the attribute value ω with respect to the instant of data entry t0* (i.e., the storage time) can be determined to t*=t1t0*. Thus, based on t* and the cumulative distribution
function F*ω(t*|w1,…,wn):=Pω(T*t*|W1=w1,…,Wn=wn) of the shelf life T*, we define the metric for currency )
,...,
*, (
*Curr. t w1 wl
Q as denoted in Term (6). Again its values represent the probability that the attribute val- ue ω is still current at the instant of assessing currency t1. The density function f*ω(|w1,…,wl) can be deter- mined as in Term (1) based on F*ω(t*|w1,…,wn) and the corresponding density function f*ω(|w1,…,wn).
*
1 1
1 1
.(*, ,..., ): ( * *| ,..., ) 1 * ( | ,..., )
*
t
l l
l l
Curr t w w P T t W w W w f w w d
Q (6)
16
Thereby, the case of the distribution Fω(t|w1,…,wn) being a memoryless distribution is particularly interesting.
Exponential and geometric distributions constitute memoryless probability distributions and play an important role in data quality assessment. For instance, the exponential distribution is frequently discussed in the context of address data (cf. e.g., Heinrich et al. 2007). In the case of a memoryless probability distribution, the attribute value is characterized by a constant, relative decline rate zω(t|w1,…,wn). Hence, the distribution functions Fω(t|w1,…,wn) and F*ω(t*|w1,…,wn) and therewith Pω(Tt|W1=w1,…,Wl=wl) and Pω(T*t*|W1=w1,…,Wl=wl) are equal. Considering either the shelf life T and the age t (within the basic model) or the shelf life T* and the stor- age time t* (within the extended model) makes no difference and yields the same result:
) ,...,
|
* (
* ) ,...,
|
*
* ( 1 ) ,...,
|
* ( 1
) ,...,
|
* (
*) ,
,...,
| (
1 . 1
1 1
1
1 1 1
1
l Curr
l l l
l
l l l
l
w w t Q w W w W t T P w
W w W t T P
w W w W t T P t t T w W w W t T P
(7)
Hence, if we identify an (approximately) constant, relative decline rate zω(t|w1,…,wn) when determining
Fω(t|w1,…,wn), a memoryless distribution can be assumed. In that case, it is not necessary to know the instant of creation t0 of an attribute value ω; the instant of data entry t0* is sufficient to yield the same result.
3.4 Possible Ways to Develop Instantiations of the Metric
To instantiate the PBCM, it is necessary to determine the cumulative distribution function of the shelf life of the attribute values Fω(t|w1,…,wn), and, in this context, especially the corresponding attribute-specific decline rate zω(t|w1,…,wn). To do so, we scratch the following possibilities:
1. Analysis of publicly available data (e.g., from public or scientific institutions) 2. Analysis of company-owned (historical) data (e.g., from the data warehouse)
3. Conducting a study (e.g., surveying a sample of customers to determine the decline rate) 4. Surveying experts (e.g., determining the decline rate based on experts’ estimations)
The first possibility refers to the use of publicly available data. Here, data about factors which influence the de- cline rate of the data attribute considered have to be acquired (e.g., from federal statistical offices, public or sci- entific institutions). The attribute value “student”, for instance, can become outdated due to two main factors. A study is either completed or aborted. By means of publicly available data regarding both factors, the distribu- tion function Fω(t|w1,…,wn) can be determined (cf. next section). Attributes such as last name, marital status, and address may serve as further examples. The decline rates for last name and marital status can be deter- mined using publicly available data regarding marriages and divorces. The same holds for address and publicly available data regarding the frequency of relocation.
If no such third party data are available, company-owned (historical) data may be analyzed. This kind of analy- sis seems favorable, if assessing currency concerns company-specific data attributes. To determine the decline rate of the attribute current tariff, for instance, historical customer data could be extracted from the company’s operational databases or data warehouse. Based on this data extraction, the average duration of different con- tracts and tariffs can be calculated. Besides, the decline rate of the attribute address may also be determined based on company-owned data. If a company’s customers are characterized by specific characteristics, the analysis of company-owned data may have advantages over the analysis of publicly available data that often do not take into account such specific characteristics (e.g., seniors typically have a lower frequency of relocation).
Conducting a study is a further possibility to determine attribute-specific decline rates. Focusing, for instance, on assessing currency of a customer-specific attribute (e.g., the attribute employer of a customer), a random sample of the customer base can be drawn. These customers could be surveyed to get data on the shelf life of the attribute values considered. Such data can be used to determine both the decline rate and the distribution function. A short example considering the attribute employer, which is particularly important for financial ser- vices providers offering financial planning products, may illustrate this. If data are needed to determine the fre- quency of job changes, it is possible to draw a sample of customers and survey them. After determining the validity period of an employment, the decline rate and the distribution function can be calculated.
Finally, decline rates based on experts’ estimations can be used. This may be reasonable, if neither external nor internal data are available and conducting a study is too costly. These cases occur rarely because assessing cur- rency mostly concerns attribute values stored in existing databases (thus historical data should be available).
However, experts’ estimations are still relevant. Here, the Delphi method may be used which is a systematic, interactive method that relies on a panel of experts. For example, instead of using historical data, a company’s key account managers may be surveyed to determine the decline rate of the attribute current tariff.
After determining the distribution function and the corresponding decline rate which has to be done only once for each attribute considered, it is possible to develop instantiations of the PBCM (cf. next section). Then, the values of the metric can be calculated for all considered values of an attribute. Here, the input parameters of the metric in terms of available instants of creation, update, or acknowledgement and additional data wi are used for each attribute value ω. These input parameters can easily be extracted from the database and exported by means of SQL DML statements, provided they are stored. These data can be processed, for example, by a Java pro- gram that implements the PBCM and makes it possible to calculate its values for all attribute values.
18
4. EVALUATION OF THE PROBABILITY-BASED METRIC FOR CURRENCY
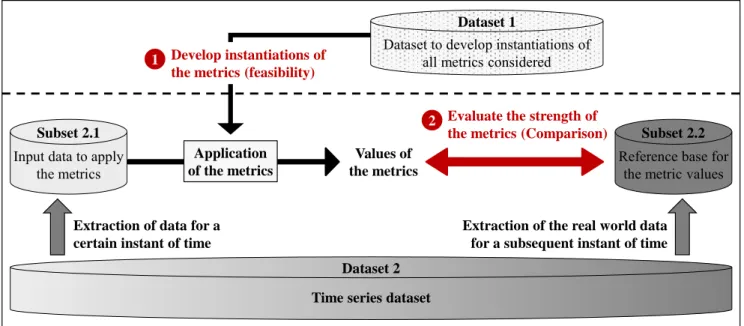
First, we demonstrate the applicability and the practical benefit of the PBCM by means of a case study. Second, the feasibility and the strength of the metric are analyzed based on publicly available data.
4.1 Evaluation of the Metric by Means of a Case Study
The goal of this evaluation step is to analyze the feasibility and the applicability as well as the practical benefit of the PBCM by means of a case study. The following evaluation questions are examined:
E.1 How can the PBCM be instantiated and applied in a real-use situation?
E.2 How can the values of the PBCM in terms of probabilities be integrated into a decision calculus?
E.3 What is the practical benefit resulting from the application of the PBCM?
4.1.1 Case Selection and Starting Point in the Case
The PBCM was applied in the campaign management at a major German mobile services provider. For reasons of confidentiality, figures and data had to be changed and made anonymous. Nevertheless, the procedure and the basic results remain unchanged. Both the sales & marketing and the data warehouse departments identified data quality issues in recent campaigns. These became especially apparent when – as a follow-up of a conduct- ed campaign – randomly selected customers were asked about the reasons why they did not accept the offer.
The survey showed that more than 33% of the selected customers no longer belonged to the focused target group of the campaign. This was due to outdated customer data that were used as selection criteria for the target group. Hence, a forthcoming student campaign was chosen to analyze whether and how the customer selection could be supported using the PBCM. The aim of this campaign is to offer customers with student status a new premium tariff called ForStudents 500 by mail. For reasons of price differentiation, this tariff is only available for customers who are actually students. Hence, the attribute value “student” is used as a criterion for the cus- tomer selection of this campaign. In case the attribute value “student” is outdated, this customer cannot accept the offer (confirmation of enrollment required). As a result of outdated data customers who have already fin- ished or abandoned their studies are included in the target group of the campaign. Selecting wrong customers, however, results in decreased customer satisfaction and low campaign success rates. To alleviate this problem, we initially analyzed the existing customer selection procedure for such campaigns:
1. All customers fulfilling the selection criterion (e.g., professional status = “student”) were identified. In the case of the student campaign considered, approximately 170,000 customers were selected.
2. For each of these customers the previous year’s sales volume was extracted because the higher the sales
volume of a customer accepting the offer the higher the additional returns resulting from the campaign. For the student campaign the additional return was estimated to be 6% of the customer’s previous sales volume.
3. Based on their previous sales volume, the top X% customers were selected to constitute the target group.
For the student campaign, the top 30% customers (i.e., 51,000 customers) were selected, which was a re- quirement of the marketing department (reasons of exclusivity and to strengthen customer loyalty).
In the past, the success rates of campaigns using this procedure averaged 9%. Thus, the number of customers accepting the offer was estimated at 4,590 (=9% . 51,000). The average sales volume of the top 30% customers was calculated to be EUR 1,470, resulting in an estimated additional return r per customer of EUR 88.20 on average (=EUR 1,470 . 6%). This was supposed to lead to a total additional return R of about EUR 404,838 (=4,590 . EUR 88.20) which was significantly higher compared to the estimated costs.
4.1.2 Adapted Selection Procedure and Instantiation of the Metric
To consider the values of the PBCM when selecting the target group, we defined an adapted procedure. This way, the decision was supported, for instance, regarding whether it made sense from an economic point of view to address a customer characterized by a low probability of still being a student who might therefore be unable to accept the offer. The customer database comprised approximately 170,000 customers with the attribute value
“student”. Hence, it was necessary to assess currency in a widely automated way and avoid a manual calcula- tion of each single value of the metric. The adapted customer selection procedure was defined as follows:
1. All customers fulfilling the selection criterion (e.g., professional status = “student”) were selected.
2. For each of these customers, the previous year’s sales volume was extracted.
3. For each of these customers, the individual value of the metric was calculated.
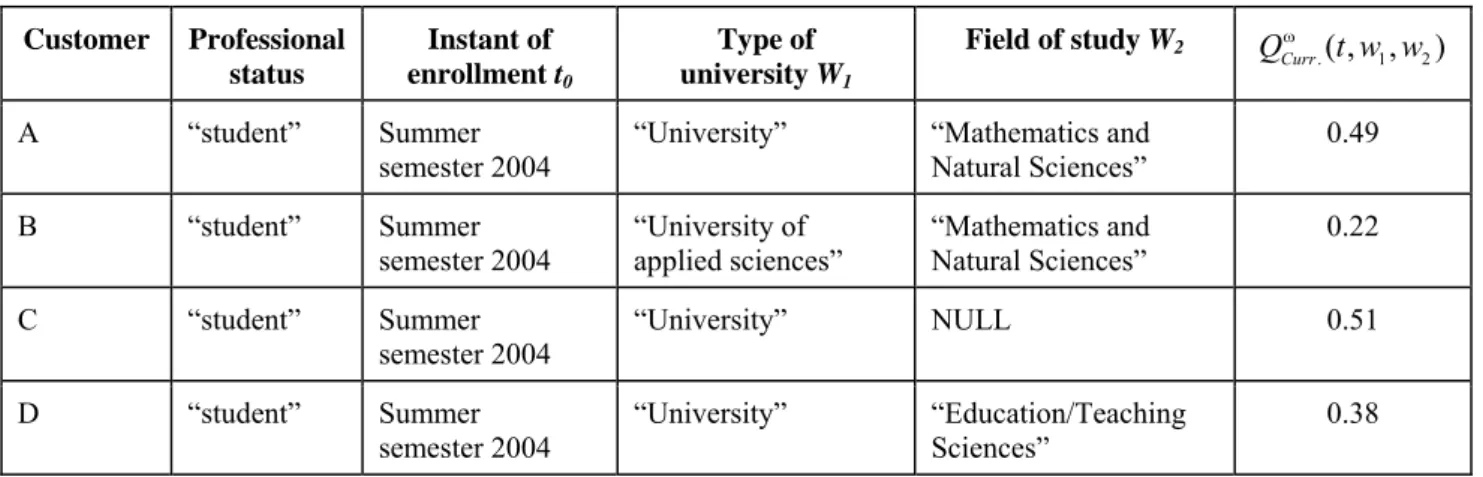
4. The sales volumes and the values of the metric in terms of probabilities were integrated into an expected value calculus; for each customer the expected value of the additional return E r( )QCurr .( , , ...,t w1 wn)r was calculated in an automated way and used as a criterion to identify the top 30% of customers.
The database of the mobile services provider comprised, among others, the attributes instant of enrollment (t0), type of university (W1), and field of study (W2). With respect to the PBCM, the values of the last two attributes could serve as additional data. The values w1 of the attribute type of university (W1) included “University” and
“University of applied sciences”. The values w2 of the attribute field of study (W2) came from the list “Econom- ics and Social Sciences”, “Engineering Sciences”, “Mathematics and Natural Sciences”, “Law”, “Agriculture, Forestry and Food Sciences”, “Education/Teaching Sciences”, “Linguistic/Philology and Cultural Sciences”,
20
“Art“, and “Health Sciences”. These values were retrieved during data acquisition where possible. However, they were not stored for all customers (represented by NULL in the database).
When developing the PBCM for the attribute value “student”, factors influencing its shelf life had to be deter- mined. This attribute value can lose its currency due to two factors: a study is either completed successfully or aborted. Hence, the PBCM had to take into account both factors by means of the corresponding conditional probability distributions depending on the age t of the attribute value and the values of the random variables W1
and W2 (additional data). The conditional distribution of the shelf life T, measured in number of semesters, could be determined easily based on publicly available data provided by the Federal Statistical Office of Ger- many (2005-2008) and the Higher Education Information System GmbH (Heublein et al. 2003, 2008).
0.00 0.20 0.40 0.60 0.80 1.00
1 2 3 4 5 6 7 8 9 10 11 12 13 14 15 16 ≥ 17
Cumulative relative frequency
Semester Study dropouts University / Education/Teaching Sciences
University / all fields of study
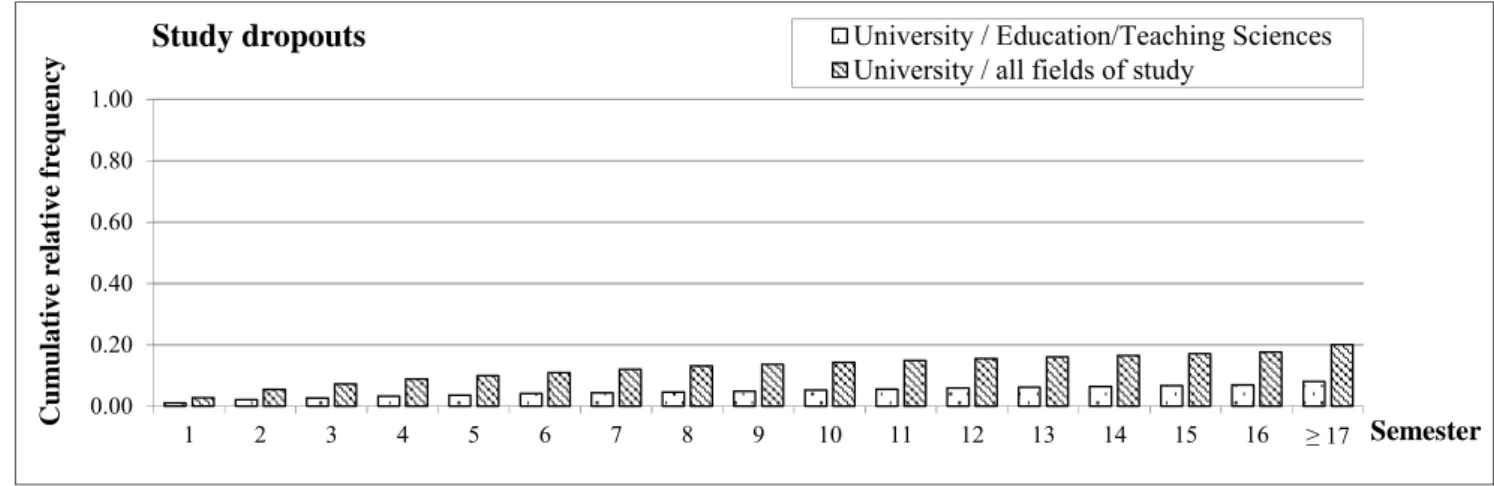
Fig. 3. Cumulative Relative Frequency Distributions of Study Dropouts
Figure 3 shows the cumulative relative frequency distributions of study dropouts at universities for Educa- tion/Teaching Sciences and over all fields of study. The frequencies depending on the type of university and the field of study could be calculated for each type of university by multiplying the fraction of study dropouts in the respective semesters with the corresponding overall dropout rate for the respective field of study. To be able to cope with unknown additional data it was necessary to calculate for each type of university the expected value regarding the field of study. Here, we used the weighted average of the cumulative relative frequencies over all possible values for the field of study. The fractions of the number of students in the particular field of study with respect to the overall number of students at the respective type of university served as weights. Based on this, it was possible to calculate the probability that a customer with the attribute value “student” had already dropped his or her studies after a duration of study of t semesters. The duration of study t was represented by the differ- ence between the instant of assessing currency (t1=start of the summer semester 2009) and the student’s instant of enrollment t0. This probability is referred to as the dropout probability P(Dropoutt|W1=w1,…,Wn=wn).