response is determined by cell cycle specific p21 degradation
Dissertation
zur Erlangung des akademischen Grades Doctor rerum naturalium
(Dr. rer. nat.) eingereicht an der
Lebenswissenschaftlichen Fakultät der Humboldt-Universität zu Berlin
von
M.Sc., Caibin Sheng
Präsidentin der Humboldt-Universität zu Berlin Prof. Dr.-Ing. Dr. Sabine Kunst
Dekan der Lebenswissenschaftlichen Fakultät Prof. Dr. Bernhard Grimm
Gutachter/innen: 1. Prof. Dr. Alexander Löwer 2. Prof. Dr. Andreas Herrmann 3. Dr. Jana Wolf
Tag der mündlichen Prüfung: 19. 12. 2017
Table of Contents
ABSTRACT / ZUSAMMENFASSUNG ... 1
ABSTRACT ... 1
ZUSAMMENFASSUNG ... 3
1 INTRODUCTION ... 5
1.1 P53 IS A KEY NODE IN THE CELLULAR STRESS-RESPONSE NETWORK ... 5
1.1.1 p53’s history and functions ... 5
1.1.2 Heterogeneous p53 dynamics in single cells ... 8
1.1.3 p53 dynamics control cell fate ... 9
1.2 P21 IS A MAIN EFFECTOR OF P53 IN THE DNA DAMAGE RESPONSE ... 12
1.2.1 p21 function and cell cycle ... 12
1.2.2 Multiple mechanisms mediate p21 degradation ... 13
1.3 METHODOLOGY ... 15
1.3.1 Technical limitations on measuring endogenous dynamics ... 15
1.3.2 CRISPR/Cas9 technology ... 16
1.4 AIMS OF THIS THESIS ... 17
2 RESULTS ... 20
2.1 ESTABLISHMENT OF CRISPR/CAS9 BASED TECHNOLOGY TO GENERATE ENDOGENOUS FLUORESCENT REPORTERS ... 20
2.1.1 Technical concept of CRISPR-Cas9-based knockin ... 20
2.1.2 CRISPR-Cas9 enables genome editing ... 21
2.1.3 Insertion frequency is increased by optimizing cleavage efficiency... 24
2.1.4 Length of homology regions in repair template determines the insertion efficiency ... 27
2.1.5 Off-target effects are not detected ... 28
2.2 ESTABLISHING A COMBINED REPORTER TO MONITOR P53 AND P21 DYNAMICS ... 29
2.2.1 Tagging a single allele is sufficient to monitor p53 dynamics ... 29
2.2.2 Fluorescent reporter faithfully reflects endogenous p53 level ... 31
2.2.3 Reporter cells show unaltered p53 responses to DNA damage ... 32
2.2.4 Reporter cells show no differences in cell fates after damage ... 33
2.2.5 Establishment of a combined reporter to simultaneously monitor p53 and p21 34 2.3 CELL SPECIFIC DEGRADATION LEADS TO CELLULAR HETEROGENEITY IN THE DNA DAMAGE RESPONSE ... 36
2.3.1 Cells exhibit heterogeneity in response to DNA damage ... 36
2.3.2 X-ray irradiation induces homogeneous p53 dynamics but heterogeneous p21 dynamics ... 39
2.3.3 A shape-based distance allows quantifying similarities of dynamics between cells ... 42
2.3.4 Two subgroups of distinct responses are identified ... 47
2.3.5 p21 responses depend on cell cycle phase at the time of damage ... 49
2.3.6 Deep clustering reveals more refined p21 responses ... 51
2.3.7 Combination of EdU labelling and semi-supervised classification allows endpoint cell cycle analysis ... 54
2.3.8 Cells with different p21 dynamics tend to end up with divergent cell cycle phases ... 57
2.3.9 p21 dynamics are related to cell fate decisions ... 58
2.3.10 PCNA-mediated degradation leads to the majority of cell-to-cell variations .. 64
3 DISCUSSION ... 68
3.1 CRISPR/CAS9 BASED GENOME ENGINEERING IS A ROBUST TOOL TO FAITHFULLY TAG AND EFFICIENTLY MODIFY ENDOGENOUS PROTEINS ... 68
3.2 SHAPE-BASED CLUSTERING CAN EFFICIENTLY CLASSIFY CELLULAR DYNAMICS ... 71
3.3 ENDPOINT ASSAY ENSURES LINKING DYNAMICS TO CELL FATE DECISIONS FOR INDIVIDUAL CELLS ... 72
3.4 REGROUPING CELLS UPON BOTH DYNAMICS AND CELL FATE DECISIONS HIGHLIGHTS
CELL CYCLE SPECIFIC HETEROGENEITY ... 74
3.5 INSIGHTS AND CHALLENGES IN INVESTIGATION OF CELLULAR HETEROGENEITY ... 78
4 METHODS AND MATERIALS ... 80
4.1 CELL CULTURE ... 80
4.2 PLASMIDS AND CLONING ... 80
4.3 T7 ENDONUCLEASE I ASSAY ... 82
4.4 ENDOGENOUS TAGGING IN MCF10A ... 83
4.5 TIME-LAPSE MICROSCOPY ... 83
4.6 IMAGE ANALYSIS ... 84
4.7 SHAPE-BASED CLUSTERING ... 84
4.8 CELL CYCLE ANALYSIS ... 85
4.9 IMMUNOFLUORESCENCE... 86
4.10 IMMUNOBLOTTING ... 87
5 REFERENCES ... 88
6 APPENDIX ... 96
6.1 LIST OF ABBREVIATIONS ... 96
6.2 LIST OF PRIMERS ... 98
6.3 LIST OF SGRNA TARGETS ... 101
6.4 SEQUENCES OF CONSTRUCTS ... 103
6.5 SINGLE CELL TRAJECTORIES ... 109
ACKNOWLEDGEMENTS ... 111
SELBSTSTÄNDIGKEITSERKLÄRUNG ... 112
1 Abstract
The cellular response to a given stimulus is not only governed by the stimulus itself, but also depends on the state of the cells. Cell cycle phase, protein levels or microenvironment delineate a unique state for each individual cell. This results in heterogeneous behavior of genetically identical cells. Understanding cell-to-cell variability requires linking different cellular responses to defined cellular states. In this thesis, I established a framework to study how the cellular response to DNA damage is affected by varying cell states and to identify the underlying molecular mechanisms.
To this end, I established a CRISPR/Cas9 based technique to generate fluorescent reporters for endogenous signaling proteins in non-transformed breast epithelial cells (MCF10A) and applied it to simultaneously measure the dynamics of the tumor suppressor p53 and one of its target genes, the cell cycle inhibitor p21 by time-lapse microscopy. Using this approach, I observed highly heterogeneous p21 responses to DNA damage in individual cells. To reveal hidden information from the observed phenotypes, I developed a shape-based clustering approach and identified four distinct subpopulations of characteristic p21 dynamics. To examine the source of cell-to-cell variability, I analyzed cell divisions prior to irradiation to estimate initial cell cycle states, followed by EdU labeling and a semi-supervised classification to determine the cellular state 24h post damage. This allowed me to demonstrate how initial cell cycle phase and cell cycle progression shape p21 dynamics by regulating protein stability and how this determines the cellular response to damage. Furthermore, to identify molecular mechanisms shaping the p21 response, interaction between the cell cycle inhibitor and proliferating cellular nuclear antigen (PCNA), a cell cycle dependent factor, was blocked by introducing mutation in the binding domain of p21 using CRISPR-Cas9 based genome engineering.
This led to relatively homogenous p21 dynamics in response to damage, independent of cell cycle phase.
Overall, my project provides a pipeline to study at the single cell level how cellular response is affected by cell states. Considering that cellular heterogeneity leads to
2 fractional killing in tumor therapies, this approach also suggests future application on studying drug-resistance in cancer therapy.
3 Zusammenfassung
Die zelluläre Antwort auf einen spezifischen Stimulus wird nicht nur durch den Stimulus selbst, sondern insbesondere auch von dem gegebenen Zustand der Zelle bestimmt. Die jeweilige Zellzyklusphase, die Konzentration der relevanten Proteine sowie die Mikroumgebung bestimmen einen einzigartigen Zustand für jede individuelle Zelle.
Daraus resultiert ein heterogenes Verhalten von genetisch identischen Zellen. Um ein tieferes Verständnis für die große Variabilität in einer Zellpopulation gewinnen zu können, ist es notwendig, die verschiedenen zellulären Antworten mit definierten zellulären Zuständen in Verbindung zu bringen. In dieser Arbeit wurde ein System etabliert, welches es zum einen ermöglicht, die zelluläre Antwort auf DNA-Schäden und den Einfluss unterschiedlicher zellulärer Zustände zu studieren und zum anderen die zu Grunde liegenden molekularen Mechanismen zu identifizieren.
Im Zuge dessen wurde eine auf CRISPR/Cas9 basierende Methode entwickelt, mit Hilfe derer Fluoreszenzreporter für endogene Signalproteine in nicht transformierten Brustepithelzellen (MCF10A) generiert wurden. Anhand dieses Reportersystems konnte durch time-lapse Mikroskopie die Dynamik des Tumorsuppressors p53 und gleichzeitig eines seiner Zielgene, des Zellzyklusinhibitors p21, verfolgt werden. Dabei wurde deutlich, dass die p21 Antwort der individuellen Zellen auf DNA-Schäden sehr heterogen ausfällt.
Um mehr Informationen zu den verschiedenen Phänotypen zu gewinnen, wurde eine Form-basierte Gruppierungsmethode entwickelt und vier verschiedene Subpopulationen mit charakteristischen p21 Dynamiken identifiziert. Um den Einfluss der Zellzyklusphase zu untersuchen, wurde die Zellteilung vor Bestrahlung analysiert und so Rückschlüsse auf die initiale Zellzyklusphase gezogen. 24h nach Bestrahlung wurde ein EdU labeling durchgeführt und der Zellzyklus mittels semi-supervised Klassifizierung bestimmt. Mit Hilfe dieser Technik konnte demonstriert werden, wie der Zellzyklus durch Regulation der Proteinstabilität die p21 Dynamiken formt und auf diese Weise die Schadensantwort der Zelle bestimmt. Weiterhin wurden molekulare Mechanismen identifiziert, welche die p21 Antwort beeinflussen. Hierfür wurde die Interaktion zwischen p21 und dem proliferating cellular nuclear antigen (PCNA), einem Zellzyklus-abhängigen Faktor, verhindert, indem eine Mutation in der Bindedomäne von p21 durch CRISPR-Cas9 basiertes Genome Editing eingeführt wurde. Dies führte zu einer relative homogenen p21 Dynamik als Antwort auf Schaden, unabhängig von der Zellzyklusphase.
4 Alles in allem bietet mein Projekt eine Pipeline, um auf Einzelzellebene zu erforschen, wie zelluläre Antworten durch den Zellzyklus beeinflusst werden. Dieser Ansatz könnte zukünftig Anwendung in der Erforschung von Medikamentenresistenz finden, insbesondere da zelluläre Heterogenität in der Tumortherapie zu fractional killing führt.
5 1.1 p53 is a key node in the cellular stress-response network
1.1.1 p53’s history and functions
p53 (encoded by Tp53 in human and by Trp53 in murine animals) was first discovered in 1970s (Linzer & Levine 1979; Lane & Crawford 1979), during which period cancer- causing viruses were a hot topic in cancer research (Levine & Oren 2009; Kastenhuber &
Lowe 2017). Many oncoproteins were identified by examining proteins overexpressed in cancer virus-induced tumors. These oncoproteins included viral proteins and cellular proteins that may be induced indirectly by viral proteins. A 53 kDa host protein was found to form complexes with simian virus 40 (SV40) large T antigen in transformed cells (Linzer & Levine 1979; Lane & Crawford 1979). Subsequent research reported that the same protein was also detected in non-virus transformed cancer cells but not in normal cells (DeLeo et al. 1979; Rotter 1983). Naturally this protein was presupposed as an oncoprotein and named p53 as an identical nomenclature in a conference seeing that independent laboratories used different names causing confusions (Levine & Oren 2009).
p53 cDNA was further cloned and overexpression of it caused tumorigenesis in normal tissue (Eliyahu et al. 1984; Jenkins et al. 1984), supporting a role as an oncoprotein.
Surprisingly, some scientists observed tumor suppressor properties of p53. For example, Ben David and his colleagues found that p53 was inactivated in murine erythroleukemic cell lines induced by Friend leukemia virus (Ben David et al. 1988). Rotter and his colleagues also observed that p53 was deleted in HL-60 cells, which are derived from human leukemia (Wolf & Rotter 1985). More convincingly, when comparing sequences of p53 cDNA from different resources, several laboratories found that most of the published p53 cDNA which were often generated from tumor cells carried mutations in coding sequence and wild type p53 from normal tissue failed to exhibit oncogenic activity (Eliyahu et al. 1988; Finlay et al. 1989; Halevy et al. 1991). Since then, p53 was widely accepted as a tumor suppressor and regarded as ‘the guardian of the genome’ because of its irreplaceable role in maintaining genome stability (Efeyan & Serrano 2007).
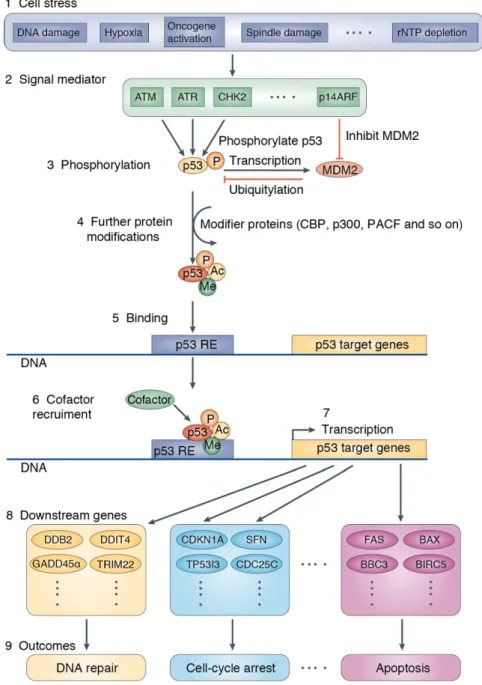
How does p53 work as ‘the guardian’? The p53 network responds to various stress signals, including DNA damage, hypoxia, spindle damage and replication stress induced by dysregulated oncogenes (Figure 1) (Riley et al. 2008). These stresses can activate p53 by distinct mechanisms. For example, DNA damage activates upstream kinases, such as ATM
6 (ataxia-telangiectasia mutated kinase) and ATR (ataxia telangiectasia and Rad3-related protein), which then trigger the p53 pathway by phosphorylating p53 protein and inhibiting its negative regulator Mouse double minute 2 homolog (Mdm2) (Shieh et al.
1997), whereas oncogenic signals inhibit Mdm2 by ARF tumor suppressor (Zhang et al.
1998). After further modifications, such as acetylation, p53 can bind to specific DNA sequences, so called p53 response element (p53 RE). Together with other cofactors, such as CBP and p300, p53 drives the transcription of target genes to counteract tumorigenesis.
For example, p53-mediated induction of cyclin-dependent kinase inhibitor 1A (CDKN1A, encoding p21) halts cell cycle to permit the repair of undesired DNA damage (El-Deiry et al. 1993). Besides, BCL2-binding component-3 (BBC3), another p53 target gene, promotes apoptosis in response to p53 activation in cancer cells (Nakano & Vousden 2001; Yu et al.
2001). Although promoting cell cycle arrest and apoptosis are the best-studied functions of p53, many researches suggest that p53 is also involved in other ‘non-canonical’
programs (Kastenhuber & Lowe 2017). For instance, p53 can regulate autophagy (Maiuri et al. 2010), govern metabolic pathways (Kruiswijk et al. 2015) and suppress pluripotency (Lin & Lin 2017). p53 governs these alternative programs by controlling the expression of different sets of target genes (Kastenhuber & Lowe 2017). Benefiting from the development of high throughput ‘-omics’, specifically transcriptomics, thousands of p53 targets were identified although a recent effort revealed that probably only about 60 targets were found consistently among 16 genome-wide datasets (Fischer 2017).
Nevertheless, it is widely accepted that p53 is crucial for keeping cellular ‘health’ and its responses can vary in different cell types depending on specific stimuli and distinct cellular states (Kastenhuber & Lowe 2017).
7
Figure 1 Mechanisms of p53 activation and regulation of cellular outcomes (Riley et al. 2008)
8 1.1.2 Heterogeneous p53 dynamics in single cells
New technologies are usually the key to answering open questions. The emergence of live- cell imaging (Figure 2) facilitated the understanding of how p53 responds to stress and how cells determine outcomes by intricate p53 dynamics. This technology and subsequent computational analysis shed light on single cell behaviors and revealed that the p53 dynamics of each cell are different (Lahav et al. 2004; Loewer et al. 2010; Loewer
& Lahav 2011).
Figure 2 Measuring cellular dynamics using fluorescent reporters and time-lapse microscopy Proteins of interests can be fluorescently tagged and measured with an interval of seconds to minutes. This generates large datasets of time-series images. By processing these images using automated segmentation and tracking algorithms, each cell can be isolated and followed over time, resulting in measurements of protein dynamics for thousands of individual cells from a single experiment.
Under normal conditions, transient DNA damage in cells trigger spontaneous p53 pulses.
Averaging spontaneous p53 pulses in a population of cells gives the impression of stable steady-state levels. (Figure 3). In response to double strand DNA breaks (DSBs) induced by -irradiation, cells show repeated p53 pulses and the pulse frequency is heterogeneous in single cells although the pulse features (such as the amplitudes and durations) are usually constant (Lahav et al. 2004; Loewer et al. 2010; Loewer & Lahav 2011). This gives the appearance of damped p53 oscillations at the average level (Figure 3), which are usually observed in population level studies, such as western blot. These fascinating observations highlighted the importance of single cell investigations and led to further
9 questions why cells behave differently and how heterogeneity affects the cellular outcome to a given stress.
Figure 3 Single cell studies revealed heterogeneous p53 dynamics (Loewer & Lahav 2011)
1.1.3 p53 dynamics control cell fate
Besides the aforementioned two types of p53 dynamical patterns, cells can also show sustained p53 dynamics after UV-irradiation (Batchelor et al. 2011). More interestingly, it seems that these differential dynamics associate with cellular outcomes. As shown in Figure 4, cells showing spontaneous p53 pulse are able to proliferate afterwards (Loewer et al. 2010); DSBs induced by -irradiation trigger a series of p53 pulses, most likely followed by transient cell cycle arrest and recovery (Loewer et al. 2010; Purvis et al. 2012), whereas UV-irradiation causes sustained p53 accumulation, sending cells to apoptosis (Batchelor et al. 2011; Purvis et al. 2012). However, these different types of dynamics are generated under different conditions, making it difficult to prove that there is a causal link from p53 dynamics to cell fate decisions (Purvis & Lahav 2013) due to the fact that different stimuli might influence the cellular outcomes by affecting other networks. In this context, Jeremy E. Purvis and co-workers artificially altered pulsing p53 to sustained p53 in -irradiation-damaged cells by using timed doses of the small molecule Nutlin-3, which stabilizes p53 by inhibiting the interaction between p53 and its negative regulator Mdm2, and observed cell senescence instead of cell cycle arrest (Purvis et al. 2012). This observation supported the hypothesis that different p53 dynamics are correlated to different cellular outcomes.
10 Why does p53 show distinct dynamics in response to -irradiation and UV-irradiation?
This can be explained by the difference in p53 feedback loops (Figure 4). Both stimuli can activate p53 and its negative feedback loops, Mdm2 and p53-induced Phosphatase 1 (Wip1). However, -irradiation induced ATM can be dephosphorylated by Wip1 (Shreeram et al. 2006) and thereby further downregulate p53 (Lu et al. 2007). The Wip1 loop is responsible for generating oscillating p53 in response to -irradiation as was shown by the knockdown of Wip1, which generates UV-like p53 dynamics (Batchelor et al. 2008).
Figure 4 p53 dynamics control cellular outcomes in response to different stimuli
The next question that arises when deciphering p53 dynamics is how they influence cellular outcomes. In a previously discussed report, expression of senescence genes increased after pulsed p53 accumulation was switched to sustained p53 accumulation (Purvis et al. 2012). This suggests that different dynamics might lead to the expression of different sets of genes. However, how p53 dynamics affect the expression of its targets is still unclear. A recent report suggests that the mRNA decay rate determines the dynamics of p53’s target genes (Porter et al. 2016). In response to pulsed p53, slow-decaying mRNAs would sustainably accumulate whereas fast-decaying mRNAs might not be able to accumulate once the production rate is slower than decay rate. Sustained p53 increases
11 the production rate so that the fast-decaying mRNAs can accumulate to an extent that allows them to elicit the corresponding cellular effect. This might provide some clues on how cells choose target genes in response to different p53 dynamics. The protein level of p53’s targets, however, is also influenced by other factors, in particular post-translational modifications (PTMs). Provided the complexity of signaling networks, one can assume that some, if not all, of these modifications might be p53-independent and cell state specific. In addition, even for a given stimulus, p53 dynamics are heterogeneous in individual cells. The number of p53 pulses, for example, is varying from cell to cell in response to -irradiation (Lahav et al. 2004; Loewer et al. 2010; Loewer & Lahav 2011).
How exactly do cells integrate p53 dynamics and cellular state to make proper decisions in response to a fixed stimulus?
12 1.2 p21 is a main effector of p53 in the DNA damage response
1.2.1 p21 function and cell cycle
Cyclin-dependent kinase inhibitor 1A (CDKN1A, encoding p21), was identified as one of downstream genes of p53 (El-Deiry et al. 1993). The best-understood function of p21 is to regulate cell cycle progression. Loss of control of cell cycle in mammalian cells can cause onset of tumorigenesis. Thus, cells have evolved multiple checkpoints to govern cell cycle progression. On the molecular level, cell cycle transition from G1 phase to S phase and G2 phase to mitosis is regulated by activation and inactivation of cyclin-dependent kinase (CDK) family of proteins, which are activated by binding to cyclins(Vermeulen,K.,Van Bockstaele,D.R.,Berneman et al. 2003). As a CDK inhibitor, p21 is one of the checkpoint regulators in cell cycle control. Induction of p21 by p53 upon DNA damage inhibits cyclin E and CDK2 complex and thereby prevents G1-S transition (Figure 5) (Di Leonardo et al.
1994; Neganova et al. 2011). p21 can also potentially inhibit cyclin B1 and CDK1 complex and lead to G2 arrest (Figure 5) (Charrier-Savournin et al. 2004; Bunz 1998). On the contrary, a study in mouse embryonic fibroblasts suggested that p21 can promote proliferation (Warfel & El-Deiry 2013). When increasing p21 by mitogen stimulation to a level that is not sufficient to lead to cell cycle arrest, p21 was found to promote the assembly of cyclin D-CDK4 complexes (Cheng 1999). These together suggest that p21 might have dual roles of either inhibiting cell growth or promoting proliferation depending on its concentration in the nucleus.
In addition, p21 can bind to proliferating cell nuclear antigen (PCNA) through the PCNA- interacting peptide box (PIP box) in p21 C-terminus (Havens & Walter 2009). Since p21 competes for binding to PCNA with other components, such as DNA polymerase- and -, which are involved in DNA synthesis, it indirectly inhibit DNA replication (Karimian et al.
2016; Romanov & Rudolph 2016). Many other proteins having the PIP box structure are probably affected by this competition and therefore cellular activities might also be altered indirectly by expression of p21. For example, interference of PCNA-DNMT1 by p21 cause DNA repair inhibition (Mortusewicz et al. 2005).
Paradoxically, p21 is also involved in apoptosis. On one hand, p21 can inhibit apoptosis by several potential mechanisms. For example, it binds and inhibits JNK1/SAPK kinase and MAPK-kinase-kinase ASK1/MEKK5 and thereby suppress apoptosis (Huang et al. 2003).
13 On the other hand, p21 was reported to promote apoptosis. It was shown to induce the expression of genes that initiate apoptosis in human ovarian cancer cells in a p53- independent manner (Wu et al. 2002). Other research showed that p21 can be cleaved by caspase-3 and this leads to apoptosis of cancer cells (Zhang et al. 1999).
Figure 5 p21 has multiple functions
In summary, p21 can inhibit the activities of cyclin/CDK complex to cause cell cycle arrest.
Besides, p21 was also reported to inhibit DNA synthesis and DNA repair and to promote apoptosis. However, these functions are still in debate and some of them are even contrary.
Considering the linking between dynamical features of p53 and various cellular outcomes, it is logical to ask whether p21 dynamics control its complicated functions.
1.2.2 Multiple mechanisms mediate p21 degradation
Since p21 has multiple functions, its level in cells should be accurately regulated to activate proper cellular responses. To achieve this, cells have developed multiple mechanisms to degrade p21.
The first one is SCFSkp2, which can degrade p21 to promote cell cycle transitions. SCF complexes are a subfamily of the cullin-RING ubiquitin ligase (CRL) superfamily (Petroski
& Deshaies 2005). SCFSkp2 is believed to be a major regulator of p21 (Starostina & Kipreos 2012). This complex can decrease p21 levels in late G1 phase and early S phase, which upregulates cyclin/CDK activity to promote S phase entry (Li & Jin 2010). To accomplish this, cells upregulate Skp2 levels in late G1 and early S phase by inactivation of APCCdh1 or / and disassociation of Skp2 and APCCdh1 through cyclin / CDK2 complexes which become
14 active in late G1 phase (Bashir et al. 2004; Lukas & Bartek 2004; Rodier et al. 2008;
Guardavaccaro & Pagano 2006).
In addition to SCFSkp2, another member of CRL family, CRL4Cdt2 can mediate p21 degradation in S phase. A cell cycle specific factor, PCNA is involved in this process. During S phase, PCNA forms foci on chromatin and this form of PCNA can bind to PIP box in p21 so that this complex is able to recruit CRL4Cdt2 to promote the ubiquitin-dependent degradation of the complex (Abbas & Dutta 2011; Havens & Walter 2009).
APC/CCdc20, which is also an E3 ubiquitin ligase, can degrade proteins, including p21, during mitosis to permit progression through mitosis. APC/CCdc20 becomes active during mitosis and degrades p21 during prometaphase (Amador et al. 2007), which allows activation of cyclin/CDK1 during mitosis ensuring subsequent mitosis (Starostina &
Kipreos 2012).
Mdm2 and MdmX can mediate ubiquitin-independent degradation of p21. Mdm2/MdmX promote the degradation of p21 in G1 and early S phase by binding and bringing both p21 and the proteasome together (Jin et al. 2008). The 14-3-3 and C8 subunit of the 20S proteasome are involved in Mdm2-mediated degradation (Wang et al. 2010), and this degradation was reported to promote G1-S transition (Starostina & Kipreos 2012).
Besides, there are also other degradation mechanisms that are less well defined. An interesting mechanism among them is p53-inducible RING-finger protein (p53RFP), which can be induced by p53 and target p21 degradation in response to DNA damage (Ng et al. 2003). But it is worth stressing that p53RFP only has a relatively modest effect on p21 (Ng et al. 2003). Nevertheless, its activation by DNA damage was shown to decrease the number of G1 arrested cells and promote apoptosis (Ng et al. 2003). However, p53RFP- mediated degradation is still not well characterized and needs further investigation. The E3 Makorin RING Finger Protein 1 (MKRN1) is another potential factor to mediate p21 degradation. In response to DNA damage, MKRN1 was shown to promote apoptosis by decreasing p21 (Lee et al. 2009).
In DNA damage response, p53 is one of the most important key nodes and p21 is the key effector of p53. After DNA damage, p53 is activated but its transcriptional activity is determined by other factors, such as post-translational modifications and the cofactors
15 required for transcription (Figure 1 and Figure 5), and these factors might be varying in single cells, leading to different expression of p21 mRNA. Moreover, the protein level of p21 is also controlled by multiple degradation mechanisms, some of which are dependent of cell cycle phase. SCFSkp2 and Mdm2, for example, mediate p21 degradation in late G1 phase and early S phase whereas APC/CCdc20 drives the degradation of p21 during mitosis (Starostina & Kipreos 2012). These together address the question how p21 responds to DNA damage in single cells and whether it is affected by cellular state.
1.3 Methodology
1.3.1 Technical limitations on measuring endogenous dynamics
To measure p53 and p21 dynamics in live cells, I first need to create faithful fluorescent reporters. The reliability of results is determined by the quality of fluorescent reporters.
Over recent years, transgenic reporters, which are usually created by randomly inserting an artificially created construct in the genome of cell, were widely used to follow signals of selected signaling proteins (Lahav et al. 2004; Tay et al. 2010; Cohen-Saidon et al. 2009).
However, severe limitations exist when using this technique (Figure 6). In detail, these constructs may cause perturbation of the signaling network of interest because another copy of a gene was introduced in the cells. The constructs may also miss important elements, such as key regions of the promoter, untranslated regions and introns, makes it difficult to capture the complex regulation of the selected protein. In addition, establishing a stable transgenic reporter is also time-consuming due to the need for extensive validation. The solution to these issues is to create endogenous reporters (Figure 6).
16
Figure 6 Labelling endogenous genes in principle permits more accurate measurements
1.3.2 CRISPR/Cas9 technology
Tagging endogenous genes requires precisely cutting the target genomic loci to insert exogenous DNA sequences. In recent years, a number of genome editing technologies have emerged, including zinc-finger nucleases (ZFNs) (Miller et al. 2007), transcription activator-like effector nucleases (TALENs) (Wood et al. 2011) and the RNA-guided clustered regularly interspaced short palindromic repeats (CRISPR) / CRISPR associated 9 (Cas9) system (Mali, Aach, et al. 2013; Cong et al. 2013; Jinek et al. 2012; Jinek et al.
2013). The first two employ a strategy of coupling endonucleases with DNA-binding proteins to induce DSBs at desired genomic loci. There are several potential disadvantages, such as limited target sites, high off-target effects and costly construction of DNA binding domains (Gupta & Musunuru 2014). By contrast, CRISPR/Cas9 system is composed of a small single-guide RNA (sgRNA) and Cas9 endonuclease. The sgRNA contains a constant trans-activating CRISPR RNA (tracrRNA) part which can bind to Cas9 and a CRISPR RNA (crRNA) part with ~20 nucleotides which can form heteroduplex with target DNA through Watson-Crick base pairing (Figure 7A) (Jinek et al. 2013; Nishimasu et al. 2014; Anders et al. 2014). Cas9 endonuclease recognizes protospacer adjacent motif (PAM, 5’- NGG-3’ or 5’- NAG-3’)-proximal region on genomic DNA and tracrRNA part of sgRNAs to form Cas9-sgRNA complex. This complex further recognizes target DNA complementary to crRNA part of sgRNA and introduces double strand cleavage (Nishimasu et al. 2014; Anders et al. 2014). Since sgRNAs have a small size and high affinity to the DNA, this system has low cost and high efficiency (Sander & Joung 2014).
Cleavage of DNA will trigger two main DNA repair pathways, including nonhomologous end joining (NHEJ) or homology-directed repair (HDR) (Ciccia & Elledge 2010). The former is an error prone pathway, likely causing gene knockout by insertion or deletion base pairs (Figure 7B). The HDR pathway will allow precise repair in presence of a repair template (Figure 7B). Taking advantage of HDR, one can precisely edit genomic DNA by combining a well-designed repair template with CRISPR/Cas9. Therefore, I first proposed to adapt this technique to establish a platform for creating endogenous reporters.
17
Figure 7 CRISPR/Cas9 based genome editing (F Ann Ran et al. 2013) Figure A is slightly modified, crRNA is colored blue and green; tracrRNA is colored red.
1.4 Aims of this thesis
Cellular and molecular behaviors are observed heterogeneous in genetically identical cells (Loewer & Lahav 2011; Spencer et al. 2009; Pelkmans 2012; Snijder & Pelkmans 2011).
Cellular state (such as cell cycle phase), microenvironment and stochastic fluctuations are the main origins leading to cell-to-cell variations (Loewer & Lahav 2011). To characterize the influence of these factors and to study the molecular mechanisms behind will improve the understanding of signaling network and allow us to predict cellular behaviors. In my thesis, I aimed to study how cellular state influences cell responses to DNA damage. To
18 reduce the complexity, all live-cell imaging experiments were performed in a single cell line, human mammary epithelial cell MCF10A and upon a single stimulus, -irradiation- induced double strand DNA damage. During DNA damage response, p53-mediated p21 induction plays an important role in cell cycle regulation and protein level of p21 can be regulated by multiple factors, some of which are cell cycle related (Figure 5 and Figure 8).
To fully understand how and at what states complexities of factors control p21 level, a quantitative measurement of endogenous levels is required. CRISPR/Cas9 technology provides the possibility to endogenously label both p53 and p21 and thereby could allow quantifying their dynamics in combination with time-lapse microscopy. In summary, to approach the aim of my thesis, three specific questions were addressed:
1) Do fluorescent reporters generated by CRISPR/Cas9 faithfully reflect the endogenous protein levels?
2) How do endogenous p53 and p21 respond to DNA damage in single cells?
3) Do cellular states influence p53-p21 dynamics?
Figure 8 How does cellular state influence p53-p21 dynamics and cellular outcomes in response to DSBs? During DNA damage response, p53 is activated and induces the expression of CDK1NA, which
19
encodes p21 to mediate cell cycle arrest and other cellular outcomes. p21 levels are controlled by many factors, such as the transcription regulations and post-translational regulations, which might depend on cellular state.
20 2.1 Establishment of CRISPR/Cas9 based technology to generate endogenous
fluorescent reporters
2.1.1 Technical concept of CRISPR-Cas9-based knockin
As a start, I first developed a strategy to create fluorescent reporters using CRISPR/Cas9 technology. As shown in Figure 9 for a given target of interest, the stop codon-containing exon will be targeted to create C-terminal fusion proteins. Guide RNA then will be designed to cut at or around stop codon together with Cas9. This will create double strand DNA breaks and trigger DNA repair pathways including non-homologous end joining (NHEJ) and homology directed repair (HDR), the latter of which will allow precise genetic modification in presence of a donor DNA. Design of donor DNA will be a key to achieve functional reporter. The exogenous fragment has to be in front of endogenous stop codon, ensuring that it is part of the open reading frame of the target. This can be achieved by flanking the insertion fragments with two homologous arms (HAL and HAR), which are separately identical to genomic sequences in front of and after stop codon (include stop codon). The coding sequence of a fluorescent protein is present right after the left homologous arm (HAL), followed by a selection element consisting of two Loxp sequences, a self-cleavage peptide (P2A) and neomycin resistance gene. After G418 selection, only precisely-engineered cells survive because the random insertions unlikely have the resistance due to the low chance of being inserted after a functional promoter.
The selection marker then turns to be a redundancy and may influence mRNA activity, so Cre-recombinase will be delivered into cells to remove it, leaving a fluorescent gene and a remaining loxp sequence (34 bps) in front of stop codon. The whole protocol allows inserting necessary and minimal sequences in order to fluorescently tag endogenous genes.
21
Figure 9 Conceptual framework of CRISPR-Cas9-mediated knockin
Blue boxes represent the exons, between which are introns. Stop codon is indicated by a narrow box in black.
HAL: the left homologous arm; HAR: the right homologous arm; FP: the gene encoding fluorescent protein;
P2A: a self-cleavage peptide; Neo: neomycin resistance gene; 3’UTR: 3-untranslated region.
2.1.2 CRISPR-Cas9 enables genome editing
To test the strategy developed above, I chose the p53 locus to conduct proof-of-concept experiments. First, three sgRNAs were designed to target human p53 (Figure 10A). There were three approaches to deliver Cas9 and sgRNAs reported in the beginning (F Ann Ran et al. 2013; F. Ann Ran et al. 2013). First, sgRNA and Cas9 were transfected in separate plasmids, named two vector system (2-Vec.); second, Cas9 was delivered in plasmid and sgRNA was delivered as a PCR product, named PCR system (PCR); third, Cas9 and sgRNA was integrated into a single vector, called one-vector system (1-Vec.). I experimentally tested all three approaches on a same target (p53-T5) in HEK293 and quantified the cleavage efficiency by T7 endonuclease I assay (Figure 10B) (White et al. 1997). The results showed that the two-vector system had equal efficiency to one-vector system (both induced about 50% indel formation) and PCR system was significantly inefficient (Figure 10C). Considering that two-vector system had more flexibility to adapt other versions of Cas9, I chose this system as a standard to deliver CRISPR/Cas9 constructs in all further experiments.
22 Usually, a target region can have several potential target sites such T5, T8 and T14 at the p53 locus (Figure 10A). As these sequences may provide different affinities for corresponding sgRNAs, they could potential results in varying efficiencies of DNA cleavage. To test this, I separately transfected three sgRNAs together with Cas9 in HEK293 and observed that sgRNA_p53-T5 induced most mutations, and the other two showed significantly lower efficiency (Figure 10D). In addition, Cas9 was replaced with a nickase version (Cas9n) of Cas9, which can generate sticky DNA breaks when coupling with a pair of sgRNAs, such as T5 & T8 and T5 & T14 (double nicking, Figure 11A). Cas9n showed low level of indel formation (insertions or deletions) (Figure 10D). Together, these results suggested that cleavage efficiency is guide-specific and double nicking performance is determined by the sgRNA of low efficiency.
To determine if the efficiency of sgRNAs is cell line specific, I performed the T7 endonuclease I assay in MCF10A cells, but no clear mutation was observed. This could be due to the highly inefficient transfection in MCF10A (40% at highest comparing to 100%
in HEK293), which resulted in much less expression of both sgRNAs and Cas9. I thus turned to evaluating the efficiency by examining colony formation (Figure 10E). In brief, constructs including donor DNA and CRISPR/Cas9 were co-transfected in MCF10A. About two weeks after selection with G418, cell colonies emerged and colony number was counted as the indication of insertion efficiency. The sgRNA_p53-T5 generated about 200 colonies with Cas9 while sgRNA_p53-T14 generated only about 30 colonies (Figure 10F).
Additionally, Cas9n with a pair of sgRNAs (T5 & T14) showed low efficiency of about 50 colonies. These agreed with the measures of cleavage efficiency in HEK293, suggesting that sgRNA efficiency may be cell line independent. Moreover, increasing the number of sgRNAs transfected appeared to increase the insertion efficiency (up to 250 colonies when using T5 & T14 and up to about 300 colonies when using all three sgRNAs).
Taken together, I showed that CRISPR/Cas9 induced DNA cleavage at the p53 locus in HEK293 using T7 endonuclease I assay. Efficiency tests of sgRNAs suggested that the cleavage frequency was sequence-specific. I further showed that CRISPR/Cas9 was able to initiate HDR-mediated insertion of fluorescent protein coding sequences in MCF10A cells. However, the success rate of targeted insertions needs to be investigated further.
23
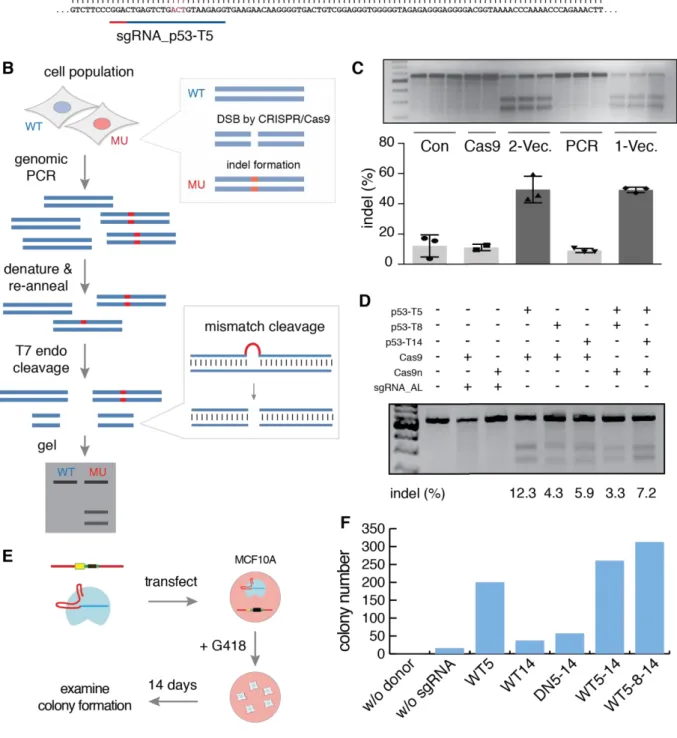
Figure 10 CRISPR/Cas9 was able to precisely edit genome DNA
(A) Schematic demonstration of three sgRNAs targeting human p53 around stop codon. Red and blue lines indicate the PAM regions and guide sequences respectively.
(B) T7 endonuclease I assay is able to detect DNA mutations created by CRISPR/Cas9. Given a population of mutated (MU) and wild type (WT) cells, genomic DNA amplification yields a mix of PCR products.
Denaturing and re-annealing this mixture lead to mismatched double strand DNA. The sites of mismatches are recognized and cut by T7 endonuclease I, resulting in two shorter DNA strands, which are visible on DNA gel. More mutations lead to higher frequency of mismatching so that more DNA will be cut by T7 endonuclease I. Therefore, the cleavage efficiency could be quantified by measuring the intensities of bands (F Ann Ran et al. 2013).
24
(C) Cleavage efficiency of three ways to deliver CRISPR-Cas9 construct were tested in HEK293. First, sgRNA and Cas9 were delivered in separate plasmids, named two vector system (2-Vec.); second, Cas9 plasmid and sgRNA which was amplified by PCR instead were co-transfected, named PCR system (PCR); third, Cas9 and sgRNA was integrated into a single vector, called one-vector system (1-Vec.). As controls, non-transfected HEK293 cells (Con) and Cas9/sgRNA_AL (empty vector without guide sequences) co-transfected HEK293 cells (Cas9) were included. After three days, cells were harvested and T7 endonuclease I assay was performed to quantify the cleavage efficiency. Three technical replicates were performed for each condition, except for Cas9 group.
(D) Different guide sequences showed different cleavage efficiency. HEK293 cells were transfected with indicated combinations of plasmids and harvested after three days. Then T7 endonuclease I assay was performed to quantify the cleavage efficiency.
(E) Integration efficiency was examined in MCF10A cells by measuring colony formation. CRISPR/Cas9 plasmids were co-transfected together with p53 donor DNA harboring neomycin resistance gene in MCF10A cells. After three-day incubation, cells were selected in G418 containing medium. After another 14 days, colonies of engineered cells emerged. The colony number indicates the integration efficiency.
(F) Statistical results of the colony counts. w/o donor: Cas9/sgRNA_p53-T5; w/o sgRNA: donor DNA/Cas9/sgRNA_AL; WT5: donor DNA/Cas9/sgRNA_p53-T5; WT14: donor DNA/Cas9/sgRNA_p53-T14;
DN5-14: donor DNA/Cas9n/sgRNA_p53-T5/ sgRNA_p53-T14; WT5-14: donor DNA/Cas9/sgRNA_p53-T5/
sgRNA_p53-T14; WT5-8-14: donor DNA/Cas9/sgRNA_p53-T5/sgRNA_p53-T8/sgRNA_p53-T14.
2.1.3 Insertion frequency is increased by optimizing cleavage efficiency
In the previous section, genome editing in MCF10A resulted in significantly different colony numbers depending on the strategy (Figure 10F), including Cas9 with a single sgRNA (WT5), a nickase version of Cas9 (Cas9n) with a pair of sgRNAs (DN5-14) and Cas9 with multiple sgRNAs (WT5-14) (Figure 11A). To determine the genotypes of the resulting colonies, two genomic PCRs were performed for each single cell-derived clone (Figure 11B). First, a pair of primers binding upstream of left arm and fluorescent gene was used to screen for insertions at the targeted locus (PCR1). To determine insertion copies (heterozygous or homozygous), second round PCR (PCR2) was performed using primers binding to genomic regions outside of homologous arms. The PCR results showed that colonies from WT5-14 all had correct insertions, and about 20% of them were homozygotes (Figure 11C). DN5-14 showed the lowest efficiency, with 20% of colonies being negative and the rest being heterozygous (Figure 11C). Efficiency of WT5 was between these two. These results suggested that the rate of positive insertions correlated to the insertion efficiency evaluated by colony number.
During screening, lower bands in PCR2 were not always of identical size, for example in clone 8 and clone 9 in Figure 11B. This indicated that the non-tagged alleles might have been altered. Sanger sequencing of these bands confirmed that mutations frequently happened on the non-tagged allele of heterozygotes (Figure 11D and E). 90% of the
25 heterozygotes generated by WT5 had mutations on the non-tagged allele. Interestingly, the most efficient strategy, WT5-14, showed the lowest mutation frequency. And no mutations in heterozygotes were detected using the double nicking strategy DN5-14.
In summary, multiple sgRNAs (WT5-14) were able to improve insertion efficiency and reduce the mutation frequency in heterozygotes, but the off-target sites were also increased. Double nicking strategy (DN5-14) in principle is able to minimize the off-target effect, but insertion efficiency is also lowered. Nonetheless, this strategy is ideal for establishing heterozygous knockins, since the mutations on the non-tagged allele happened much less frequently than others.
26
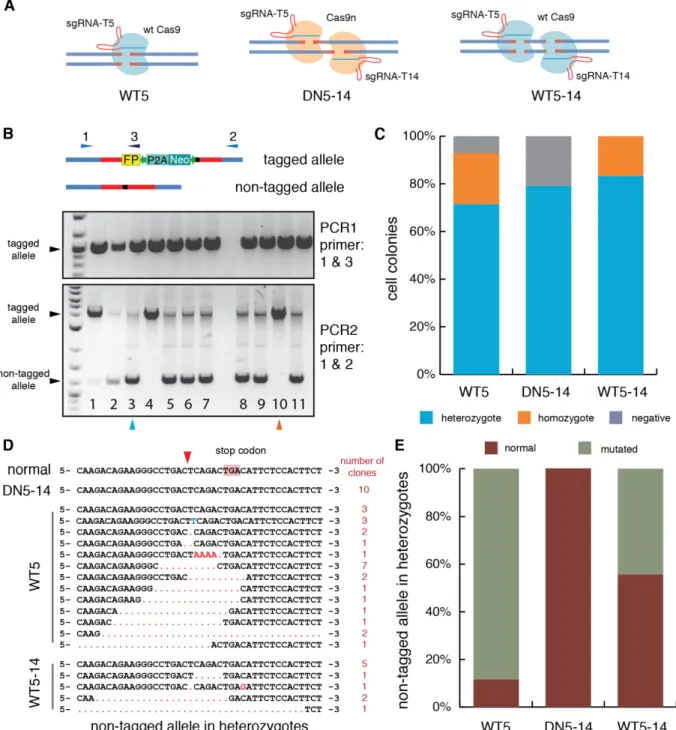
Figure 11 Three different strategies were tested
(A) Schematic demonstration of three strategies. WT5, uses wild type Cas9 and a single sgRNA (sgNRA_p53- T5) to cut DNA and induce blunt DNA breaks; DN5-14, called Double Nicking strategy, combines a mutated
"nickase" version of the Cas9 and a pair of sgRNAs (sgNRA_p53-T5 and sgNRA_p53-T14). This strategy could theoretically decrease the potential off-target effects. WT5-14, uses wild type Cas9 and multiple sgRNAs (sgNRA_p53-T5 and sgNRA_p53-T14) to increase the cleavage chance.
(B) Two genomic PCRs were performed to screen the genotypes of clones. Three primers, 1, 2 and 3 were designed to bind in upstream of the left homologous arm, downstream of the right homologous arm and fluorescent gene. The gel pictures here are examples from an experiment (WT5). Integration of exogenous fragments can be identified by PCR1 using primer 1 and primer 3. Homozygous knockins show a single band of bigger size from PCR2 using primer 1 and primer 2 (pink arrow), while heterozygous knockins show two bands (blue arrow).
(C) Insertion efficiency was different among these three strategies. Cells were transfected and clones from each strategy were examined using genomic PCRs.
(D) Mutations happened frequently in the non-tagged alleles in heterozygous knockins. The lower band in
27
PCR2, which is the second allele in heterozygotes, was sent for Sanger sequencing. Normal sequence represents the un-mutated p53 locus. Red arrow pointed the cut site of sgRNA_p53-T5. Cut site of sgRNA_p53-T14 is about 60 bps downstream of stop codon. Red dot means deleted bps, the blue and red letters represent the incorrect repair. Number of corresponding genotypes was listed on the rightest column.
(E) Quantification of mutations in non-tagged alleles. Normal alleles represent the wild type p53 sequence;
mutated alleles comprise all undesired alterations in the second allele in heterozygous knockins.
2.1.4 Length of homology regions in repair template determines the insertion efficiency
After cleavage, cells repair DNA breaks using the exogenous donor as a template in the HDR pathway. Therefore, the design of donor DNA may also have impact on the insertion efficiency. Especially, the length of homologous arms may be a key factor. Theoretically, longer homologous arms are more advantageous for insertions. However, it also means more difficulty for cloning donor DNA. To identify the optimal length, I examined colony formations using donor DNA with homology arm lengths ranging from 70 bps to 1300 bps. As expected, insertion efficiency increased with the lengths of the homology (Figure 12). 70-bp homologous arms were sufficient to lead to 50% positive colonies. The efficiency increased to about 100% with homologous arms as long as 1300 bps. In addition, homozygous insertions started to emerge with 410-bp homologies.
Figure 12 Lengths of homologous arms in the donor DNA influence the insertion efficiency
Donor DNA with various arm lengths was amplified by PCR. In details, I used the aforementioned plasmid (~1300 bp in the figure) as a PCR template and designed primers binding on different regions in homologous arms to get a list of donor DNA of different arm lengths. Then I separately co-transfected these donor DNA with CRISPR/Cas9 and sgRNA_p53-T5 in MCF10A. After selection, clones formed and were examined by genomic PCR (Figure 11B). Blue bars represent heterozygous knockins and yellow bars represent homozygous knockins. Together they indicate the positive rate in the examined clones.
28 2.1.5 Off-target effects are not detected
Cas9 tolerates non-perfect matches between genomic DNA and guide sequence of sgRNA, resulting in cleavage on unwanted sites. This off-target effect was reported in a number of publications (Lin et al. 2014; Cho et al. 2014; Fu et al. 2013). It has potential influence on the p53 signaling pathway or cellular activities. To examine off-target risk, I randomly selected 11 clones and checked the four most-likely off-target sites by Sanger sequencing.
Wild type Cas9 and sgRNA_p53-T5 were used in this test and off-target sites were identified using CRISPR Design tool (http://crispr.mit.edu). The first four sites of highest off-target score were chosen (Figure 13A). I amplified the corresponding regions by PCR and sequenced the product. Once mutations happened, the readouts of Sanger sequencing from a single clone will be a mixture of two different sequences with overlapping peaks in the chromatogram. However, each examined off-target site showed only one sequence of high quality in 11 clones (Figure 13B), indicating that off-target frequencies were below 9.1%.
Figure 13 Off-target effects were not observed among 11 clones
(A) Four off-target sites of high risk were examined. sgRNA_p53-T5 was chosen to test the off-target effects.
Off-target 1 has two mismatches to the target site (p53-T5), and the other have three mismatches.
(B) Sanger sequencing results among 11 single cell-derived clones. For each off-targets, the Sanger sequencing results were overlapped, which clearly showed that no a single mutation was detected for four off-targets among 11 clones.
29 2.2 Establishing a combined reporter to monitor p53 and p21 dynamics
In the previous chapter, I showed that CRISPR/Cas9 technology is a robust tool to create endogenous fluorescent reporters. Technically, the fluorescent intensity only reflects the level of fluorescently tagged protein. Can the measured signals faithfully indicate the endogenous level of target protein? Moreover, does this engineering perturb the p53 signaling network? To answer these questions, I performed western blot and immunofluorescent staining in order to examine p53 level and its activity. In addition, I also conducted flow cytometry-based cell cycle assay to investigate if cell fate decisions are altered after damage in engineered cells.
2.2.1 Tagging a single allele is sufficient to monitor p53 dynamics
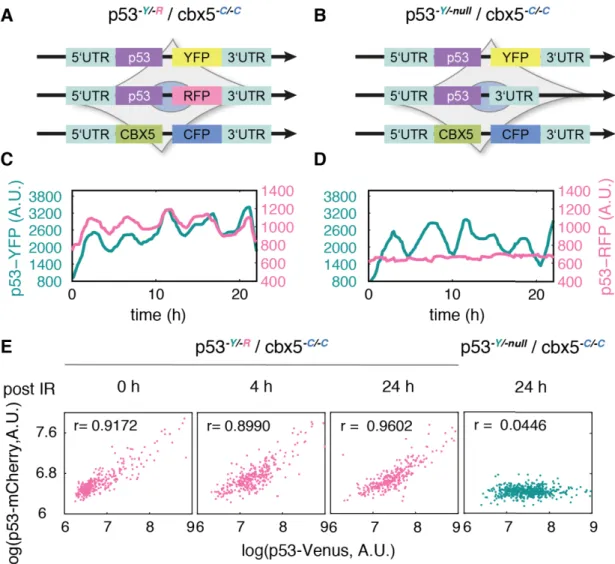
I first created a cell line expressing cbx5-mCerulean (cbx5-C/-C), previously described as a nuclear maker for tracking cells in live-cell imaging (Cohen-Saidon et al. 2009). CBX5 gene encodes chromobox protein homolog 5 (cbx5 or HP1) as non-histone protein part of the heterochromatin family (Ye & Worman 1996). During cloning p53-mVenus reporter cells, a number of clones were obtained, including heterozygous clones and homozygous clones (Figure 11B). In principle, all copies of p53 were tagged in the homozygotes, ensuring that the fluorescent intensity was a precise meter of p53 level. However, if the exogenous fluorescent protein has an effect on p53 function, homozygous cells would lose corresponding cellular activities, while these activities would be at least partially retained in heterozygotes. However, the heterozygous reporters also have some potential problems. Especially, the fidelity was unclear since p53 expression from each allele may be unequal. To address these questions, I established two reporters, p53-Y/-R / cbx5-C/-C and p53-Y/-null / cbx5-C/-C. The former one had both p53 alleles tagged with either mCherry or mVenus (Figure 14A),and the other one had a single allele tagged with mVenus (Figure 14B). In response to DNA damage, the double-tagged cells showed very similar RFP and YFP signals over time comparing to the single-tagged cells (Figure 14C and D), and both signals were highly correlated (Pearson correlation coefficient larger than 0.89) in hundreds of cells at different time points (Figure 14E). This provided strong evidence that p53 expression was not allele specific in MCF10A cells. So to tag a single allele is sufficient to monitor protein dynamics. In further experiments, I found that growth of double-tagged cells was slower and the efficiency of further genome engineering dropped down in a p53 homozygous cell line (two to fifty colonies in p53 heterozygous cells),
30 indicating that some undetected factors had been altered in homozygotes. Considering these, heterozygous reporters were preferred in the next experiments.
Figure 14 Tagging a single allele is sufficient to monitor p53 dynamics
(A) Schematic demonstration of p53-Y/-R / cbx5-C/-C cells. Both alleles of p53 were tagged with mVenus (YFP) and mCherry (RFP) to visualize allele-specific p53. 5’UTR and 3’UTR represent the untranslated regions on 5- and 3-end. YFP, RFP and CFP indicate mVenus, mCherry and Cerulean, respectively. CBX5 encodes Chromobox Protein Homolog 5, regarded as a nuclear marker in my project.
(B) Schematic demonstration of p53-Y/-null / cbx5-C/-C cells. Only a single allele of p53 was tagged with mVenus. ‘-null’ represents the unmodified p53 allele and underlines no indel formation on it.
(C) Time-resolved analysis of p53 levels in a single p53-Y/-R / cbx5-C/-C cell upon damage induction. p53 network was activated using 10 Gy -irradiation. Allele-specific p53 was monitored with two channels. The resulting dynamics were highly correlated between two alleles.
(D) Time-resolved analysis of p53 levels in a single p53-Y/-null / cbx5-C/-C cell upon damage induction. Only tagged allele showed p53 oscillation after -irradiation (10 Gy). An empty background was recorded in other channel as control.
(E) Signals from both alleles were quantified in single cells at selected time points. Each dot represents a cell. p53-mVenus represents the signals measured from YFP channel and p53-mCherry represents the signals from RFP channel.
31 2.2.2 Fluorescent reporter faithfully reflects endogenous p53 level
The fusion protein, p53-mVenus, is a combination of p53 and fluorescent protein of about 27 kDa, which may influence normal activities of p53, such as production, degradation and movement. To test this experimentally, I examined by immunofluorescent staining whether the levels of the fusion protein and wild type p53 were comparable. Both p53-Y/-
null / cbx5-C/-C cells (clone 21, indicated as PC21) and wild type MCF10A cells were treated with neocarcinostatin (NCS, 400 ng/ml), a radiomimetic drug which can damage DNA and activate p53. At several time points, p53-mVenus was compared to the total p53 in cells (including wild type p53 and p53-mVenus), which was evaluated by immunofluorescence.
5 hours after DNA damage, p53-Y/-null / cbx5-C/-C cells showed varying p53 levels in nuclei, which were observed from both fusion protein and antibody staining (Figure 15A top panel). Most importantly, signal intensities from both were highly correlated in single cells. Also, wild type cells did not show any signals from YFP channel (Figure 15A bottom panel), proving that measurement of the fusion protein is independent to immunofluorescence. Next, I quantified the intensities of each cell and evaluated the correlation using Pearson correlation coefficient in order to statistically investigate the fidelity of the fluorescent reporter. Five thousand cells were sampled for both cell lines at each time point. The fusion protein showed high correlation (Pearson correlation coefficients were all larger than 0.83 ) to total p53 levels at all time (Figure 15B), suggesting that the fusion protein faithfully reflects endogenous p53 level.
32
Figure 15 Endogenous fluorescent reporter faithfully reflects p53 level
(A) Representative images of p53 signals obtained by immunofluorescent staining and reporter protein.
Wild type MCF10A and p53-mVenus cells were treated with NCS (400 ng/ml). At selected time points, cells were fixed and stained with anti-p53 primary antibody followed by Alexa Fluor 594 conjugated secondary antibody. Nuclei were stained by Hoechst.
(B) Single cell quantification of p53 signals at selected time points. The intensity of signals captured from two channels (Cy5 and YFP) were quantified. p53 represents the signals obtained by antibody conjugation, and p53-mVenus represents the signals from mVenus tagged p53. 5000 cells were randomly sampled at each time point and Pearson correlation coefficients were calculated.
2.2.3 Reporter cells show unaltered p53 responses to DNA damage
To examine if the fusion protein influenced the p53 network, I exposed cells to 10 Gy - irradiation and measured protein levels of p53 and p21 over time by western blot. As shown in Figure 16B, p53 increased immediately after damage, reached the peak level at 5 hours and went down to basal level after 16 hours in wild type MCF10A. To assess its activity, its target gene p21 was measured as well. The response faithfully followed p53 dynamics with 1~2 hours’ delay as expected (Loewer et al. 2010). In p53-Y/-null / cbx5-C/-C cells, wild type p53 and p53-mVenus were both detected and showed nearly equal protein levels. They together showed similar dynamic to wild type MCF10A. Importantly, p21
33 showed similar dynamic, suggesting that fluorescently tagging both p53 and cbx5 locus did not influence p53 activity.
Figure 16 p53-Y/-null / cbx5-C/-C and wild type MCF10A cells showed similar p53 and p21 dynamics on population level
(A) Protein dynamics of p53 and p21 in p53-Y/-null / cbx5-C/-C cells. As controls, cells without irradiation were analyzed both in the beginning (0 hour, 0 Gy) and at the end (24 hours, 0 Gy) of the experiment.
(B) p53 and p21 dynamics in wild type MCF10A.
2.2.4 Reporter cells show no differences in cell fates after damage
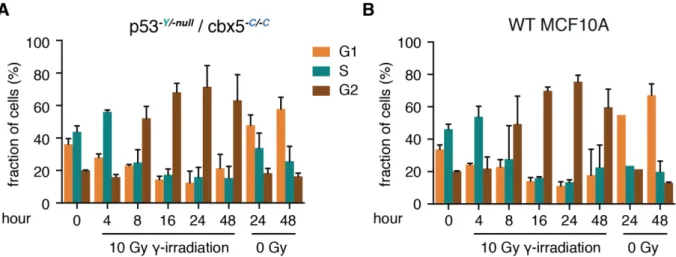
Although no significant influence was observed on the p53 network in engineered cells, it was not clear if the tagging affects the DNA damage response. To inspect potential effects, I conducted cell cycle assays after damage induction using flow cytometry. In unmodified cells, the number of G2-phase cells increased until 24 hours post damage, while fractions of G1- and S-phase cells decreased (Figure 17A). This suggests that G2 arrest instead of G1 arrest was the main outcome following DNA damage in MCF10A line. Importantly, I observed similar distributions of cell cycle phases over time in p53-Y/-null / cbx5-C/-C cells (Figure 17B). This shows that engineering the p53 and cbx5 locus had no influences on cell fate determinations after DNA damage.
Figure 17 Distributions of cell cycle phases are similar after 10 Gy -irradiation between p53-Y/-null /
34
cbx5-C/-C and wild type MCF10A cells
(A) Cell cycle phases were measured at indicated time points after DNA damage in p53-Y/-null / cbx5-C/-C. Cells were exposed to 10 Gy -irradiation, and harvested at several time points. Non-irradiated cells were also harvested at the beginning (0h), at the half (24h) and at the end (48h) of the experiment as controls. All samples were subjected to PI staining, and cell cycle phases were determined according to DNA content measured by flow cytometry.
(B) Distribution of cell cycle phases after DNA damage in wild type MCF10A cells.
2.2.5 Establishment of a combined reporter to simultaneously monitor p53 and p21
Since p53-Y/-null / cbx5-C/-C was proven not to affect p53 network or cellular outcomes, I engineered a p53 target gene, CDKN1A, as well (Figure 18A and B). CDKN1A encodes p21, which regulates cell cycle progression by inhibiting the activity of CDK/Cyclin complexes.
This combined reporter can simultaneously capture information about p53 and p21 levels in the same cells (Figure 18C), which is an ideal model to study how a mediator (p53) influences its responder (p21) to control cell decisions. After screening and microscopy examination (Figure 18B and C), clone 45 (named PCP45 in the remaining of my thesis) with the genotype p21-R/-null / p53-Y/-null / cbx5-C/-C was identified as a suitable reporter and further validation focused on this clone. Western blot analysis showed that the third fusion protein, p21-mCherry, also faithfully reflected the dynamic of its counterpart, wild type p21 (Figure 18D). In addition, p53 dynamics were similar to parental cell lines of PCP45, including wild type MCF10A and PC21 (Figure 16 and Figure 18D). However, diverging p21 dynamics were observed at later time points in PCP45, as both p21 species remained elevated from 8h to 24h (Figure 18D). This suggests that p21-mCherry may partially influence p21 stabilization. Accordingly, cell cycle distributions of PCP45 were slightly different to its parental cells after irradiation as well (Figure 17 and Figure 18E).
Specifically, fewer G1-phase cells and more G2-phase cells were observed in PCP45 16h after damage. I further analyzed two other clonal cell lines, including a homozygote and heterozygote insertion of mCherry in the CDKN1A locus, both created in an independent experiment. However, the same differences were observed in these cell lines, indicating that the p21-mCherry fusion had an effect on cell activities. However, as there are no alternative labeling methods available and the difference presented here did not alter the major patterns of cellular dynamics or main cellular outcomes, clone PCP45 was still considered as a proper model, but the slight differences should be always addressed when using this combined reporter.