Upregulation of hepatic bile acid synthesis via fibroblast growth factor 19 is defective in gallstone disease but functional
in overweight individuals
Olga Renner
1, Simone Harsch
1, Silke Matysik
2, Dieter Lu ¨tjohann
3, Gerd Schmitz
2and Eduard F Stange
4Abstract
Background:Fibroblast growth factor 19 (FGF19) is an enteric hormone regulating bile acidde novosynthesis by sensing ileal bile acid flux. However, the role of FGF19 in cholelithiasis has not yet been elucidated and therefore is investigated in the present study.
Methods: Total mRNA and protein were isolated from ileal biopsies and used for tissue expression analysis. FGF19, 7a-hydroxycholesterol (7a-OH-Chol), 27-hydroxycholesterol (27-OH-Chol), and different bile acids were determined in the blood samples.
Results:FGF19 serum levels did not differ between gallstone carriers and controls but were significantly decreased in the overweight individuals (32%,p¼0.0002), irrespective of gallstone status (normalweight to overweight controls29%, p¼0.0017; normalweight to overweight gallstone carriers 44%,p¼0.0338), and correlated inversely with bodyweight (p<0.0001,r¼ 0.3317). Compared to non-overweight controls, apical sodium-dependent bile acid transporter expression was significantly diminished in the non-overweight gallstone carriers (42%,PmRNA¼0.0393;52%,pprotein¼0.0169) as well as in the overweight controls (24%,PmRNA¼0.0148;43%,pprotein¼0.0017). FGF19 expression varied widely and was similar in all groups. A significant negative correlation was noted between 7a-OH-Chol, 27-OH-Chol, and FGF19 serum levels(p<0.01;r7a-OH-Chol¼ 0.2155;r27-OH-Chol¼ 0.2144) in obesity.
Conclusion: Upregulation of hepatic bile acid synthesis via FGF 19 is defective in gallstone disease but functional in overweight individuals.
Keywords
Bile acid transport/absorption, bodyweight, entric hormone, expression, intestine
Received: 14 November 2013; accepted: 12 February 2014
Introduction
Fibroblast growth factor 19 (FGF19) is a humoral factor with several regulatory functions including metabolic rate,1 bile acid homeostasis,2 and gallblad- der filling.3 FGF19 transcripts are found in the small intestine, brain, cartilage, skin, retina, and gall blad- der but very low in the normal liver.4,5 Initial inter- est in FGF19 as a metabolic regulator was prompted by the phenotype of FGF15 (the mouse homologue of FGF19) of transgenic mice where decreased obes- ity, increased energy expenditure, reduced liver
1Dr. Margarete Fischer-Bosch Institute of Clinical Pharmacology and University of Tuebingen, Stuttgart, Germany
2University Hospital Regensburg, Regensburg, Germany
3Institute for Clinical Chemistry and Clinical Pharmacology, Laboratory for Special Lipid Diagnostics, University Hospital Bonn, Bonn, Germany
4Department of Gastroenterology, Robert Bosch Hospital, Stuttgart, Germany
Corresponding author:
Olga Renner, Dr. Margarete Fischer-Bosch Institute of Clinical Pharmacology and University of Tuebingen, Auerbachstr. 112, 70376 Stuttgart, Germany.
Email: olga.renner@ikp-stuttgart.de
United European Gastroenterology Journal 2014, Vol. 2(3) 216–225
!Author(s) 2014 Reprints and permissions:
sagepub.co.uk/journalsPermissions.nav DOI: 10.1177/2050640614527938 ueg.sagepub.com
triglycerides, elevated fatty acid oxidation, and improved insulin sensitivity were observed.1 Administration of human recombinant FGF19 increased the metabolic rate and reversed dietary and leptin-deficient diabetes in mice.6 Besides con- trolling gall bladder refilling by relaxation of gall bladder smooth muscle,3 FGF19 is also a key player involved in the regulation of bile acid homeo- stasis.7 Using genetically modified mice it was shown that intestinal farnesoid X receptor (FXR)/FGF15 has a predominant role in the inhibition of bile acid biosynthesis.8 Intestinal FGF19 expression is stimulated by bile acid mediated activation of FXR and the enterokine is secreted into the enterohepatic circulation. In addition to FXR, intestinal expression of FGF19 is regulated by several nuclear receptors such as pregnane X receptor (PXR) together with its heterodimer partner retinoid X receptor (RXR).9,10 In the liver, a stabilizing cofactor bKlotho is neces- sary for binding of FGF19 to its hepatic receptor fibroblast growth factor receptor 4 (FGFR4), creat- ing a complex signalling through the c-Jun kinase cascade,4 ultimately leading to suppression of chol- esterol 7 alpha-hydroxylase/cytochrome P450 7A1 (CYP7A1) expression.2 Circulating FGF19 exhibits a diurnal rhythm controlled by transintestinal bile acid flux.11 Diminished serum FGF19 and increased bile acid synthesis were found in patients character- ized by intestinal bile acid malabsorption (primary (idiopathic) bile acid malabsorption, inflammatory bowel disease, or ileal resection).12,13 Fasting FGF19 levels were shown to exhibit differences between cases and controls in patients with choles- tasis,14 obesity,15 and bile acid diarrhoea.16
In spite of its important role in energy and bile acid metabolism, the function of FGF19 in gallstone disease has not been studied. In non-overweight gallstone dis- ease bile acid synthesis was paradoxically unchanged despite a reduction of the bile acid pool size and an increased fractional turnover.17,18 The latter may be related to the impaired absorption of bile acids in gall- stone disease.19Most likely, the molecular basis of bile acid malabsorption in gallstone disease is the dimin- ished ileal expression of apical sodium-dependent bile acid transporter (ASBT), ileal lipid binding protein (ILBP), and organic solute transporter alpha/beta (OSTa/b).20,21
The lack of induction of hepatic bile acid synthe- sis regardless of ileal loss may be a consequence of defective FGF19 response in the ileum. In the pre- sent study, we therefore analysed serum levels and ileal expression of FGF19 as well as bile acid metab- olite levels, ileal bile acid transporters, and relevant transcription factors in a cohort of gallstone carriers and controls.
Patients and methods Ethics statement
Informed consent was obtained from each patient included in the study and the study protocol confirms to the ethical guidelines of the 1975 Declaration of Helsinki as reflected in a priori approval by the institu- tion’s human research committee (ethics committee of the University Hospital of Tuebingen and University of Tuebingen).
Subjects and materials
The selection as well as including and excluding criteria of study subjects were applied as previously described22 and characteristics of the analysed cohort are summar- ized in Supplementary Table S1 (available online). Ileal mucosal forceps biopsies and fasting blood samples were collected during routine colonoscopy from a total of 168 individuals, comprising 134 healthy con- trols and 34 individuals with asymptomatic gallstones.
As weight also depends on age23–27 and the mean age was over 50 years in the analysed cohort, the normal- weight group was defined as body mass index (BMI) 25.4 kg/m2 (as a mathematical value of 25) and individuals with BMI >25.4 kg/m2 were regarded as overweight.
For tissue gene expression analysis in an ileal muco- sal biopsy, total mRNA and protein were isolated using TRIzol Reagent (Invitrogen) according to the manufac- turer’s protocol. The quality and quantity controls of isolated material were assessed as reported.22 Blood samples (3–5 ml) were used for determination of total serum cholesterol and triglyceride levels as well as for bile acid metabolism profiling (measurements of bile acid synthesis markers, serum bile acid, and FGF19 concentrations). Serum triglycerides and cholesterol levels were analysed by standard clinical tests.
Determination of serum FGF19
FGF19 levels were determined using a sandwich ELISA kit (BioVendor, Czech Republic). All cooled serum samples were diluted 1:3 and analysed following the manufacturer’s instructions.
Real-time quantitative reverse-transcription PCR
RT-PCR was performed with LightCycler sequence detection system (Roche Diagnostics) as reported pre- viously.21,22,28Primer sequences used for amplifications and specific PCR conditions are listed in Supplementary Table S2. At the end of the cycling pro- gram, a dissociation curve was calculated. The quantity for any given transcript was calculated using the second
derivative maximum method. Gene-specific plasmid constructs were generated as reported previously21,29 and served as positive control templates. All measure- ments were carried out in duplicate.
Western blot analysis
The antibody used for the detection of human ASBT protein was a kind gift of Prof P Dawson (Wake Forest University, Winston-Salem, USA). Protein determin- ation was performed as previously described.28
Measurement of bile acid synthesis markers
Sample preparation for determination of 7a-hydroxy- cholesterol (7a-OH-Chol) and 27-hydroxycholesterol (27-OH-Chol) as well as consecutive measurement by GC-MS was performed as previously described30 with slight modifications. Details are described in the supplementary file.
Measurement of bile acids in plasma
Sample preparation and methodology for bile acid LC- MS/MS analysis is described elsewhere.31 Fifteen bile acid species were quantified: cholic acid (CA), che- nodeoxycholic acid (CDCA), deoxycholic acid (DCA), lithocholic acid (LCA), ursodeoxycholic acid (UDCA), and their glycine (G) and taurine (T) conju- gated derivates.
Statistics
For statistical analysis GraphPad Prism 5 was used (GraphPad Software, San Diego, CA, USA). Clinical characteristics of study participants and all data are presented as meanstandard error of the mean.
Differences between groups were investigated using the Mann–Whitney U-test. All correlations between variables were analysed with Spearman’s rank test.
All statistical tests were two-tailed and a p-value
<0.05 was considered as statistically significant.
Results Serum FGF19
In the total population, there was no difference between serum FGF19 concentration in gallstone carriers and controls (p¼0.4000; Figure 1A). Notably, fasting FGF19 serum levels exhibited a significant reduction by 32% in overweight individuals (p¼0.0002;
Figure 1B). Also after stratification into weight-specific subgroups, FGF19 plasma concentrations were com- parable between gallstone subjects and controls
400
300
200
100
0
400 500
300 200
100 0
600
400
200
0
C C
GS
C GS
NW OW
GS
BMI ≤ 25 BMI > 25
pg / mLpg / mLpg / mL
P = 0.0017 P = 0.0002
P = 0.0338 ns
ns
-29% -44%
-32%
(A) ns
(B)
(C)
Figure 1. Circulating levels of FGF19 in gallstone patients and controls in overnight fasting individuals according to presence of gallstone (A), weight (B), and presence of gallstone with weight (C).
Values are meanSEM. Mann–Whitney U-test, p<0.05. BMI, body mass index; C, control; GS, gallstone carrier; NW, normal- weight; OW, overweight. (A) C, n¼129; GS, n¼333. (B) NW, BMI25 kg/m2, n¼81; OW, BMI>25 kg/m2, n¼81. (C) NW: C, n¼70, GS,n¼11; OW: C,n¼59, GS,n¼22.
(Figure 1C) both in the normalweight and the over- weight groups. However, overweight persons exhibited significantly lower FGF19 serum levels than non-over- weight individuals independent of gallstone status (nor- malweight to overweight controls 29%, p¼0.0017;
normalweight to overweight gallstone carriers 44%, p¼0.0338). Moreover, FGF19 plasma levels correlated inversely with BMI (p<0.0001 r¼ 0.3317). FGF19 serum levels were similar between overweight (BMI>25.4 kg/m2) and obese (BMI>30 kg/m2) indi- viduals (data not shown).
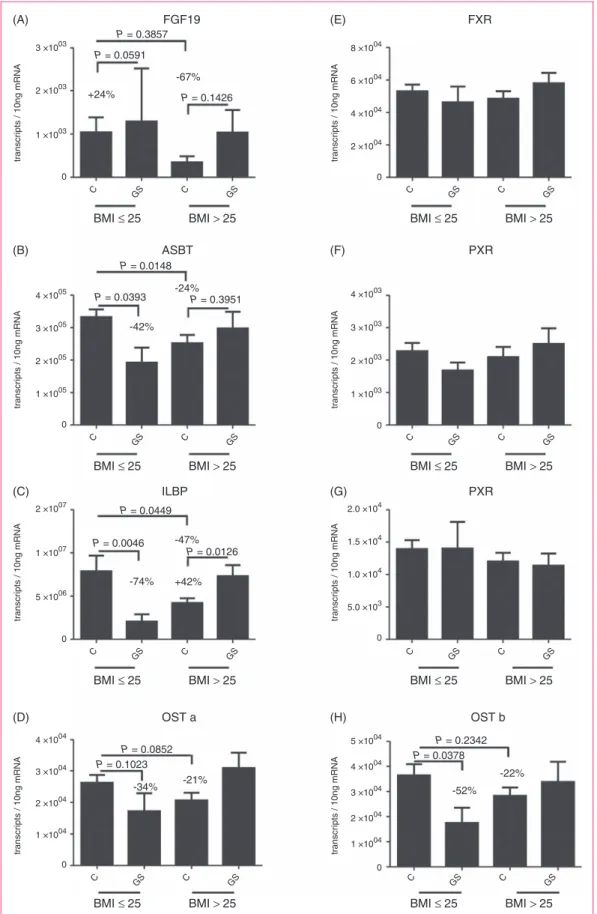
Ileal expression of FGF19, bile acid transporters, and relevant transcription factors
Overall, there was no significant difference in FGF19 expression between gallstone carriers and controls (Figure 2A). As in previous investigations,32 the wide interindividual variations of basal FGF19 mRNA expression rendered statistical comparisons difficult.
Next, the expression of ileal bile acid transporters was quantified. In essence, we confirmed our prior find- ing of diminished bile acid transporters expression in the intestine of female gallstone patients,20,21now irre- spective of gender in a composite cohort of female and male gallstone carriers. The expression of all intestinal bile acid transporters was distinctly reduced in non- overweight gallstone carriers (ASBT 42%, p¼0.0393, Figure 2B; ILBP 74%, p¼0.0046, Figure 2C; OSTa34%p¼0.1023, Figure 2D; OSTb 52%p¼0.0378, Figure 2H). Remarkably, overweight subjects exhibited diminished bile acid transporter levels in comparison with non-overweight controls (ASBT 24%, p¼0.0148; ILBP 47%, p¼0.0449;
OSTa 21%, p¼0.0852; OSTb 22%, p¼0.2342).
At the protein level, ASBT expression was reduced by 52% in non-overweight gallstone carriers compared to controls (p¼0.0169) and by 43% in overweight control individuals compared to normalweight controls (p¼0.0017). The intestinal expression of the ASBT transporter on protein levels did not differ between overweight controls and the gallstone group (p¼0.7517; Supplementary Figure S1).
There were significant positive correlation coeffi- cients between the transporters (ASBT/ILBPr¼0.72, ASBT/OSTa r¼0.71, ASBT/OSTb r¼0.68, ILBP/
OSTa r¼0.82, ILBP/OSTb r¼0.70, OSTa/OSTb r¼0.77; n¼117, p<0.0001). In contrast, the correl- ation coefficients for intestinal FGF19 mRNA expres- sion and bile acid transporters were low (ASBT r¼0.22, p¼0.0153; ILBP r¼0.44, p<0.0001; OSTa r¼0.41,p<0.0001; OSTb r¼0.35,p¼0.0002). FXR, PXR, and RXR mRNA expression does not differ sig- nificantly between gallstone carriers and controls (Figure 2E–G). No correlation was found between
intestinal FXR and FGF19 expression (r¼0.03, ns).
There was moderate association between mRNA expres- sion of FGF19, PXR, and RXR (FGF19/PXRr¼0.35, p<0.0001; FGF19/RXRr¼0.23,p¼0.0156).
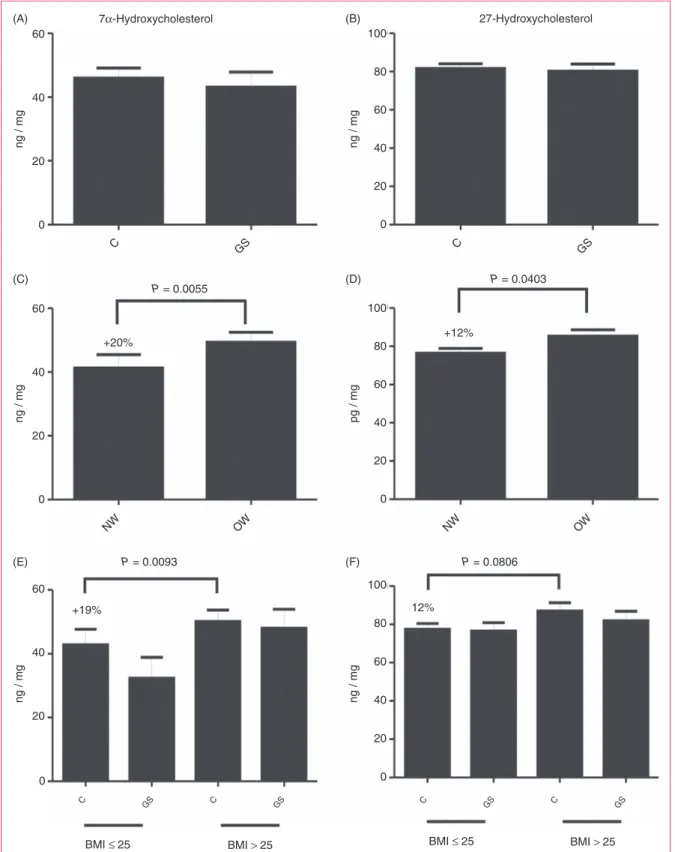
Markers of bile acid synthesis
Furthermore, markers of hepatic neutral/classic (7a- OH-Chol) and acidic/alternative (27-OH-Chol) bile acid synthesis pathways were analysed and displayed as ratio of oxysterol to plasma total cholesterol level (Figure 3). In line with observations from serum FGF19 levels, both markers of bile acid synthesis were comparable between controls and gallstone car- riers in the total group (Figure 3A and B), but signifi- cantly increased in overweight individuals irrespective of gallstones (7a-OH-Chol þ20%, p¼0.0055; 27-OH- Cholþ12%,p¼0.0403; Figure 3C and D). Moreover, levels of the bile acid precursors were not significantly different between gallstone carriers and controls in the weight-specific subgroups (Figure 3E and F).
Therefore, 7a-OH-Chol- and 27-OH-Chol-mediated bile acid synthesis ratios were higher in overweight indi- viduals than in normalweight persons (þ19%
p¼0.0093; þ12% p¼0.0806). Besides, intermediates of bile acid synthesis correlated inversely with serum FGF19 levels (7a-OH-Chol r¼ 0.2155, p<0.01; 27- OH-Cholr¼ 0.2144,p<0.01). Finally, ileal bile acid transporter as well as FGF19 expression and the mar- kers of hepaticde novo bile acid synthesis revealed no significant association (data not shown).
Plasma bile acid concentrations
To investigate the influence of reduced bile acid reabsorption in the intestine on serum levels, the con- centrations of different bile acids were measured. As shown in Figure 4, the total amount of bile acids in plasma is significantly diminished (74%, p¼0.0374) in non-overweight gallstone carriers compared to rele- vant controls. This reduction was most pronounced for primary bile acids in plasma (75%,p¼0.0334), sec- ondary bile acids in serum of normalweight gallstone carriers were not significantly reduced. In overweight gallstone carriers, the total bile acid concentration was lower by about 33% compared to overweight controls, but this effect also did not reach statistical significance (p¼0.6215). Notably, bile acid concentra- tion in overweight persons was reduced up to 21%
compared to non-overweight healthy individuals (p¼0.3235).
Table 1 shows the data of all analysed bile acid spe- cies including their free form as well as glycine or taur- ine conjugates. The calculated data exhibit the uniform pattern of reduction for every bile acid type in the
FGF19 FXR
PXR ASBT
PXR ILBP
OST a OST b
P = 0.3857 P = 0.0591
P = 0.1426 -67%
+24%
P = 0.0148
P = 0.0393 P = 0.3951 -24%
-42%
P = 0.0449
P = 0.0046
P = 0.0126 +42%
-74%
-47%
P = 0.0852 P = 0.1023
-34% -21%
P = 0.2342 P = 0.0378
-22%
-52%
3 ×1003
2 ×1003
1 ×1003
0
2 ×1007
1 ×1007
5 ×1006
0 4 ×1005
3 ×1005
2 ×1005
1 ×1005
0
4 ×1004
3 ×1004
2 ×1004
1 ×1004
0
5 ×1004 4 ×1004 3 ×1004 2 ×1004 1 ×1004 0 4 ×1003
3 ×1003
2 ×1003
1 ×1003
0 8 ×1004
6 ×1004
4 ×1004
2 ×1004
0
2.0 ×10⁴
1.5 ×10⁴
1.0 ×10⁴
5.0 ×10³
0
C C
GS GS
transcripts / 10ng mRNA transcripts / 10ng mRNAtranscripts / 10ng mRNA
transcripts / 10ng mRNA transcripts / 10ng mRNA
transcripts / 10ng mRNA transcripts / 10ng mRNA
transcripts / 10ng mRNA
BMI ≤ 25 BMI > 25
C C
GS GS
BMI ≤ 25 BMI > 25
C C
GS GS
BMI ≤ 25 BMI > 25
C C
GS GS
BMI ≤ 25 BMI > 25
C C
GS GS
BMI ≤ 25 BMI > 25
C C
GS GS
BMI ≤ 25 BMI > 25
C C
GS GS
BMI ≤ 25 BMI > 25
C C
GS GS
BMI ≤ 25 BMI > 25
(A) (E)
(B) (F)
(C) (G)
(D) (H)
Figure 2. Ileal expression of FGF19 (A), apical sodium-dependent bile acid transporter (ASBT), (B), ileal lipid-binding protein (C), organic solute transportera(D), FXR (E), PXR (F), RXR (G), and organic solute transporterb(H) in gallstone patients and controls.
Quantification of mRNA was performed in human ileal mucosal biopsies of gallstone carriers and controls and is given as copy number.
All experiments were carried in duplicate. Values are meanSEM. Mann–Whitney U-test,p<0.05. BMI, body mass index; C, control; GS, gallstone carrier; NW, normalweight; OW, overweight. NW: C,n¼57; GS,n¼9; OW: C,n¼50, GS,n¼21.
7α-Hydroxycholesterol 27-Hydroxycholesterol 60
40
20
0
100
80
60
40
20
0
C GS C GS
ng / mg ng / mg
60
40
20
0
100
80
60
40
20
0
ng / mg pg / mg
60
40
20
0
100
80
60
40
20
0
ng / mg ng / mg
P = 0.0055 P = 0.0403
+20% +12%
P = 0.0093 P = 0.0806
+19% 12%
NW OW NW OW
BMI ≤ 25 BMI > 25
C GS C GS
C GS C GS
BMI ≤ 25 BMI > 25
(A) (B)
(C) (D)
(E) (F)
Figure 3. Circulating markers of the hepaticde novobile acid synthesis in gallstone patients and controls according to presence of gallstone (A, B), weight (C, D), and presence of gallstone with weight (E, F): 7a-hydroxycholesterol (A, C, E) and 27-hydroxycholesterol (B, D, F).
Serum concentrations are ratio oxycholesterol (ng/ml)/cholesterol (mg/dl)*100. Values are meanSEM, Mann–Whitney U-test,p<0.05.
BMI, body mass index; C, control; GS, gallstone carrier; NW, normalweight; OW, overweight. (A, B) C,n¼90; GS,n¼29. (C, D) NW, BMI25 kg/m2,n¼60; OW, BMI>25 kg/m2,n¼59. (E, F) NW: C,n¼51, GS,n¼9; OW: C,n¼39, GS,n¼20.
gallstone group. As reported by Matysik et al.,33 the glycine-conjugated primary bile acid GCDCA repre- sented the highest plasma level, followed by TCDCA und CDCA. Remarkably, only TUDCA and CA were increased (TUDCA þ20%, p¼0.4200; CA þ180%, p¼0.5500) in overweight gallstone patients compared with respective controls, but without significance.
Discussion
In the present study, we examined the role of FGF19 in gallstone disease and excess weight, determining its cir- culating levels as well as ileal expression of FGF19, relevant transcription factors, bile acid transporters, and bile acid metabolite serum levels. The major novel finding suggests that FGF19 expression as well as concentrations in the blood do not adequately respond to the diminished ileal bile acid reabsorption in gallstone carriers and therefore fail to stimulate the bile acid synthesis in the liver. The additional non-gall- stone control group of overweight individuals, where ileal bile acid reabsorption is also reduced and FGF19 concentrations are declined as expected (unlike gallstone patients), exactly showed the FGF19 response which would be expected in the case of ade- quate upregulation of bile acid synthesis. Accordingly, FGF19 levels are reduced and bile acid synthesis is enhanced in the overweight but not in the gallstone subjects.
The pathogenesis of gallstones is complex and is related to a large number of risk factors such as obesity, age, female gender, nutrition, and genetics. Most data point to a diminished intestinal bile acid absorption as well as pool size in gallstone patients,17,19which should prompt a compensatory increase in synthesis. However, bile acid synthesis remains unaltered in non-overweight gallstone patients.17,18 Also, we found unchanged bile acid synthesis markers and remarkably a significant decrease of bile acids in plasma of normalweight gall- stone carriers. Such a metabolic imbalance would explain the enhanced cholesterol lithogenicity due to a relative lack of bile acids in gallstone bile. This process apparently depends on ethnicity, as paradoxically in Hispanic gallstone carriers with unaltered ileal trans- porter expression and faecal excretion of bile acids, the level of CYP7A1 is increased.34 To further clarify the factors involved in this dysregulation, we studied the recently identified major regulator of bile acid syn- thesis, FGF19.
Animal models provide evidence that stimulation of FXR-mediated intestinal FGF15 expression suppresses bile acid synthesis in the liver in a dominant way.7 Moreover, circulating intestinal FGF19 has a pro- nounced diurnal variation and modulates bile acid syn- thesis in men.11 Also in several diseases FGF19 is an
Total bile acids
Primary bile acids P = 0.3235
P = 0.6215 P = 0.0374
-21%
-74% -33%
6
4
2
0
C GS C GS
BMI ≤ 25 BMI > 25
P = 0.2791
P = 0.6905 P = 0.0334 -24%
-75% -30%
5
4
2 3
1
0
C GS C GS
BMI ≤ 25 BMI > 25
Secondary bile acids P = 0.7754
P = 0.5557 P = 0.1177
+4%
-72%
-42%
1.5
1.0
0.0 0.5
C GS C GS
BMI ≤ 25 BMI > 25
ng / mLng / mLng / mL
(A)
(B)
(C)
Figure 4. Comparison of plasma bile acid concentrations in gall- stone patients and controls according to presence of gallstone with weight: total bile acids (A), primary bile acids (B), and secondary bile acids (C).
Values are meanSEM, Mann–Whitney U-test, p<0.05. BMI, body mass index; C, control; GS, gallstone carrier; NW, normal- weight; OW, overweight. NW: C,n¼74, GS,n¼11; OW: C,n¼59, GS,n¼22.
important regulator. For example, to prevent the accu- mulation of toxic bile acids, the liver FGF19/FGFR4 signalling pathway was induced by the autocrine mech- anism of bile acids35and high FGF19 plasma levels as well as increased FGF19 expression were detected in the liver of patients with extrahepatic cholestasis as a protective mechanism.14 Otherwise, reduced plasma FGF19 levels were reported for patients with impaired glucose tolerance, Type 2 diabetes mellitus and in bile acid malabsorption, non-alcoholic fatty liver disease, inflammatory bowel disease, or ileal resection and were associated with increased bile acid synthe- sis.12,13,15,36,37
Recently, in patients with idiopathic bile acid-induced diarrhoea, FGF19 and 7a-hydroxy- 4-cholesten-3-one were shown to correlate negatively and FGF19 was proposed to serve as diagnostic marker for this disease.16 Furthermore, in diabetic patients undergoing Roux-en-Y gastric bypass, lower FGF19 levels were significantly correlated with increased hepatic expression of the CYP7A1 gene, modulating bile acid production.38 In the present study, differences in FGF19 levels and bile acid synthe- sis markers were found between normal weight and overweight individuals but remarkably not between gallstone carriers and non-gallstone controls of similar weight. In the additional control group of overweight
individuals, ileal bile acid reabsorption is reduced and FGF19 concentrations declined as expected (unlike gallstone patients).
As in prior studies,32ileal FGF19 expression, which is considered to be the source of FGF19 in the circula- tion, varied widely and did not correlate with serum levels (Supplementary Figure S2). These large inter- individual differences in FGF19 expression are also not explained by the expression of relevant transcrip- tion factors (FXR, PXR, and RXR). In addition, FGF19 levels may be affected by sequence variations in the gene, epigenetic as well as posttranslational fac- tors, and variations in protein degradation. The lack of change in bile acid synthesis markers is in accordance with several studies. Moreover, the diminished ileal bile acid transporter expression observed here confirms our previous reports,20,21 now in non-overweight male patients (Supplementary Figure S3).
Cholesterol and bile acid synthesis are closely linked but differ among overweight and normalweight individ- uals. Obesity is characterized by an excessive biliary cholesterol, less increased bile acid secretion, and a high lithogenic index.39 Bile acid synthesis is also ele- vated40 and pool size is normal or enlarged in the obese39,41 without evidence of bile acid malabsorp- tion.42There is a loose but positive correlation between Table 1. Serum bile acid profile in gallstone patients and controls
Bile acid type
Normalweight Overweight
Controls (n¼74)
Gallstone carriers (n¼11)
Difference
(%) p-value
Controls (n¼59)
Gallstone carriers (n¼23)
Difference
(%) p-value
Primary
TCA 0.2000.044 0.0210.006 90 0.017 0.1740.038 0.1010.033 42 0.47
GCA 0.4440.080 0.0730.021 84 0.017 0.3750.074 0.2580.077 31 0.47
CA 0.0180.007 0.0050.002 72 0.128 0.0150.004 0.0410.025 180 0.55
TCDCA 0.8090.113 0.3270.049 60 0.068 0.5620.095 0.3750.070 33 0.49
GCDCA 1.8940.302 0.4380.138 77 0.034 1.3870.271 0.9590.224 31 1.00
CDCA 0.2430.050 0.0420.008 83 0.010 0.2140.040 0.1620.040 24 0.42
Secondary
TDCA 0.1220.019 0.0230.009 81 0.042 0.1270.035 0.0690.030 46 0.66
GDCA 0.6280.110 0.1700.046 73 0.122 0.6420.171 0.3480.105 46 0.60
DCA 0.1640.061 0.0390.012 76 0.249 0.1670.044 0.1120.024 33 0.97
TLCA 0.0100.001 0.0080.004 20 0.400 0.0110.003 0.0090.003 16 0.80
GLCA 0.0450.007 0.0320.011 29 0.675 0.0520.009 0.0380.010 27 0.87
LCA 0.0080.002 0.0030.001 61 0.208 0.0130.003 0.0080.002 36 0.61
Tertiary
TUDCA 0.0270.011 0.0050.003 81 0.061 0.0100.002 0.0130.004 20 0.42
GUDCA 0.2960.120 0.0950.050 68 0.074 0.1360.022 0.1140.025 16 0.59
UDCA 0.0370.006 0.0050.003 87 0.001 0.0380.007 0.0250.006 36 0.32
Data are mean concentration (mmol/l)SEM.,p-value obtained from a nonparametric two-tailed Mann–Whitney U-test. CA, cholic acid; CDCA, cheno- deoxycholic acid; DCA, deoxycholic acid; G, glycine conjugates; LCA, lithocholic acid; T, taurine conjugates; UDCA, ursodeoxycholic acid.
weight and bile acid formation43and weight reduction is associated with a reduction in biliary bile acid output.39 Therefore, the elevated bile acid synthesis contributes to the higher rates of cholesterol balance41 but is less than required to dissolve disproportionately elevated cholesterol in bile.40As FGF19 plays a central role in the suppression of bile acid synthesis and secre- tion,7it was also suggested to participate in the regula- tion of cholesterol, lipoprotein, triglyceride, and glucose metabolism.1,6 In mice, high levels of FGF19 were related to low bodyweight1which is in agreement with previous data in humans15,44,45 and the observa- tions in the present work.
In conclusion, bile acid transporter expression is low in normalweight gallstone patients and overweight non- gallstone controls, but adaptive upregulation of bile acid synthesis through FGF19 is observed only in the overweight non-gallstone group. This might explain bil- iary lithogenesis in normalweight gallstone carriers through lack of induction of bile acid synthesis to balance intestinal bile acid loss.
Acknowledgements
We are greatly indebted to Professor Dr Klaus von Bergmann for valuable initiation of bile acid precursor measurements of this study. We thank Dr Oliver Mu¨ller and the staff of the gastroenterological department and the endoscopy team for recruitment of study participants and collecting tissue biop- sies. We also thank Dr Stephan Winter for competent statis- tical support; Andre´ Strohmeyer and Anja Kerksiek for excellent technical assistance.
Funding
This study was supported by the Robert Bosch Foundation (P4-1/03 and Innovationsfond 2011).
Conflict of interest
The authors declare that they have no competing interests.
References
1. Tomlinson E, Fu L, John L, et al. Transgenic mice express- ing human fibroblast growth factor-19 display increased metabolic rate and decreased adiposity. Endocrinology 2002; 143: 1741–1747.
2. Holt JA, Luo G, Billin AN, et al. Definition of a novel growth factor-dependent signal cascade for the suppres- sion of bile acid biosynthesis. Genes Dev 2003; 17:
1581–1591.
3. Choi M, Moschetta A, Bookout AL, et al. Identification of a hormonal basis for gallbladder filling.Nat Med2006; 12:
1253–1255.
4. Xie MH, Holcomb I, Deuel B, et al. FGF-19, a novel fibroblast growth factor with unique specificity for FGFR4.Cytokine1999; 11: 729–735.
5. Zweers SJ, Booij KA, Komuta M, et al. The human gall- bladder secretes fibroblast growth factor 19 into bile:
towards defining the role of fibroblast growth factor 19 in the enterobiliary tract.Hepatology2012; 55: 575–583.
6. Fu L, John LM, Adams SH, et al. Fibroblast growth factor 19 increases metabolic rate and reverses dietary and leptin-deficient diabetes. Endocrinology 2004; 145:
2594–2603.
7. Inagaki T, Choi M, Moschetta A, et al. Fibroblast growth factor 15 functions as an enterohepatic signal to regulate bile acid homeostasis. Cell Metab 2005; 2:
217–225.
8. Kong B, Wang L, Chiang JY, et al. Mechanism of tissue- specific farnesoid X receptor in suppressing the expres- sion of genes in bile-acid synthesis in mice. Hepatology 2012; 56: 1034–1043.
9. Kliewer SA and Willson TM. Regulation of xenobiotic and bile acid metabolism by the nuclear pregnane X receptor.J Lipid Res2002; 43: 359–364.
10. Wistuba W, Gnewuch C, Liebisch G, et al. Lithocholic acid induction of the FGF19 promoter in intestinal cells is mediated by PXR. World J Gastroenterol 2007; 13:
4230–4235.
11. Lundasen T, Galman C, Angelin B, et al. Circulating intestinal fibroblast growth factor 19 has a pronounced diurnal variation and modulates hepatic bile acid synthe- sis in man.J Intern Med2006; 260: 530–536.
12. Walters JR, Tasleem AM, Omer OS, et al. A new mech- anism for bile acid diarrhea: defective feedback inhibition of bile acid biosynthesis.Clin Gastroenterol Hepatol2009;
7: 1189–1194.
13. Lenicek M, Duricova D, Komarek V, et al. Bile acid malabsorption in inflammatory bowel disease: assessment by serum markers. Inflamm Bowel Dis 2011; 17:
1322–1327.
14. Schaap FG, van der Gaag NA, Gouma DJ, et al. High expression of the bile salt-homeostatic hormone fibro- blast growth factor 19 in the liver of patients with extra- hepatic cholestasis.Hepatology2009; 49: 1228–1235.
15. Mraz M, Lacinova Z, Kavalkova P, et al. Serum concen- trations of fibroblast growth factor 19 in patients with obesity and type 2 diabetes mellitus: the influence of acute hyperinsulinemia, very-low calorie diet and PPAR-alpha agonist treatment. Physiol Res 2011; 60:
627–636.
16. Pattni SS, Brydon WG, Dew T, et al. Fibroblast growth factor 19 and 7alpha-hydroxy-4-cholesten-3-one in the diagnosis of patients with possible bile acid diarrhea.
Clin Transl Gastroenterol2012; 3: e18.
17. Berr F, Pratschke E, Fischer S, et al. Disorders of bile acid metabolism in cholesterol gallstone disease. J Clin Invest1992; 90: 859–868.
18. Honda A, Yoshida T, Tanaka N, et al. Hepatic choles- terol and bile acid synthesis in Japanese patients with cholesterol gallstones. Gastroenterol Jpn 1993; 28:
406–414.
19. Duane WC, Hartich LA, Bartman AE, et al. Diminished gene expression of ileal apical sodium bile acid trans- porter explains impaired absorption of bile acid in
patients with hypertriglyceridemia.J Lipid Res2000; 41:
1384–1389.
20. Bergheim I, Harsch S, Mueller O, et al. Apical sodium bile acid transporter and ileal lipid binding protein in gallstone carriers.J Lipid Res2006; 47: 42–50.
21. Renner O, Harsch S, Strohmeyer A, et al. Reduced ileal expression of OSTalpha-OSTbeta in non-obese gallstone disease.J Lipid Res2008; 49: 2045–2054.
22. Renner O, Lutjohann D, Richter D, et al. Role of the ABCG8 19H risk allele in cholesterol absorption and gallstone disease.BMC Gastroenterol2013; 13: 30.
23. Zamboni M, Mazzali G, Zoico E, et al. Health conse- quences of obesity in the elderly: a review of four unre- solved questions.Int J Obes (Lond)2005; 29: 1011–1029.
24. Lechleitner M. Obesity and the metabolic syndrome in the elderly – a mini-review. Gerontology 2008; 54:
253–259.
25. Kuczmarski RJ and Flegal KM. Criteria for definition of overweight in transition: background and recommenda- tions for the United States. Am J Clin Nutr 2000; 72:
1074–1081.
26. Hemmelmann C, Brose S, Vens M, et al. Percentiles of body mass index of 18–80-year-old German adults based on data from the Second National Nutrition Survey.
Dtsch Med Wochenschr2010; 135(17): 848–852.
27. Babiarczyk B and Turbiarz A. Body Mass Index elderly people - reference ranges matter.Prog Health Sci2012; 2:
58–67.
28. Renner O, Harsch S, Schaeffeler E, et al. Mutation screening of apical sodium-dependent bile acid trans- porter (SLC10A2): novel haplotype block including six newly identified variants linked to reduced expression.
Hum Genet2009; 125: 381–391.
29. Geick A, Eichelbaum M and Burk O. Nuclear receptor response elements mediate induction of intestinal MDR1 by rifampin.J Biol Chem2001; 276: 14581–14587.
30. Hahn C, Reichel C and von Bergmann K. Serum concen- tration of 7 alpha-hydroxycholesterol as an indicator of bile acid synthesis in humans. J Lipid Res 1995; 36:
2059–2066.
31. Scherer M, Gnewuch C, Schmitz G, et al. Rapid quanti- fication of bile acids and their conjugates in serum by liquid chromatography-tandem mass spectrometry.
J Chromatogr B Analyt Technol Biomed Life Sci 2009;
877: 3920–3925.
32. van Schaik FD, Gadaleta RM, Schaap FG, et al.
Pharmacological activation of the bile acid nuclear farne- soid X receptor is feasible in patients with quiescent Crohn’s colitis.PLoS One2012; 7: e49706.
33. Matysik S, Martin J, Bala M, et al. Bile acid signaling after an oral glucose tolerance test. Chem Phys Lipids 2011; 164: 525–529.
34. Herrera J, Amigo L, Husche C, et al. Fecal bile acid excretion and messenger RNA expression levels of ileal transporters in high risk gallstone patients.Lipids Health Dis2009; 8: 53.
35. Song KH, Li T, Owsley E, et al. Bile acids activate fibro- blast growth factor 19 signaling in human hepatocytes to inhibit cholesterol 7alpha-hydroxylase gene expression.
Hepatology2009; 49: 297–305.
36. Fang Q, Li H, Song Q, et al. Serum fibroblast growth factor 19 levels are decreased in Chinese subjects with impaired fasting glucose and inversely associated with fasting plasma glucose levels. Diabetes Care 2013; 36:
2810–2814.
37. Eren F, Kurt R, Ermis F, et al. Preliminary evidence of a reduced serum level of fibroblast growth factor 19 in patients with biopsy-proven nonalcoholic fatty liver dis- ease.Clin Biochem2012; 45: 655–658.
38. Gerhard GS, Styer AM, Wood GC, et al. A role for fibroblast growth factor 19 and bile acids in diabetes remission after Roux-en-Y gastric bypass. Diabetes Care2013; 36: 1859–1864.
39. Bennion LJ and Grundy SM. Effects of obesity and cal- oric intake on biliary lipid metabolism in man. J Clin Invest1975; 56: 996–1011.
40. Mabee TM, Meyer P, DenBesten L, et al. The mechanism of increased gallstone formation in obese human subjects.
Surgery1976; 79: 460–468.
41. Leijd B. Cholesterol and bile acid metabolism in obesity.
Clin Sci (Lond)1980; 59: 203–206.
42. Mok HY and Grundy SM. Cholesterol and bile acid absorption during bile acid therapy in obese subjects undergoing weight reduction.Gastroenterology1980; 78:
62–67.
43. Einarsson K, Hellstrom K and Kallner M. Bile acid kin- etics in relation to sex, serum lipids, body weights, and gallbladder disease in patients with various types of hyperlipoproteinemia.J Clin Invest1974; 54: 1301–1311.
44. Dostalova I, Kavalkova P, Haluzikova D, et al. Plasma concentrations of fibroblast growth factors 19 and 21 in patients with anorexia nervosa.J Clin Endocrinol Metab 2008; 93: 3627–3632.
45. Stejskal D, Karpisek M, Hanulova Z, et al. Fibroblast growth factor-19: development, analytical characteriza- tion and clinical evaluation of a new ELISA test.Scand J Clin Lab Invest2008; 68: 501–507.