• Keine Ergebnisse gefunden

Ursodeoxycholic acid lowers bile lithogenicity by regulating SCP2 expression in rabbit cholesterol gallstone models

N/A
N/A
Protected

Academic year: 2021

Aktie "Ursodeoxycholic acid lowers bile lithogenicity by regulating SCP2 expression in rabbit cholesterol gallstone models"

Copied!
11
0
0

Wird geladen.... (Jetzt Volltext ansehen)

Volltext

(1)

Original article:

URSODEOXYCHOLIC ACID LOWERS BILE LITHOGENICITY BY REGULATING SCP2 EXPRESSION IN RABBIT CHOLESTEROL

GALLSTONE MODELS

Yunfeng Cui

1

, Zhonglian Li

1

, Erpeng Zhao

1

, Ju Zhang

2

, Naiqiang Cui

1*

1

Department of Surgery, Tianjin Nankai Hospital, Nankai Clinical School of Medicine, Tianjin Medical University, 122 Sanwei Road Nankai District, Tianjin 300100, China

2
Institute of Molecular Biology, Nankai University, 94 Weijin Road Nankai District, Tian- jin 300071, China

* corresponding author: Naiqiang Cui, Department of Surgery, Tianjin Nankai Hospital, Nankai Clinical School of Medicine, Tianjin Medical University, 122 Sanwei Road Nankai District, Tianjin 300100, China. Telephone number: 86-22-27435296; Fax number: 86-22- 27370655; E-mail: yfcuink@hotmail.com

ABSTRACT

Aims: We designed this study to get insight into the disorder of lipid metabolism during cho- lesterol gallstone formation and evaluate the effect of ursodeoxycholic acid on the improve- ment of bile lithogenicity and on expression of lipid related genes.

Methods: Rabbit cholesterol gallstone models were induced by high cholesterol diet. Bile, blood and liver tissues were obtained from rabbits after 0, 1, 2, 3, 4 and 5 weeks. Bile and blood lipids were measured enzymatically. 3-hydroxy-3-methylglutaryl-coenzyme A reduc- tase (HMGCR), cytochrome P450, family 7, subfamily A, polypeptide 1 (CYP7A1) and sterol carrier protein 2 (SCP2) mRNA expressions were detected by using quantitative real-time RT-PCR. Cholesterol saturation index (CSI) was calculated by using Carey table to represent the bile lithogenicity.

Results: Rates of gallstone formation of the 4 and 5 week treatment groups were 100 %, but that of the ursodeoxycholic acid treatment group was only 33.3 %. Expression of HMGCR and SCP2 mRNA in the 4 week group was upregulated and that of CYP7A1 mRNA de- creased as compared with the 0 week group. Ursodeoxycholic acid could significantly extend nucleation time of bile and lower CSI. Ursodeoxycholic acid could reduce the expression of SCP2, but couldn’t influence expression of HMGCR and CYP7A1.

Conclusions: Abnormal expression of HMGCR, CYP7A1 and SCP2 might lead to high litho- genicity of bile. Ursodeoxycholic acid could improve bile lipids and lower bile lithogenicity, thereby reducing the incidence of gallstones. So it might be a good preventive drug for cho- lesterol gallstones.

Keywords: cholesterol gallstones, HMGCR, CYP7A1, SCP2 mRNA, bile lipids, CSI, rabbit models

INTRODUCTION

Gallstone disease is one of the most common gastrointestinal diseases. World- wide prevalence rates scatter between 5 % and 20 %, but may be as high as 70 % in female American Indians. Gallstone disease

is a multifactorial disease based on a com-

plex interaction of environmental and ge-

netic factors (Lammert and Sauerbruch,

2005; Portincasa et al., 2006; Marschall and

Einarsson, 2007). More than 90 % of gall-

stones consist mainly of cholesterol and are

(2)

formed within the gallbladder. Cholesterol hypersaturation of bile is a prerequisite for the formation of such stones. Hypersecre- tion of cholesterol in bile leading to the formation of lithogenic bile is believed to be the major cause of cholesterol gallstones (Venneman and van Erpecum, 2010). Fur- thermore, these changes are closely related to the disorders of lipid metabolism in liver.

However, during the formation of choles- terol gallstones, different links in the dis- turbance of cholesterol metabolism and their effects in lithogenesis still have many controversies.

Bile formation is essential for the re- moval of excess dietary cholesterol. Cyto- chrome P450, family 7, subfamily A, poly- peptide 1 (CYP7A1) catalyzes the first rate- limiting reaction of cholesterol catabolic pathway converting cholesterol to bile salts which are essential for keeping cholesterol molecules solubilized in bile. Some investi- gators observed tendencies for reduced CYP7A1 activity in gallstone disease pa- tients (Reihnér et al., 1991; Ito et al., 1996).

Xie et al. (2009) found that the AU-rich RNA binding-protein Apobec-1 mediated post-transcriptional regulation of murine CYP7A1 expression and increased suscep- tibility to diet-induced gallstone formation.

Other research indicated that there was no difference of cholesterol 7-hydroxylase mRNA expression in gallstone susceptible mice, but in the gallstone resistant mice the expression level of 7-hydroxylase mRNA increased (Tazuma et al., 1998). Khanuja et al. (1995) found the regulation of the rate- limiting enzyme in cholesterol biosynthesis, 3-hydroxy-3-methylglutaryl-coenzyme A reductase (HMGCR), may be pivotal in de- termining the occurrence and severity of cholesterol hypersecretion and hence litho- genicity of gallbladder bile. Lammert et al.

(1999) found that HMGCR in cholesterol synthesis was not down-regulated in C57L mice fed a lithogenic diet which contains large amounts of cholesterol. Caroli-Bosc et al. (2001) found that increased activity of HMGCoA reductase corrsponds with a rise in hepatic cholesterol synthesis, so that the

Cholesterol Saturation Index of bile would also go up. Some researchers found the overexpression of sterol carrier protein 2 (SCP2) might accelerate the transportation of cellular cholesterol, increase the choles- terol in the bile and promote the formation of gallstones (Ito et al., 1996; Fuchs et al., 1998). Our former finding indicated that SCP2 might be one of the genetic factors contributing to cholesterol gallstone for- mation (Cui et al., 2011).

This study is aimed to investigate the li- pid changes in blood and bile in order to find out the relationship between the disor- der of lipid metabolism and the formation of cholesterol gallstones. We also evaluated the effect of ursodeoxycholic acid on the improvement of lithogenicity of rabbit model bile and expression of lipid related genes.

MATERIALS AND METHODS Animals, diets and treatment

This study was approved by the Animal Care and Use Committee in Tianjin Nankai Hospital. Male and female white Japanese rabbits were obtained from the Experi- mental Animal Center of Tianjin Medical University. They were divided randomly into 0 week group (0W) as a control group and as 1 to 5 week groups (1W, 2W, 3W, 4W, 5W) as five experimental groups, and ursodeoxycholic acid treatment group (U) each constisting of seven rabbits. Rabbits in control group were given a normal diet, but those in experimental groups were fed with 1.2 % cholesterol diet for one to five weeks (1W to 5W). Rabbits in the ursodeoxy- cholic acid treatment group (U) were fed with 1.2 % cholesterol diet for four weeks and were simultaneously orally treated with ursodeoxycholic acid (75 mg/kg) by gavage (Liu and Jun, 1997). All animals were maintained in separate cages with free ac- cess to water.

Blood, bile and liver sampling

At the end of each experiment, follow-

ing an overnight fasting, animals were anes-

thetized. After the collection of samples,

(3)

rabbits were euthanatized. Blood samples were collected for the measurement of blood lipids and portions of liver were ob- tained for the histological analysis and the analysis of gene expression. Bile specimen was aspirated from gallbladder and kept for subsequent analysis. The gallbladder was cut open under the microscope and the gall- stones and cholesterol crystals were evalu- ated.

Identification of gallstones and cholesterol crystals

Criteria for gallstones:

If gallstone particles were found by in- spection with the naked eye or large dense clumps of cholesterol crystals were seen under the microscope, samples were con- sidered positive for gallstone formation.

Quantitative criteria for cholesterol cry- stals:

A portion of fresh gallbladder bile was centrifuged, the sediment smears were ob- served microscopically, and cholesterol crystals were quantified according to Juni- per standard (Block and Priest, 1967).

Nucleation time of gallbladder bile

Biles were centrifuged 100,000 x g at 37 °C for 2 hours in order to remove the cholesterol crystals. Biles were taken and put in the incubator at 37 °C and were ob- served every day under the polarizing mi- croscope. The time when cholesterol mono- hydrate crystals appeared was named nu- cleation time and the observation time was no more than 21 days (Holan et al., 1979).

Analysis of blood lipids

Plasma triglycerides (TG), total choles- terol (TC), high density lipoprotein choles- terol (HDL-C) and low density lipoprotein cholesterol (LDL-C) were measured on Hi- tachi 704 Analyzer (Roche Diagnostics, In- dianapolis) with enzymatic methods using the manufacturer’s reagents and instruc- tions.

Analysis of bile lipids

The concentrations of biliary cholesterol, phospholipids, and total bile acids were measured using enzymatic techniques (Roda et al., 1975; Qureshi et al., 1980;

Talalay, 1960). Cholesterol Saturation In- dex (CSI) was calculated by using the Car- ey table (Carey, 1978).

Quantitative real-time RT-PCR

Total RNA was prepared from liver tis- sue by using the Trizol method. Briefly, 1 µg RNA was reverse-transcribed by using random primer hexamers. Amplification was carried out with an ABI 7300 real-time PCR system (Applied Biosystems) using SYBR green I. The reference gene was glyceraldehyde 3-phosphate dehydrogenase (GAPDH). Primer sequences for rabbit HMGCR (forward 5’-ATGGAATTCCAT- GGCTGGGAGCATAGGAG-3’ and re- verse 5’-TCCTTGAACACCTAGCATCT- GC-3’), CYP7A1 (forward 5’-ATGGAAT- TCCATCTCAAGCAAACACCATTCC-3’

and reverse 5’-TGCATTAACTGTGGAT- AAAGAGC-3’), and SCP2 (forward 5’- GCCAACGAACTCCTCACTTAT-3’ and reverse 5’-TTGCCATTCTTCACATCT- ACCA-3’) were designed to span an intron- ic sequence and were validated by PCR and gel analysis.

Microscopy/Histology

Liver and gallbladder tissues were fixed with formalin and embedded with paraffin.

The sections were stained with hematoxylin and eosin (HE), and observed under a light microscope. Three HE sections from each group were scored (Zeymer et al., 1992).

Slides were examined at high magnifica- tion. Liver cells with steatosis and total cells were counted.

Statistical analysis

All data were expressed as mean ±

standard deviation. Differences between

control and experimental groups were eval-

uated by Chi-square test and one-way anal-

ysis of variance (ANOVA). P<0.05 was

considered statistically significant (α=0.05).

(4)

RESULTS Analysis of rabbit gallstones

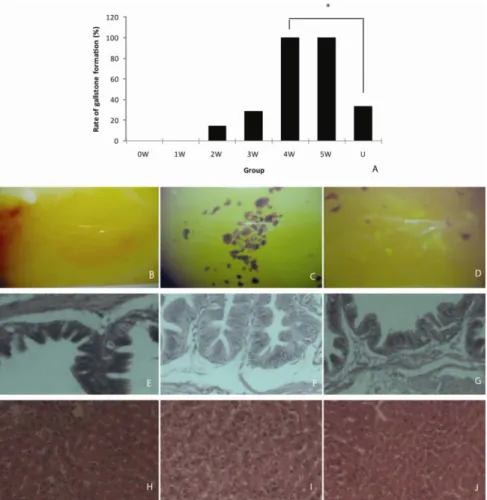
Gallstones in gallbladder were not found in any animal of the 0W group fed with routine diet (Figure 1B). However, cholesterol gallstones were found in the ex- perimental groups fed with dietary choles- terol. All gallstones appeared as small brown black stones with the naked eye and in some cases microliths could be observed under the 20 x light microscope (Figure 1C). The rate of gallstones gradually in- creased with diet time and those of 4W and 5W groups were 100 %, but the rate of ur- sodeoxycholic acid treatment group was 33.3 % (Figure 1A). The rates of gallstone formation between groups can be consid- ered as statistical significance, χ

2

= 27.453, υ = 5, P <0.01 (bilateral) (Table 1).

Under the 100X light microscope (Fig- ure 1D), the examination of rabbit gallblad- der bile showed that the cholesterol mono- hydrate crystals increased gradually with cholesterol diet time. The system of Juniper and Burson for counting microlithiasis was

employed to evaluate the formation of gall- stones (Table 2). The differences between 6 groups was significant, χ2 = 33.728, υ = 5, P  < 0.01 (bilateral).

Histological analysis of liver and rabbit gallbladder after the treatment of urso- deoxycholic acid

The percent of liver cells with steatosis was calculated by positive cells/total cells x100 and results are given in mean ± stand- ard error. The section of liver in 4W group showed a lot of fat were accumulated in the liver parenchyma, there were more liver cells with steatosis in the 4W group (88.1 % ± 2.3 %) (Figure 1I) than in the 0W group (2.2 % ± 0.3 %) (Figure 1H) (P<

0.05). Compared with the 4W group, the steatosis was alleviated in the U group (7.2 % ± 1.4 %) (Figure 1J) (P<0.05). The section of gallbladder in the 4W group (Figure 1F) showed some proliferation of epithelium and some infiltration of inflam- matory cell, but those in the 0W group (Figure 1E) and U group (Figure 1G) showed only few of them.

Figure 1: Gallstone for- mation and histological examination of gallblad- der and liver. A. Quantifi- cation of gallstone for- mation in rabbit models by means of high cholesterol diet. B-D. Detection of stone particles in bile fluid:

(B) normal bile of 0W group, (C) stone particles of 4W group, and (D) cho- lesterol crystals of 4W group. E-G. Histological analysis of gallbladder thin sections stained with HE:

(E) 0W group, (F) 4W group showing some prolif- erations of epithelium and some infiltrations of in- flammatory cell, and (G) U group. H-J. Histological examination of liver thin sections stained with HE:

(H) 0W group, (I) 4W

group, and (J) U group

showing less liver cells with

steatosis than 4W group. 0-

5 W, 0-5 week; U, urso-

deoxycholic acid treatment.

(5)

Table 1: Analysis of gallstone formation in rabbits

Group Number of rabbit Number of gallstone rabbit

Rate of gallstone formation ( %)

*

0W Group 7 0 0

1W Group 7 0 0

2W Group 7 1 14.3

3W Group 6 2 28.6

4W Group 7 7 100

5W Group 6 6 100

U Group 6 2 33.3**

*The differences between 7 groups was significant, χ

2

=27.453, υ =6, P <0.01 (bilateral). 0-5 W, 0-5 week; U, ursodeoxycholic acid treatment

** Compared with 4W group, P<0.05

Table 2: Analysis of cholesterol crystal formation in rabbits

Group 0W

Group

1W Group

2W Group

3W Group

4W Group

5W Group

U Group

- 6 1 0 0 0 0 0

+ 1 6 6 0 0 0 6

++ 0 0 1 2 1 1 2

+++ 0 0 0 3 2 1 0

++++ 0 0 0 1 4 4 0

The differences between 7 groups was significant, χ

2

=33.728, υ =6, P<0.01 (bilateral). 0-5 W, 0-5 week; U, ursodeoxycholic acid treatment

Changes of plasma TG, TC, HDL-c and LDL-c

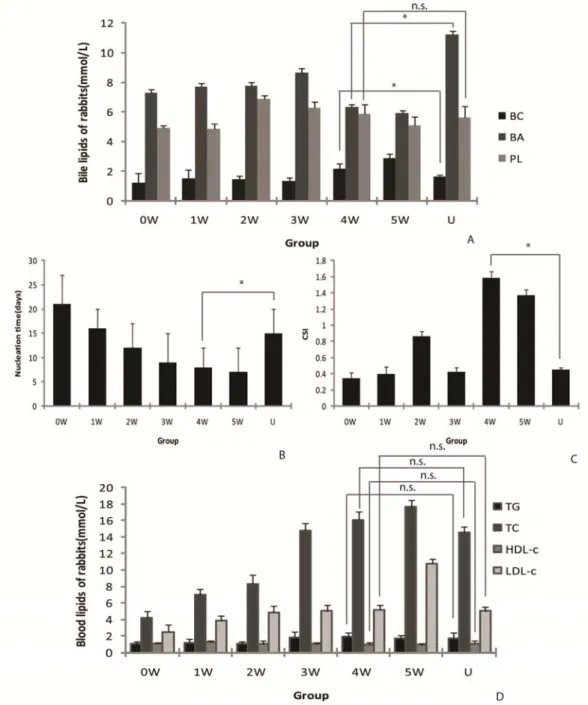
As shown in Figure 2D, the concentra- tions of plasma TC and LDL-c gradually increased with the prolonged feeding time of dietary cholesterol (P<0.05). The plasma levels of TC (16.07 ± 1.04 mmol/L) and LDL-c (5.18 ± 0.51 mmol/L) in the 4W group were higher than those (4.17 ± 0.85, 2.46 ± 0.89 mmol/L) in the 0W group (P<0.05). HDL-c showed a decreasing ten- dency without statistical significance (P>0.05) whereas TG showed an increasing tendency also without statistical signifi- cance (P>0.05). There were no differences about plasma TC, TG, HDL-c and LDL-c between the 4W and the U group (P>0.05).

Analysis of bile cholesterol, bile acids and pospholipids

As shown in Figure 2A, the bile choles- terol of the 4W and 5W groups significantly increased by about 2 times as compared with the control group. The bile cholesterol of the 4W group (2.17 ± 0.37 mmol/L) was

higher than that of the 0W group (1.20 ± 0.65 mmol/L) (P<0.05). Total bile acids showed a slight increase during the dietary cholesterol feeding in the 2W and 3W groups, but then decreased in 4W and 5W groups, and total bile acids of 4W and 5W groups significantly decreased as compared with the control group (P<0.05). Total bile acid of the 4W group (6.36 ± 0.17 mmol/L) was lower than that of the 0W group (7.29

± 0.26 mmol/L) (P<0.05). Bile phospholi-

pids showed a slight increase during the

dietary cholesterol feeding in 2W and 3W

groups, and then decreased in the 4W and

5W groups, but there was no significant dif-

ference for bile phospholipids between 4W

group and the control group (P>0.05). Ur-

sodeoxycholic acid could reduce the bile

cholesterol from 2.17 ± 0.37 mmol/L (4W

group) to 1.66 ± 0.067 mmol/L (U group)

(P<0.05) and significantly increased the

bile acids from 6.36 ± 0.17 mmol/L (4W

group) to 11.23 ± 0.25 mmol/L (U group)

(P<0.05). However, it couldn’t influence

the bile phospholipid level.

(6)

Analysis of bile nucleation time and CSI Bile   nucleation   times of all  animals were   gradually   reduced from 0 to 5 weeks   (Fig- ure 2B).   The bile   nucleation   time of the 4W group (8 ± 4 days) was significantly shorter than that of the 0W group (21 ± 6 days) (P<0.05). Compared with 4W group (8 ± 4 days), the bile nucleation time of U group (15 ± 5 days) was extended (P<0.05). CSIs

increased with the prolonged feeding time of dietary cholesterol (Figure 2C). CSI of the 4W group (1.58 ± 0.09) was significant- ly higher than that of the 0W group (0.34 ± 0.08) (P<0.05). CSI in the U group (0.45 ± 0.026) significantly decreased compared with the 4W group (1.58 ± 0.085) (P<0.05).

Figure 2: Analysis of bile lipids, nucleation time, CSI and blood lipids in rabbit gallstone models. A. Analy-

sis of bile lipids, showing that the U group had a higher BA level than the 4W group (*) and a lower BC level than

the 4W group (*). B. Analysis of bile nucleation time. C. Analysis of bile CSI, showing that the U group had a low-

er CSI than the 4W group (*). D. Analysis of blood lipids, showing that there were no differences in plasma TC,

TG, HDL-c and LDL-c between 4W and U group (n.s.). “*” indicates P<0.05. “n.s.” indicates “not significant”. BC,

bile cholesterol; BA, bile acids; PL, phospholipid; TG, triglyceride; TC, total cholesterol; HDL-c, high density lipo-

protein cholesterol; LDL-c, low density lipoprotein cholesterol; 0-5 W, 0-5 week; U, ursodeoxycholic acid treatment

(7)

The mRNA expression of HMGCR, CYP7A1 and SCP2 in liver tissue

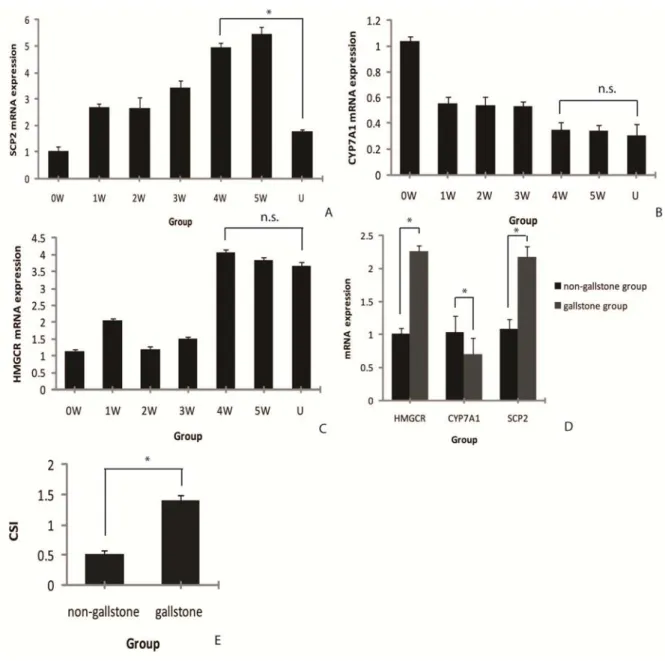
As shown in Figure 3, HMGCR mRNA levels were increased with the prolonged feeding time of dietary cholesterol (P<0.05), but there was a valley in the 2W and 3W groups. The HMGCR mRNA level of the 4W group (4.0587 ± 0.1011) was higher than that of the 0W group (1.12 ± 0.068) (P<0.05). CYP7A1 mRNA levels gradually decreased with the prolonged feeding time of dietary cholesterol (P<0.05). The CYP7A1 mRNA level of the 4W group (0.3485 ± 0.0597) was lower than that of the 0W group (1.04 ± 0.039) (P<0.05). SCP2 mRNA levels were also gradually increased with the prolonged feeding time of dietary cholesterol (P<0.05). The SCP2 mRNA level of 4W group (4.96 ± 0.15) was about 5-fold higher than that of 0W group (1.02 ± 0.17) (P<0.05). Our results showed that ursode- oxycholic acid could also reduce the ex- pression of SCP2 from 4.96 ± 0.15 (4W group) to 1.76 ± 0.08 (U group) (P<0.05), but couldn’t significantly reduce the ex- pression of HMGCR (P>0.05) or increase the expression of CYP7A1 (P>0.05) com- pared with the 4W group.

The expression differences of HMGCR, CYP7A1 and SCP2 mRNA between gall- stone and non-gallstone groups

As shown in Figure 3D and 3E, we di- vided all the rabbits fed with high choles- terol diet into two groups, gallstone group (16 rabbits) and non-gallstone group (24 rabbits). Then we detected the mRNA ex- pressions of HMGCR, CYP7A1 and SCP2 in gallstone and non-gallstone groups by using quantitative real-time RT-PCR.

HMGCR (2.26 ± 0.075) and SCP2 (2.18 ± 0.179) mRNA expression in the gallstone group was significantly higher than those (1.00 ± 0.088 and 1.08 ± 0.152) in the non- gallstone group (P<0.05). CYP7A1 mRNA was expressed lower in the gallstone group (0.699 ± 0.446) than that in the non- gallstone group (1.04 ± 0.24) (P<0.05). Fur- thermore CSI in the gallstone group (1.41 ±

0.08) was significantly higher than that in thenon-gallstone group (0.506 ± 0.073) (P<0.05).

DISCUSSION

In this study, we used high cholesterol diet to induce rabbit cholesterol gallstones.

The rate of gallstone formation gradually increased with feeding time, and the for- mation of cholesterol monohydrate crystal also increased gradually. Our experiments indicated that 4 weeks were long enough to set up the rabbit cholesterol gallstone mod- el, which was consistent with other previ- ous studies (Zhao et al., 1998). So we chose 4 week as an optimal time for setting up the gallstone model and observing the preven- tive effect of ursodeoxycholic acid on cho- lesterol gallstones.

Data of previous epidemiological stud- ies showed that levels of plasma lipoprotein cholesterol varied in cholesterol gallstone patients (Hayes et al., 1992; Busch and Ma- tern, 1991). In normal people, the plasma LDL-c concentration appeared to be related to biliary cholesterol (Lee et al., 1985). An- imal studies showed that in cholesterol fed hamsters with a VLDL-c/HDL-c ratio greater than 1.0, cholesterol gallstone for- mation occurred easily (Dietschy et al., 1993). We found that plasma TC and LDL- c in the 4W group were 4 and 2 fold those in the 0W control group respectively. LDL- c is a cholesterol-rich lipoprotein (North et al., 2006), and LDL-c cholesterol is the main resource of cholesterol from plasma to the liver. In this model, high cholesterol diet could lead to a large accumulation of cholesterol in the blood. Under this circum- stance, cholesterol couldn’t be cleared through the bile acid pathway, but it might be secreted into the bile directly.

Our results showed that the cholesterol

level of gallbladder bile increased with cho-

lesterol diet time. Under the high cholester-

ol diet, there was often an impaired bile ac-

id synthesis, so the excessive cholesterol is

mainly excreted into the bile and then leads

to high lithogenicity of bile and gallstone

formation. Bile acids increased in the first

(8)

Figure 3: The expression of lipid related genes in rabbit gallstone models. A-C. Expression of SCP2 (A), CYP7A1 (B) and HMGCR mRNA (C) during cholesterol gallstone formation: (A) The SCP2 mRNA level is lower in the U group than in the 4W group (*); (B and C) mRNA levels of CYP7A1 and HMGCR, do not differ between the U and 4W group (n.s.). D. Expression of SCP2, CYP7A1 and HMGCR between gallstone and non- gallstone groups. E. CSI of the gallstone and non-gallstone groups, showing a higher CSI in the gallstone group (*). “*” indi- cates P<0.05. “n.s.” indicates “not significant”. 0-5 W, 0-5 week; U, ursodeoxycholic acid treatment


stage and then decreased with feeding time.

The transient increase of bile acids may be due to the accumulation of cholesterol which induced higher expression of CYP7A1 and enhanced the bile acid syn- thesis, but after that we found that the se- cretion of bile acids decreased. The possible reasons were that the long-term excessive exogenous cholesterol might inhibit the ac- tivity and expression of CYP7A1 and fur- ther reduce the bile acid synthesis (Rudel et

al., 1994). In our study, we found that bile CSI gradually increased and bile nucleation time was gradually shortened in the process of cholesterol stone formation.

When we compared the gallstone and

non-gallstone groups, we found that the ex-

pression of HMGCR was elevated in the

former, and at the same time CSI was sig-

nificantly higher in the gallstone group than

that in the non-gallstone group. It was

found that the expression of HMGCR

(9)

mRNA increased with cholesterol diet time.

This indicated that high cholesterol diet might induce the overexpression of HMGCR, increase bile CSI and promote the formation of gallstones. We found that the expression of CYP7A1 increased in the 2W and 3W group, and then decreased in the 4W and 5W group. This indicated that the high cholesterol diet may impair ex- pression of CYP7A1 and the expression of CYP7A1 decreased in the gallstone group compared with the non-gallstone group.

The reason may be that the conversion of cholesterol to bile acids was blocked, which might cause accumulated cholesterol in hepatocytes to be excreted directly into bile.

We also found that the expression of SCP2 increased gradually with feeding time, and the expression of SCP2 was elevated in the gallstone group compared with the non- gallstone group. This indicates that the high cholesterol diet might induce the overex- pression of SCP2. Therefore, during the gallstone formation induced by high choles- terol diet, there were abnormal expressions of HMGCR, CYP7A1 and SCP2.

In this study, we chose ursodeoxycholic acid as a preventive drug for gallstone for- mation and used the 4W group as the con- trol group for comparison. The rate of gall- stone formation in the 4W group was 100 %, but the rate in the U group was 33.3 %. Compared with the 4W group, the steatosis was significantly alleviated in the U group. This indicates that ursodeoxy- cholic acid might improve the steatosis of liver. The serum cholesterol and LDL-c in the U group was not lower than that in the 4W group. Obviously, ursodeoxycholic ac- id can’t improve blood lipid components under the overload of cholesterol in the body. We also found that ursodeoxycholic acid could reduce the gallbladder bile cho- lesterol and significantly increase the bile acids in bile, but it couldn’t influence the bile phospholipid level. Ursodeoxycholic acid could significantly lower CSI of bile, extend the nucleation time of bile and re- duce the expression of SCP2, but couldn’t influence the expression of HMGCR and

CYP7A1 during the formation of gall- stones.

In a word, our result was consistent with reports about ursodeoxycholic acid from other researchers. The early and long-term application of ursodeoxycholic acid could prolong cholesterol nucleation time, im- prove gallbladder emptying (Sharma et al., 1998; van de Heijning et al., 1999), and re- duce pain and inflammation (Tomida et al., 1999). We found that ursodeoxycholic acid could increase bile acids and reduce biliary cholesterol, so it can increase the solubility of cholesterol, thereby reducing the inci- dence of gallstones. Finally ursodeoxy- cholic acid can also alleviate the steatosis of liver under high cholesterol diet. So it might be a good preventive drug for choles- terol gallstones.

Declaration of funding interests

This study was funded by Natural Sci- ence Foundation of Tianjin Bureau of Health, No. 07kg15, Natural Science Foun- dation of Tianjin, No. 08JCYBJC08700 and National Natural Science Foundation of China, No. 30600602.

REFERENCES

Block MA, Priest RJ. Acute pancreatitis related to grossly minute stones in a radio- graphically normal gallbladder. Am J Dig Dis 1967;12:945-8.

Busch N, Matern S. Current concepts in cholesterol gallstone pathogenesis. Eur J Clin Invest 1991;21:453-60.

Carey MC. Critical tables of calculating the cholesterol saturation of native bile. J Lipid Res 1978;19:945-55.

Caroli-Bosc FX, Le Gall P, Pugliese P,

Delabre B, Caroli-Bosc C, Demarquay JF et

al. Role of fibrates and HMG-CoA reduc-

tase inhibitors in gallstone formation: epi-

demiological study in an unselected popula-

tion. Dig Dis Sci 2001;46:540-4.

(10)

Cui Y, Li Z, Zhao E, Jia Y, Li D, Zhang J et al. Overexpression of Sterol Carrier Protein 2 in patients with hereditary cholesterol gallstones. BMC Gastroenterology 2011;

11:10.

Dietschy JM, Turley SD, Spady DK. Role of liver in the maintenance of cholesterol and low density lipoprotein homeostasis in different animal species, including humans.

J Lipid Res 1993; 34:1637-59.

Fuchs M, Lammert F, Wang DQ, Paigen B, Carey MC, Cohen DE. Sterol carrier pro- tein 2 participates in hypersecretion of bili- ary cholesterol during gallstone formation in genetically gallstone susceptible mice.

Biochem J 1998;336:33-7.

Hayes KC, Livinston A, Trautwein EA. Di- etary impact on biliary lipids and gall- stones. Annu Rev Nutr 1992;12:299-326.

Holan KR, Holzbach RT, Hermann RE, Cooperman AM, Claffey WJ. Nucleation Time: A Key factor in the pathogenesis of cholesterol gallstone disease. Gastroenter- ology 1979;77:611-7.

Ito T, Kawata S, Imai Y, Kakimoto H, Trzaskos JM, Matsuzawa Y. Hepatic cho- lesterol metabolism in patients with choles- terol gallstones: enhanced intracellular transport of cholesterol. Gastroenterology 1996;110:1619-27.

Khanuja B, Cheah YC, Hunt M, Nishina PM, Wang DQ, Chen HW et al. Lith1, a major gene affecting cholesterol gallstone formation among inbred strains of mice.

Proc Natl Acad Sci USA 1995; 92:7729-33.

Lammert F, Sauerbruch T. Mechanisms of disease: the genetic epidemiology of gall- bladder stones. Nat Clin Pract Gastroenterol Hepatol 2005;2:423–33.

Lammert F, Wang DQ, Paigen B, Carey MC. Phenotypic characterization of lith genes that determine susceptibility to cho- lesterol cholelithiasis in inbred mice: inte- grated activities of hepatic lipid regulatory enzymes. J Lipid Res 1999;40:2080-90.

Lee DWT, Gilmore CJ, Bonorris G, Cohen H, Marks JW, Cho-Sue M et al. Effect of dietary cholesterol on biliary lipids in pa- tients with gallstones and normal subjects.

Am J Clin Nutr 1985;42:414-20.

Liu F, Jun Z (eds): Experimental zoology.

Beijing: Agricultural Science and Technol- ogy Press of China, 1997.

Marschall HU, Einarsson C. Gallstone dis- ease. J Intern Med 2007;261:529–42.

North KE, Göring HH, Cole SA, Diego VP, Almasy L, Laston S et al. Linkage analysis of LDL cholesterol in American Indian populations: the Strong Heart Family Study. J Lipid Res 2006;47:59-66.

Portincasa P, Moschetta A, Palasciano G.

Cholesterol gallstone disease. Lancet 2006;

368:230–9.

Qureshi MY, Murphy GM, Dowling RH.

The enzymatic determination of total phos- pholipid in bile and bile-rich duodenal aspi- rates. Clin Chim Acta 1980;105:407–10.

Reihnér E, Angelin B, Björkhem I, Einars- son K. Hepatic cholesterol metabolism in cholesterol gallstone disease. J Lipid Res 1991;32:469-75.

Roda A, Festi D, Sama C, Mazzella G, Ali- ni R, Roda E et al. Enzymatic determination of cholesterol in bile. Clin Chim Acta 1975;64:337–41.

Rudel L, Deckelman C, Wilson M, Scobey

M, Anderson R. Dietary cholesterol and

down-regulation of cholesterol 7-hydroxy-

lase and cholesterol absorption in African

monkey. J Clin Invest 1994;93:2463-72.

(11)

Sharma BC, Agarwal DK, Dhiman RK, Baijal SS, Choudhuri G, Saraswat VA. Bile lithogenicity and gallbladder emptying in patients with microlithiasis: effect of bile acid therapy. Gastroenterology 1998;115:

124-8.

Talalay P. Enzymatic analysis of steroid hormones. Methods Biochem Anal 1960;8:

119–43.

Tazuma S, Kajiyama G, Mizuno T, Yama- shita G, Miura H, Kajihara T et al. A com- bination therapy with simvastatin and ur- sodeoxycholic acid is more effective for cholesterol gallstone dissolution than is ur- sodeoxycholic acid monotherapy. J Clin Gastroenterol 1998;26:287-91.

Tomida S, Abei M, Yamaguchi T, Matsu- zaki Y, Shoda J, Tanaka N et al. Long-term ursodeoxycholic acid therapy is associated with reduced risk of biliary pain and acute cholecystitis in patients with gallbladder stones: a cohort analysis. Hepatology 1999;

30:6-13.

van de Heijning BJ, van de Meeberg PC, Portincasa P, Doornewaard H, Hoebers FJ, van Erpecum KJ et al. Effects of ursode- oxycholic acid therapy on in vitro gall- bladder contractility in patients with chole- sterol gallstones. Dig Dis Sci 1999;44: 190- 6.

Venneman NG, van Erpecum KJ: Patho- genesis of gallstones. Gastroenterol Clin North Am 2010,39:171-83.

Xie Y, Blanc V, Kerr TA, Kennedy S, Luo J, Newberry EP et al. Decreased expression of cholesterol 7alpha-hydroxylase and al- tered bile acid metabolism in Apobec-1-/- mice lead to increased gallstone suscepti- bility. J Biol Chem 2009;284:16860-71.

Zeymer U, Fishbein MC, Forrester JS, Cer- cek B. Proliferating cell nuclear antigen immunohistochemistry in rat aorta after bal- loon denudation. Comparison with thymi- dine and bromodeoxyuridine labeling. Am J Pathol 1992;141:685-90.

Zhao JC, Xiao LJ, Zhu H, Shu Y, Cheng

NS. Changes of lipid metabolism in plasma,

liver and bile during cholesterol gallstone

formation in rabbit model. World J Gastro-

enterol 1998;4:337-9.

Abbildung

Figure 1: Gallstone for- for-mation and histological  examination of  gallblad-der and liver
Table 2: Analysis of cholesterol crystal formation in rabbits
Figure 2: Analysis of bile lipids, nucleation time, CSI and blood lipids in rabbit gallstone models
Figure 3: The expression of lipid related genes in rabbit gallstone models. A-C. Expression of SCP2 (A),  CYP7A1 (B) and HMGCR mRNA (C) during cholesterol gallstone formation: (A)  The SCP2 mRNA level is lower  in the U group than in the 4W group (*); (B a

Referenzen

ÄHNLICHE DOKUMENTE

Synthetic modification of common bile acids by attachment of small organic fluorescent dyes to the bile acid side chain resulted in bright, fluorescent probes that interact with

Herein we report a series of experiments aimed at test- ing whether an intravenously administered fluorescent bile acid would enhance visualization of the biliary

Lack of 7-oxolithocholic acid reduction by 11β-HSD1 leads to its accumulation: a potential biomarker of impaired glucocorticoid activation...

Age-adjusted differences in quantile (Q10, Q25, Q50, Q75, Q90) cardiovascular disease biomarker levels between current rotating night shift workers (N=17) and day workers

I hereby declare that my thesis 'Quantitative Proteomics Analysis of Global Protein Expression in Campylobacter jejuni Cultured in Sublethal Concentrations of

4.3.1 Bile acid supplementation prevented diet-induced obesity in GF but not in SPF mice 59 4.3.2 Diet and colonization status modulated hepatic lipid and bile acid metabolism

The C2?-bile acids and €29 dicarboxylic bile acid were identified by their R compound values (tab. 1) and their mass spectrum data were compared to reference compound tables

As the pathway for bile salt degradation merges with metabolic pathways for bacterial transformation of other steroids, such as testosterone and cholesterol, this