ECIS 2015 Completed Research Papers ECIS 2015 Proceedings
Spring 5-29-2015
Analysing the Contribution of Coupling Metrics for the Development and Management of Process Architectures
Daniel Braunnagel
University of Regensburg, daniel.braunnagel@wiwi.uni-regensburg.de
Florian Johannsen
University of Regensburg - Department Information Systems, Florian.Johannsen@wiwi.uni-regensburg.de
Susanne Leist
University of Regensburg, susanne.leist@wiwi.uni-regensburg.de
Follow this and additional works at:http://aisel.aisnet.org/ecis2015_cr
This material is brought to you by the ECIS 2015 Proceedings at AIS Electronic Library (AISeL). It has been accepted for inclusion in ECIS 2015 Completed Research Papers by an authorized administrator of AIS Electronic Library (AISeL). For more information, please contact
elibrary@aisnet.org.
Recommended Citation
Braunnagel, Daniel; Johannsen, Florian; and Leist, Susanne, "Analysing the Contribution of Coupling Metrics for the Development and Management of Process Architectures" (2015).ECIS 2015 Completed Research Papers.Paper 19.
ISBN 978-3-00-050284-2
http://aisel.aisnet.org/ecis2015_cr/19
Twenty-Third European Conference on Information Systems (ECIS), Münster, Germany, 2015 1
ANALYSING THE CONTRIBUTION OF COUPLING MET- RICS FOR THE DEVELOPMENT AND MANAGEMENT OF
PROCESS ARCHITECTURES
Complete Research
Daniel Braunnagel, University of Regensburg, Universitätsstraße 31, 93053 Regensburg, Germany, daniel.braunnagel@wiwi.uni-regensburg.de
Florian Johannsen, University of Regensburg, Universitätsstraße 31, 93053 Regensburg, Germany, florian.johannsen@wiwi.uni-regensburg.de
Susanne Leist, University of Regensburg, Universitätsstraße 31, 93053 Regensburg, Germany, susanne.leist@wiwi.uni-regensburg.de
Abstract
Currently, the development and modeling of enterprise architectures is an intensively discussed topic in both science and practice. Process architectures represent a core element in recent enterprise ar- chitecture frameworks. With process models being a central means for communicating and document- ing the process architectures, both their quality and understandability are decisive. However, the con- cept of process model quality is still not fully understood. The recent development has highlighted the role of coupling in models. Coupling is expected to represent an important dimension of quality for conceptual models. Still, this perspective is hardly understood and its definition vague. Therefore, this work collects diverse coupling interpretations in the field of process modelling and integrates them to a common and precise definition. Once introduced and formally specified, the metrics serve as a basis for a discussion on coupling and on how the future development in respect to coupling could look like.
The main findings are that currently metrics evaluate either the documentation of the process archi- tecture regarding its understandability or they contribute to the individual applications of process architectures. These findings support practitioners selecting metrics for a particular task and scien- tists to identify research gaps for further development.
Keywords: Process architecture, Process modeling, Coupling
1 Introduction
The systematic development and modeling of enterprise architectures is not only an intensively dis- cussed topic in literature (Zachman, 1987), but also an important subject in practice (Jung, 2005; Uhl, 2004; Davis, 2013; Harmon and Wolf, 2014). Against the background of constantly changing markets, the fast development of new technologies, and increasing customer demands, it is necessary to imple- ment changes throughout all levels of the organizations quickly (Harmon and Wolf, 2014). Above all, enterprise architectures support the change in companies by describing the most important objects as well as interdependencies among them. Further, typical areas of application are analyses of interfaces (Aier et al., 2008), e.g. to identify dependencies which have to be considered by changes or to foster uniformity. Likewise, enterprise architectures are used to define standards, e.g. as a consistent specifi- cation for processes or IT functions, to counteract historically grown and often very heterogeneous landscapes (Buhl and Heinrich, 2004). A core element of an enterprise architecture is the process ar- chitecture (Leist and Zellner, 2008), which is defined as the type of processes it contains and the rela-
Twenty-Third European Conference on Information Systems (ECIS), Münster, Germany, 2015 2 tionships among them (Barros, 2007). The importance of process architectures is illustrated by the fact that they can be found in many enterprise architecture frameworks. In practice, processes are also seen as the most important objects within enterprise architectures (Aier et al., 2008).
Practitioners and scientists identified the documentation, which is the essential prerequisite for an overall transparency of the enterprise’s operations or for the ability to support change or to define standards, as one of the main purposes for architectures and accordingly for process architectures (Aier et al., 2008; Malinova et al., 2013). Architectures are usually described by means of models (Ferstl and Sinz, 2006). Every model provides a specific perspective of the architecture. For instance, the process model takes the perspective of an enterprise’s operations and contains its decomposition into a set of activities linked by a logical and temporal flow. In addition, it includes a link to the data model by specifying which activities interact with which information objects. To fulfil the documenta- tion purpose, namely the quality, by means of its ease of understanding of every single model as well as the interdependencies of all models, is of utmost importance.
To address the issue of evaluating the ease of understanding of conceptual models, previous research systematized the knowledge on conceptual evaluation in categories such as complexity, modularity, size or cohesion. These categories were supported by corresponding metrics (cf. Vanderfeesten et al., 2007a; Gruhn and Laue, 2006). Also, works focused on alternative approaches like top-down frame- works (cf. Becker et al., 2000), pragmatic guidelines (cf. Sharp and McDermott, 2009), and empirical studies (cf. Briand and Wust, 2001; Zugal et al., 2013). Recently, “coupling” has been introduced as another perspective on the quality of process models which focuses the effect of dependencies among processes (cf. Vanderfeesten et al., 2007a; Vanderfeesten et al., 2008b; Khlif et al., 2010). E.g.
Vanderfeesten et al. (2007a) define coupling in process modeling as the connectedness of elements.
Coupling does not only evaluate the quality of single process models, there is a strong focus on inter- dependencies among models as well. Further, many operationalizations of coupling can be calculated automatically. This is a mandatory prerequisite for the use with process architectures, which frequent- ly encompass a very large number of process models (Malinova et al., 2013). Thus the concept of coupling is very suitable for an application in the context of process architectures.
Ultimately, we aim to provide means which support practitioners in managing the complexity of pro- cess architectures. In the current work we follow this aim by investigating the contribution of “cou- pling” to the evaluation of the ease of understanding of process models as part of a process architec- ture and to the use of process architectures in general. Our focus is on coupling metrics which can be calculated automatically for process architectures. We thus pose the following research questions:
Q1: What is the current state of knowledge on coupling and how is the coupling concept operational- ized using metrics?
Q2: Which perspectives on “coupling” can be distinguished and how do these perspectives help to assess the ease of understanding of process models or process architectures, respectively?
Our analysis requires detailed descriptions of the coupling instantiations. In the literature on coupling in process modeling which we found and which had a precise explanation of coupling, the authors always present metrics measuring coupling in process models. These metrics are usually specified for a specific notation. However, the metrics we found use elements appearing in many common process- modeling languages (cf. Recker et al., 2005; Recker et al., 2009; Braunnagel and Johannsen, 2013;
Braunnagel et al., 2014). The contribution of our paper is as follows: first, the current body of knowledge of coupling is analyzed and different perspectives on coupling are derived, generating a better understanding of the coupling concept and of how it helps to judge the ease of understanding of process models as part of a process architecture. Second, the research uncovers perspectives on cou- pling which have not properly been investigated or operationalized yet (e.g. by means of metrics) but bear promising potential for future research. Third, we introduce a prototypical tool for an automatic calculation of coupling metrics.
Twenty-Third European Conference on Information Systems (ECIS), Münster, Germany, 2015 3 We follow a bottom-up approach. We analyze in detail how the existing work on coupling operational- izes the concept by collecting and comparing actual operationalizations. The criteria comprise the internal view, i.e. the measurement, and the external view, i.e. the indication, on each metric (cf. Purao and Vaishnavi, 2003). Based on the results we interpret and discuss the application of coupling in pro- cess architectures.
The paper unfolds as follows: in section two, basics and related work on enterprise architectures, pro- cess architectures and coupling are presented. Subsequently, the methodology of this research is ex- plained. In section four, current operationalizations of coupling in the form of metrics are analyzed.
Based on that, section five introduces a classification of coupling metrics showing different perspec- tives on the coupling concept. The implementation of a tool for calculating the metrics is highlighted in section six. Then, we derive an interpretation for coupling in the context of process architectures and conclude our paper with a summary and an outlook on future research.
2 Basics and related work
2.1 Enterprise Architecture and Process Architecture
Despite the fact that the term “architecture” is not consistently used in literature (e.g., Schekkermann, 2006; Ross, 2003) most definitions are based on the IEEE standard (IEEE, 2000). According to that standard an architecture is the fundamental organization of any kind of socio-technical system embod- ied in its components and their relationships, as well as construction rules for the generation and the design of the system (IEEE, 2000). The definition comprises two main aspects of an architecture: (1) the specification of the components of the system (e.g. data, processes), abstracting from insignificant aspects, often represented by models of the “as-is” resp. the “to-be” state and (2) construction rules guiding the design and evolution of the system by its components from an “as-is” into a “to-be” state.
Due to the complexity – especially of business systems – the architectures need to facilitate the struc- turing of the business system by describing different architecture levels (e.g. business data, entity types, business processes, functions) or taking different views on these levels (e.g. designers or build- ers view), as is the case e.g. with the Zachman Framework (cf. Zachman, 1987).
Practitioners recently judged the process architecture as one of the most important components of an enterprise architecture (Aier et al., 2008). Normally, they are allocated to a distinct process or organi- zation level and modelled together with organization units, roles, and information objects (Leist and Zellner, 2008). The process itself consists of functions (or tasks) and their relationships. Functions are carried out to develop, produce, and distribute services to customers (Österle, 1995). Due to a variety of potential views on processes (e.g. structure or behavior), different process models are organized within the framework of a process architecture. The framework for a very simple process architecture for instance would define the hierarchical decomposition of a process into sub processes and the archi- tecture would be presented with coarse-granular towards fine-granular process models. In an empirical analysis, Malinova et al. (2013) found two important construction rules for process architectures. First, process models are related through a hierarchical decomposition. Therefore, an activity is explained in more detail in a separate process model. Second, in a service oriented architecture, distinct services are combined into one process. Thus, the detailed descriptions of the services are reused in the resulting process. As both these approaches present different levels of granularity, they are referred to as verti- cal decomposition. (cf. Malinova et al., 2013; Zugal et al., 2013)
Process models as part of an enterprise architecture have an important transfer function because they are used as the documentation upon which to realize requirements of business strategies for operation- al processes. In addition, they illustrate restrictions and potentials of the IT infrastructure for business strategies (cf. Österle, 1995; Frank, 1994). Beyond that, they can be used for many further purposes, as for instance for quality management, during the implementation of standard software, for compliance management, within sourcing decisions, or for process optimization (Aier et al., 2008). Another im-
Twenty-Third European Conference on Information Systems (ECIS), Münster, Germany, 2015 4 portant use of process architectures becomes handy in case of major restructuring efforts, e.g. in case of a company merger. Architectures ease the identification of redundant functionality among the com- panies’ processes or the assignment of responsibilities and tasks. They further serve as a planning ba- sis for the restructuring of processes and not at last to identify the impact of changes in individual pro- cesses on further, dependent, processes. Thus, process architectures support the planning of structural changes in a company. (cf. Aier et al., 2008; Malinova et al., 2013)
The empirical analysis of Malinova et al. (2013) supports the importance of process architectures.
Especially practitioners highlight the improved transparency of processes due to the documentation of architectures as most important and further stress that the process architectures help to plan necessary changes in processes due to mergers. (cf. Aier et al., 2008)
However, these use cases suffer if a process architecture is overly complex. On the one hand, a process documentation is just as good as a model user is able to understand the documentation. A high degree of complexity is known to impair the ease of understanding. Further, dependencies among processes easily become obfuscated under a high number of complicated, possibly hidden, relations among pro- cesses. Coupling metrics are statedly used to control the complexity of conceptual models and to high- light possibly hidden dependencies. Further, their formalization allows an automatized application, which comes handy with the high number of process models that architectures frequently cover. They thus appear to offer potential to be applied to process architectures.
2.2 Coupling and Coupling metrics
Coupling in process management stems from the domain of software engineering. Its current under- standing is based on a transfer of knowledge from software engineering to process modeling as well (cf. Vanderfeesten et al., 2007a; Khlif et al., 2009; Braunnagel and Johannsen, 2013; Braunnagel et al., 2014). For example, Vanderfeesten et al. (2007a) introduce the concept as originating in software engineering: “Coupling is measured by the number of interconnections among modules. Coupling is a measure for the strength of association established by the interconnections from one module of a de- sign to another. The degree of coupling depends on how complicated the connections are and on the type of connections.” Thus, coupling is measurable and the measurement uses modules and intercon- nections as input. Further, the measurement indicates complexity. However, it is not clear what a module and an interconnection exactly constitute in process models and what “complicated” means in this context.
Based on one particular metric, Vanderfeesten et al. (2007b) explain coupling in greater detail. “Cou- pling measures the number of interconnections between the activities in a process model. The degree of coupling depends on how complicated the connections are and also on the type of connections be- tween the activities.” This explanation is precise towards a particular metric. Here, the input of the calculation only constitutes activities in the limited scope of one model. However, e.g. the conceptual coupling metric considers the semantic overlap of different models as coupling, whereas the Coupling Between Objects (CBO) metric counts the control flow connections between different models (cf.
Braunnagel and Johannsen, 2013; Braunnagel et al., 2014; Chidamber and Kemerer, 1994). Generally, metrics provide definitions of coupling that are specific for each case. Thus, these definitions express a specific understanding and cannot serve as a general definition of coupling in process modeling.
The above explanations define coupling as a measure for the number of connections among model elements that indicate the complexity of a process model. The first definition references software en- gineering and thus needs to be interpreted with regard to process modeling. The metrics express spe- cific views on coupling. Thus, the question of what coupling is in process architectures needs further elaboration. The concept of coupling is operationalized by a variety of coupling metrics. Each metric expresses a specific and individual understanding of the concept of coupling. E.g. Cardoso et al.
(2006) transfer the software metrics by McCabe (1976), which quantify the paths through a model into process modeling (cf. Cardoso et al., 2006). Further Vanderfeesten et al. (2007b) present a coupling
Twenty-Third European Conference on Information Systems (ECIS), Münster, Germany, 2015 5 metric called “CP”, which is also influenced by software metrics. The metric “CP” evaluates all pairs of nodes averaging their value over all pairs. Another metric by Vanderfeesten et al. (2008a) is the cross-connectivity metric, which analyses the number of different possible paths in a process model.
Finally, González et al. (2010) present a review of measurement in process management. Regarding measures on process models, they argue that authors wrongly categorize their metrics as coupling or complexity metrics due to the lack of a precise definition.
In summary, the development of coupling stems from the research on software metrics. This develop- ment has resulted in a plethora of metrics for business processes. However, it has also caused confu- sion about the meaning of the terms and their contribution to process architectures has not yet been investigated.
3 Methodology
The first step of our methodology (Figure 1) was a literature review. For the review, the electronic databases Google Scholar, Computer.org, AISeL and Emerald Insight were queried using the term pair
‘”coupling metrics” “business process model”’ and “coupling metrics” (cf. Cooper, 2006; Vom Brocke et al., 2009). The hits, 45 peer-reviewed results, which were considered as relevant on the ba- sis of their title or abstract, consist of 31 conference papers, nine journal papers, four technical reports and one book.
Upon close inspection, we divided the literature in four groups (see Table 1). “Applicable sources”
comprises literature that defines those metrics that are used in the remainder of our analysis. The re- maining works turned out to be inapplicable for the following reasons. The literature group “use cas- es” contains works which discuss use cases for the metrics, but do not present new metrics in compari- son to the first group. E.g. (Binkley and Schach, 1998) discuss relations of coupling and run-time fail- ures. The group “not applicable in the design phase” presents coupling metrics that require infor- mation unavailable in the design phase of process architectures and thus cannot be used for our analy- sis. E.g. (Green et al., 2009) present an approach involving runtime information which is not available in conceptual models. Lastly, we found the literature group which we named “Known metrics”. Here we classified works which discuss or present metrics that are already covered by those in the group
“applicable sources”, but did not provide/deliver new metrics for our analysis. E.g. Khlif et al. (2009) transfer metrics to BPMN. We refer to the original description. A more detailed presentation of trans- ferred and not transferred metrics can be found in Braunnagel and Johannsen (2013).
Applicable sources
(Allen et al., 2001; Cardoso, 2006; Chidamber and Kemerer, 1991; Gui and Scott, 2006; Poshyvanyk and Mar- cus, 2006; Reijers and Vanderfeesten, 2004; Vanderfeesten et al., 2007b; Vanderfeesten et al., 2008a)
Inapplicable sources
Use cases. These works discuss the application of metrics but do not present new metrics.
(Arshad et al., 2007; Beyer et al., 2001; Binkley and Schach, 1998; Chowdhury and Zulkernine, 2010; El- Emam, 2001; González et al., 2010; Harrison et al., 1998; Lee and Chan, 2001; Markovic et al., 2009; Meyers and Binkley, 2007; Vanderfeesten et al., 2007a; Wahler and Küster, 2008)
Not applicable. These metrics cannot be applied on process models in the design phase.
(Allier et al., 2010; Allen et al., 1999; Birkmeier, 2010; Briand et al., 1999; Briand et al., 1997; Cho et al., 1998;
Green et al., 2009; Gui and Scott, 2008; Halstead, 1977; Hitz and Montazeri, 1995; Joshi and Joshi, 2010;
Kazemi et al., 2011; Orme et al., 2006; Perepletchikov et al., 2007; Qian et al., 2006; Quynh and Thang, 2009;
Rajaraman and Lyu, 1992; Sunju and Joongho, 2009)
Known metrics. These works discuss metrics from previous works.
(Chidamber and Kemerer, 1994; Chen et al., 2009; Khlif et al., 2009; Khlif et al., 2010; Rosenberg and Hyatt, 1997; Sandhu and Singh, 2005; Újházi et al., 2010)
Table 1. Grouped literature review results
Twenty-Third European Conference on Information Systems (ECIS), Münster, Germany, 2015 6 Figure 1. Methodology
Our second step (see Figure 1) is the analysis of the interpretations of coupling. We systematically assess the characteristics of the interpretations with the aid of five criteria. Since all of the works on coupling we found describe metrics, we select the criteria according to (Purao and Vaishnavi, 2003).
The criteria are specifically designed to compare quality metrics for conceptual models and distinguish the internal and the external perspective on metrics.
The internal perspective ensures the scientific base of the measurement. This perspective operational- izes the entity-attribute view for metrics of Fenton (1998), which expects a thorough description of those attributes that the calculation of the metric takes into account. Thus, we introduce the categories input and scope. Input describes the elements of the process model that make up the variables of the metric calculation. E.g. a metric may count the number of arcs, or the number of nodes, or only nodes of certain types like functions or events. Scope lists the selection criteria for elements. More precisely, it describes whether a metric considers elements from only one model or several models and what the selection criterion is. E.g. a metric may consider only nodes from the one model in focus, or those arcs that connect different models, or all functions and events from all models that describe the same pro- cess. The external perspective captures the intended use of the metric. This perspective is in accord- ance with the goal-question-metric approach of Basili (1992). Thus, this perspective describes the implication and utilization of the metric. The implication states what a high or low metric value im- plies about the model, while the utilization exemplifies how to utilize this indication.
Finally, a mathematical function maps the perspectives. In essence, a function needs to transform the elements from the internal perspective into a value that reflects the indication stated in the external perspective. Our category “strategy” generally classifies the different approaches. We discuss the meaning and indications of the categories more thoroughly together with the respective metrics in the section “Analysis”.
The third step of our approach (see Figure 1) is the interpretation of the results of the preceding analy- sis. A summary of the analysis is the subject of the classification of the works, which also serves as a source of discussion on the state of and the gaps in the currently available set of metrics and their con- tribution to process architectures. In doing so, we demonstrate for every metric in which way it sup- ports the aims or purposes of the process architecture.
4 Analysis
The following analysis bases on the coupling metrics shown in Table 1. The metrics are analyzed ac- cording to the criteria outlined before. In our analysis, we found that many metrics have the same val- ue regarding the implication criterion, which according to our analysis are either the complexity or the length of the control flow, the process flexibility, functional redundancy or model complexity.
To support the clarity, we use these values to group metrics in the following discussion.
Complexity of the control flow. Table 2 shows the similarity of the metrics Cross Connectivity (CrC) (Vanderfeesten et al., 2008a), Weighted Coupling (WC) (Vanderfeesten et al., 2007b) and Control Flow Complexity (CFC) (Cardoso, 2006) (cf. Braunnagel and Johannsen, 2013; Braunnagel et al., 2014). This similarity is a consequence of the implication the metrics have in common, which is the complexity of the control flow. The complexity of the control flow impairs the understanding of the model. Thus, the metrics are utilized to evaluate the quality of the process model. To assess this com- plexity, the metrics count the states that the control flow of the model can have. The number of states results from the number of branches in a control flow that are active after a connector. After an
“AND”-connector, all succeeding branches are triggered, thus there is only one possible state. An
“XOR”-connector can trigger as many different states as there are outgoing branches. After an “OR”- connector any combination of branches can be triggered, thus there are as many states as there are
Literature review Analysis Interpretation
Twenty-Third European Conference on Information Systems (ECIS), Münster, Germany, 2015 7 combinations of outgoing branches. The authors argue that a high number of states is complex and thus difficult to understand.
These three metrics use this common principle but differ in their calculation. First, the CFC metric counts and adds the states (Cardoso, 2006). Second, the WC metric counts the number of states and divides it by the number of functions and events (Vanderfeesten et al., 2007b). Finally, the CrC metric calculates the states between any two pairs of functions and averages them over all nodes (Vander- feesten et al., 2008a). Consequently, the metrics use either only connectors, connectors and functions, or additionally events as input. However, all three metrics use only elements of the control flow as their input. They are selected exclusively from single, isolated models. Thus, the metrics’ scope is local. Furthermore, the determining step of the metrics, thus their strategy, is to count the elements of the input.
Metric Implication Input Scope Use
WC
Possible number of states due to choices indicating the complexity of control flow
Functions, Events, Connectors
Local Model Evaluation
CrC Functions, Connectors
CFC Connectors
DC
Length of the control flow, indicated by the number of connected models
Functions, Process References
Global Model evaluation IC
TC RFC
CBO Process references
PC Process flexibility, indicated by share in-
formation Information elements, Functions Local Process evaluation CoC Functional redundancy, indicated by seman-
tic overlap All terms Global Process
evaluation CM Model complexity, indicated by the graphs
entropy Nodes and arcs
Global Model evaluation
ICM Local
Table 2. Metrics and their main features
Length of the control flow. As per Table 2, there is also a high similarity of the Direct Coupling (DC), Indirect Coupling (IC) and Total Coupling (TC) metric (cf. Gui and Scott, 2006; Braunnagel and Johannsen, 2013; Braunnagel et al., 2014). These metrics evaluate the process model. However, their implication refers to the length of the control flow, instead of its number of states, as before. The authors argue that an increasing length of the control flow impairs the reading and understanding of the model. To assess the control flow length, these metrics follow the strategy of counting connec- tions. The operationalization is different for each metric.
For the Coupling Between Objects metric (CBO), the number of connections is counted which a mod- el has in common with other process models. As an extension, the Response For a Class (RFC) metric includes the length of the control flow in the connected models by including the number of functions.
(cf. Chidamber and Kemerer, 1994; Braunnagel and Johannsen, 2013; Braunnagel et al., 2014) In ad- dition, the DC metric counts the number of connections in relation to the number of functions of a model. The IC metric extends the DC metric by paths between any two models. The TC metric applies this principle on all models of a process. (cf. Gui and Scott, 2006; Braunnagel and Johannsen, 2013;
Braunnagel et al., 2014)
Since these five metrics only differ in their actual calculation, the input elements are mostly the same.
The CBO metric counts process references, the remaining metrics additionally refer to the number of functions. In any case, the number of elements determines the value of the metric, thus metrics have a
Twenty-Third European Conference on Information Systems (ECIS), Münster, Germany, 2015 8 counting strategy. Since the metrics account for connections to multiple models their scope is global.
Finally, as their implication refers to the model, their utilization is the model evaluation.
Process flexibility. The Process Coupling (PC) metric evaluates a process instead of its models (cf.
Reijers and Vanderfeesten, 2004; Braunnagel and Johannsen, 2013; Braunnagel et al., 2014). More precisely, the metric implicates one aspect of how flexible the execution of a process is. The aspect that is implicated refers to the dependency of functions in a process due to commonly used infor- mation. If a function depends on information that is created in a second function, then the first func- tion cannot be executed before the latter function is finished. Thus, if the second function fails, this affects all those functions that require its information. To calculate the metric, the pairs of dependent functions are counted. The dependent pairs are those pairs that use common information elements. The number of dependent function pairs is then divided by the number of all function pairs indicating the maximum possible number of dependent functions. Thus, the metric uses a counting strategy. The authors define the metric for all functions of a single process. Its scope is local in relation to one single process. The model topology is not a concern of this metric. Consequently, the input of the metric consists of information elements and functions. (cf. Reijers and Vanderfeesten, 2004; Braunnagel and Johannsen, 2013; Braunnagel et al., 2014)
Functional redundancy. The Conceptual Coupling (CoC) metric evaluates processes (cf. Marcus and Poshyvanyk, 2005; Braunnagel and Johannsen, 2013; Braunnagel et al., 2014). More precisely, the metric implicates the pairwise similarity of two processes. The similarity of the processes bases on the process functionality that the metric discovers by decomposing the process into semantic concepts.
These concepts are the result of a latent semantic analysis, which is an analysis technique from infor- mation theory. In consequence, we label the strategy as “information theory”. The latent semantic analysis uses a term-model matrix with a mathematical transformation, called singular-value- decomposition, to create clusters of correlated terms. Thus, the metric groups term-labels that are fre- quently used together to indicate semantic concepts. Their overlap implicates redundant functionality.
(cf. Marcus and Poshyvanyk, 2005; Braunnagel and Johannsen, 2013; Braunnagel et al., 2014) Since the metric uses only textual content, its input are node labels. Further, as the metric compares multiple processes, the metrics’ scope is global. Thus, the model topology is irrelevant for this metric.
Model complexity. Finally, the metrics Coupling of a module (CM) and IntramoduleCoupling of a module (ICM) are utilized to evaluate the process model, again (cf. Allen et al., 2001; Braunnagel and Johannsen, 2013; Braunnagel et al., 2014). These metrics implicate the complexity of the model graph. Therefore, they consider all nodes, irrespective of the node type. Further, the authors use an information theoretic concept, the entropy, to define complexity. The entropy quantifies information content. The authors argue that an exceeding amount of information impairs the understanding of the model. The CM metric applies the entropy calculation to nodes and arcs that connect different process models. Consequently, the metric’s input are nodes and arcs and its scope is global. The ICM metric applies the metric onto nodes and arcs inside a model. Thus, its scope is local. (cf. Allen et al., 2001;
Braunnagel and Johannsen, 2013; Braunnagel et al., 2014)
5 Interpretation and Discussion
5.1 On the application of coupling metrics
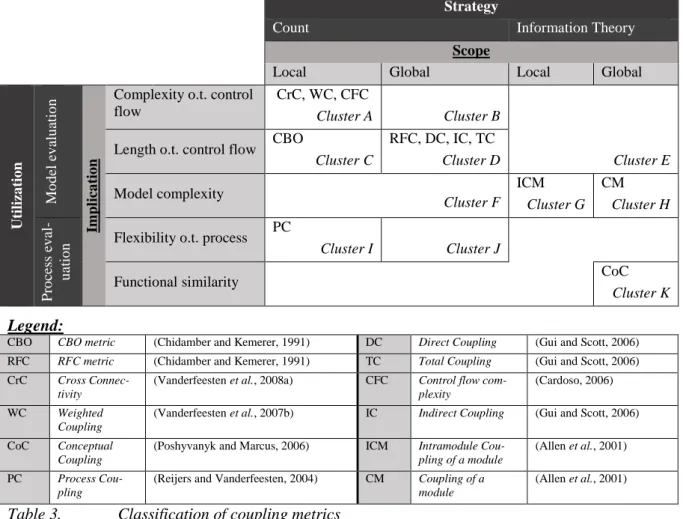
The previous analysis has shown the individual traits of the different interpretations of coupling. The following classification summarizes the analysis and is the first step towards integrating and interpret- ing the various interpretations. In Table 3 the external perspective is displayed on the X-axis and the internal perspective on the Y-axis. This classification supports the identification of common criteria among the metrics. In addition to the clustering of available metrics, the classification reveals research gaps and starting points for future works.
Twenty-Third European Conference on Information Systems (ECIS), Münster, Germany, 2015 9 The first utilization in Table 3 covers the evaluation of process models in an architecture as to their ease of understanding. The metrics support a practitioner in designing the process architecture by indi- cating which models will be hard to understand due to its high complexity. A high value thus indicates that a model’s documentary function is impaired by its design. Looking closer, the metrics cover dif- ferent views on a model’s ease of understanding.
Cluster A: The metrics CrC, WC and CFC assess a model’s complexity depending on is branching structure. They thus indicate whether the level of granularity is chosen well regarding the ease of un- derstanding, or not. As Malinova et al. (2013) explain, the level of granularity is an important issue for practitioners. However, process architectures are used to promote the complete overview of processes, which is not covered by the current metrics. Such metrics would be found in Cluster B.
Strategy
Count Information Theory
Scope
Local Global Local Global
Utilization Model evaluation Implication
Complexity o.t. control flow
CrC, WC, CFC
Cluster A Cluster B
Cluster E Length o.t. control flow CBO
Cluster C
RFC, DC, IC, TC Cluster D Model complexity
Cluster F ICM
Cluster G CM
Cluster H
Process eval- uation Flexibility o.t. process PC
Cluster I Cluster J
Functional similarity CoC
Cluster K
Legend:
CBO CBO metric (Chidamber and Kemerer, 1991) DC Direct Coupling (Gui and Scott, 2006) RFC RFC metric (Chidamber and Kemerer, 1991) TC Total Coupling (Gui and Scott, 2006) CrC Cross Connec-
tivity
(Vanderfeesten et al., 2008a) CFC Control flow com- plexity
(Cardoso, 2006) WC Weighted
Coupling
(Vanderfeesten et al., 2007b) IC Indirect Coupling (Gui and Scott, 2006) CoC Conceptual
Coupling
(Poshyvanyk and Marcus, 2006) ICM Intramodule Cou- pling of a module
(Allen et al., 2001) PC Process Cou-
pling
(Reijers and Vanderfeesten, 2004) CM Coupling of a module
(Allen et al., 2001)
Table 3. Classification of coupling metrics
Cluster C/D: Another perspective on the process model’s ease of understanding is the length of the control flow, which is covered by the metrics CBO, RFC, DC, IC, and TC. These metrics assess the size of the process presentation. They indicate the difficulty in reading the overall process due to the fine-grained granularity. In addition, they calculate the size of a module or the number of interconnec- tions to further processes as well.
Cluster G/H: The metrics previously discussed assess the ease of understanding only on the basis of the number of states or nodes and arcs. A first attempt for a more elaborate assessment can be found with the metrics ICM and CM. They use the information entropy of the models as a complexity meas- ure to indicate how properly the models, either individually (ICM), or as a group (CM), support the documentary function of a process architecture. Another reason to control the complexity of modules is mentioned by Aier and Schönherr (2004). Accordingly, modules need to be constructed in a way that their complexity does not prohibit its handling regarding a company’s flexibility (cf. Aier and
Twenty-Third European Conference on Information Systems (ECIS), Münster, Germany, 2015 10 Schönherr, 2004). In this context it appears feasible to measure the complexity of modules. Further, the field of IS knows more than this one theoretical approach to measure the ease of understanding of conceptual models, which seem promising to offer a more reliable measurement (cf. Houy et al., 2014). Such metrics would be found in Cluster E.
Cluster F indicates further potential research. As of now, the metrics refer only to the control flow to analyze a process architecture’s ease of understanding. However, architectures offer several further views, such as an information or organization view, which should also be accounted for. Such metrics would be found in Cluster F.
The second utilization, namely the process evaluation, covers those metrics that do not evaluate a pro- cess model regarding is ease of understanding, but a process instead. These metrics focus the control and use of the process architecture towards business needs other than process clarification.
Cluster I: The first metric measures the dependency among process functions due to shared infor- mation, which finds its use in the assessment of the flexibility of process architectures. Aier and Schönherr (2006) discuss the issue of a high number of data interfaces that become difficult to man- age. Further, Aier and Schönherr (2004) explain the contribution of modularization to a company’s flexibility. This first metric can indicate dependencies between modules in the process architecture stemming from the information view. Also, the metric can be used to indicate information-intensive processes which would justify a higher priority regarding the analysis for IT support of the processes (Aier et al., 2008). Vanderfeesten et al. (2008b) used the metric to assess the flexibility of individual processes, indicating in how far it is possible to change functions in the process without breaking de- pendencies with functions that occur due to shared information. In the worst case, required infor- mation would not be provided any longer for a certain function. However, the current specification of the metric refers to process models in isolation. A possible extension would apply the metric onto all models of a process or a complete process architecture instead (Cluster J).
Cluster K: The second metric of this group, the CoC metric, attempts to measure the similarity of functions between processes, thus supporting the use of process architectures in several ways. First, the metric allows the identification of similar processes, indicating potential candidates to be merged into a standardized process (cf. Malinova et al., 2013). Further, similar functionality is also an indica- tor for potential modules in an architecture. Thus, processes and parts of processes with a high func- tional similarity are identified by the metric and highlighted as candidates for being integrated to a module. This supports the flexibility of the process architecture (cf. Aier and Schönherr, 2004). Final- ly, Aier et al. (2008) discuss the issue of redundancies among process architectures, e.g. regarding their IT support. In case different systems support similar functionality, the information on potential redundancies would tremendously support the architecture’s development.
However, process models have a wider application. As mentioned in the introduction, models are used among others for process improvement initiatives or system requirements specification. We would thus expect further metrics to be developed that aid indicating issues or effort for the respective use.
The previous analysis addresses our research question Q1, showing the current state of knowledge regarding coupling and its operationalizations, and serves to draw the following summary. We have a set of 12 coupling metrics addressing five different use cases, e.g. evaluating the flexibility of process- es or evaluating the complexity of the control flow in process models. Practitioners may choose to apply a particular metric on the elements of their process architecture if they suspect a particular prob- lem. Alternatively, since the metrics can be computed automatically, they can be applied arbitrarily as well. In that case, a practitioner can analyze the results for outliers which justify special attention re- garding further analysis. Researchers may have particular interest in the gaps that can be seen in Table 3 in order to develop further metrics. In the case of process architectures, metrics with a global scope seem to be highly relevant, as they cannot only be applied on isolated process models but can evaluate their interaction with their environment as well. At last, practitioners and researchers need to cooperate
Twenty-Third European Conference on Information Systems (ECIS), Münster, Germany, 2015 11 to develop further metrics. Practitioners need to identify further relevant use cases for an automated evaluation while researchers need to analyze whether these use cases can be linked to the effects of coupling and measured with respective metrics.
The classification demonstrates that, while the relationship of the indication and the use are distinctive, there are metrics for all combinations of the scope and strategy criteria. Thus, we argue that metrics with the same utilization share more traits. In addition, while we expect further metrics to introduce additional implications, i.e. further dimensions of model quality and process characteristics, we do not expect further utilizations to turn up. For both these reasons, we decided to treat coupling for process model evaluation and coupling for process evaluation separately.
5.2 On the definition of coupling
The current discourse on coupling metrics is based on the definition of coupling as presented by Vanderfeesten et al. (2007a) “Coupling is measured by the number of interconnections among mod- ules. Coupling is a measure for the strength of association established by the interconnections from one module of a design to another. The degree of coupling depends on how complicated the connec- tions are and on the type of connections.”, which we fully agree with. However, as González et al.
(2010) explain, there is currently some confusion in research about the classification of concepts like coupling due to the lack of clarity in the concepts. As a contribution to research, we propose to direct the attention to the important distinction to be made in regard of the utilizations within the group of coupling metrics. The distinction that metrics either evaluate the process architecture regarding its ease of understanding by its individual models on the one hand, or the dependencies among processes on the other hand, shifts the understanding of the concept as well as the interpretation of the definition.
In the first case, the measurement refers to the syntax of process models and their decomposition.
Thus, the measurement neglects the semantic of a process. Interconnections in the sense of Vander- feesten et al. (2007a) are arcs in and between related process models or process model elements. They are connected to indicate a perspective of complexity of the process models and their respective de- composition.
In summary, if coupling is used to evaluate process model quality, it measures the dependency of pro- cess model elements based on the syntax of a process model’s decompositions. Correspondingly, the measurement value indicates the complexity of a process architecture’s models.
In the second case, if metrics are used to evaluate e.g. the flexibility of a process, the measurement refers to the process, i.e. the semantic of a model, oblivious to its decomposition. Interconnections in the sense of Vanderfeesten et al. (2007a) refer to functional dependencies among the processes, e.g.
shared information, as opposed to connections between process models and their elements. They are used to indicate dependencies in the different views of the process architecture.
Regarding Q2, we can summarize that, if coupling is used to evaluate the processes in a process archi- tecture, it measures the dependency of processes, and the measurement value indicates the dependency of processes regarding a particular architectural view.
6 Implementation
The metrics, as described above, need to be applied onto a process architecture in order to be useful.
Since many of the calculations are laborious and architectures naturally contain a high number of models, it is not feasible to calculate these metrics by hand for a complete architecture. We thus creat- ed a tool to support the calculation.
Twenty-Third European Conference on Information Systems (ECIS), Münster, Germany, 2015 12 Figure 2. Implementation procedure (Example for the metric “Process Coupling”)
We opted for implementing the metrics as a Plug-In for the process analysis framework ProM 6. ProM is a framework offering several techniques for process mining and model analysis (cf. van Dongen et al., 2005). Thus, our plugin can use existing means to import process models in different file formats, interact with workflow-enabled systems, and automatize the use.
Since the metrics are fully formalized in formulas as described in (Braunnagel and Johannsen, 2013;
Braunnagel et al., 2014), we were able to implement the calculations without introducing further as- sumptions or adaptions. Figure 2 exemplarily shows the development procedure for the metric “Pro- cess Coupling”. First, the variables of the metric and the corresponding EPML (EPC markup lan- guage) constructs were mapped. EPML is an XML based exchange format for eEPC models and is supported by a wide range of modeling tools (Mendling and Nüttgens, 2006). The calculation of the metrics is performed on the EPML representation of a process model. As the example shows, the <re- lation> construct in the EPML representation indicates a relation between a function and an infor- mation object in a process model (marker “B”). Further, by focusing on the <function> construct, the number of functions of a model can be determined (marker “A”). Based on these findings, an algo- rithm to calculate the process coupling metric was derived in a second step. The code excerpt shows how the number of function pairs in a process model, coupled via a common information object, can be determined. Further, a code snippet to count the total number of functions which is required by the denominator of the metric is shown.
For implementing the metrics, we extended the EPML import Plug-In for ProM. The implementation is written in Java, whereas some of the mathematical functionality refers to the mathematics software R. The Plug-In is available as source code at https://svn.win.tue.nl/trac/prom/browser/Packages/
CouplingMetrics/. By using the ProM framework, a user may work within a familiar process analysis environment, combine the analysis of these metrics with other means of analysis, and benefit from a high degree of automation. Once the models of the process architecture are imported, the end user chooses from the available metrics and is presented with the results without having to take any further interaction.
<epml>
...
<epc EpcId=“1“ Name=“EPC1“>
...
<function id=“4">
<name>Funktion A</name>
</function>
...
<function id=“6">
<name>Funktion A</name>
</function>
...
<dataField id=“7“ defRef=““>
<name>Data 1</name>
...
</dataField>
...
<relation from =“7" to =“4"/>
<relation from =“7" to =“6"/>
...
</epc>
...
</epml>
B A
...
for(String datafield : ar){
if(connections.containsValue(datafield)
&& ((datafield.equals(source_name) ||
datafield.equals(target_name)))){
counter = counter + 1;
...
for(Function function : epc.getFunctions()){
if(function.getEpmlFileEpcId() ==
epc_id){
function_count+= 1; }}
...
Step 1: Mapping between variables and EPML constructs
Step 2: Development of algorithm for metric calculation
Twenty-Third European Conference on Information Systems (ECIS), Münster, Germany, 2015 13 Currently, we are developing an interface with the frequently used ARIS Framework (Scheer, 2000).
Thus, the metrics will be available in the familiar from to analyze process models and architectures in ARIS, which are reports.
7 Summary, limitations and outlook
In our paper, we investigate the contribution of coupling metrics in the context of process architec- tures. To do so, we follow a bottom-up approach and analyze existing coupling metrics derived from a literature review. Each metric is assessed regarding the criteria “input”, “scope”, “strategy”, “implica- tion” and “use”. The majority of metrics found evaluate the complexity of the control flow within a single process model. Regarding the uses of process architectures, these metrics can be used to support the documentary function of the architecture as they measure the ease of understanding of process models. Several other metrics also support the control of the model’s ease of understanding, based on different approaches though. Currently, the theoretical foundations of these metrics are basic. The operationalization of further theories could improve the reliability of the measurement. Considering the pivotal importance of the ease of understanding with regard to the documentary function of the process architecture, additional research is advisable in this regard.
Works that evaluate the process itself exist. These metrics contribute to the individual applications of process architectures. One metric measures the dependency among processes from an information view, while another one accounts for the functional similarity and thus the potential redundancy among processes. Further, metrics of this group could account for process dependencies from the or- ganizational view or due to IT-systems and thus support the assessment of the flexibility of the process architecture.
We discuss what current metrics imply regarding the understanding of coupling in research. We also discuss an important distinction among the current metrics. Metrics refer to either the syntax or the semantic of process models. This distinction shifts the notion of coupling as well as the interpretation of the current definition.
The benefits of this research are twofold. From a scientific perspective, first, the current body of knowledge regarding coupling in process architectures is analyzed and categorized. This helps to bet- ter understand current works and metrics on coupling, since they are compared with common perspec- tives, as shown in Table 3. In addition, their contribution to evaluating process architectures is investi- gated. Second, the results support the development of new metrics. The classification shows perspec- tives which are currently not covered, but which are nonetheless worth investigating to assess depend- encies among processes. E.g. the flexibility of an architecture is subject to organizational dependencies as well, which could be indicated by means of further metrics. Practitioners benefit from this work, first, by metrics indicating a number of different aspects to improve process architectures, and, second by the automatic evaluation of the process architecture, since coupling metrics are formalized.
However, there are some limitations. The completeness of the literature review regarding all works on coupling for process models cannot be guaranteed. Nevertheless, we supplemented the forward search by a corresponding backward search. We only considered our collection of literature sources appropri- ate for the investigation until after both the forward as well as the backward search did not provide any new sources. Also, at the current state, the discussion is purely theoretical. As to support a practitioner in the development and management of process architectures, we need to evaluate our artefact in a practical setting.
In future works, the metrics found will be tested empirically. The influence of the metrics’ value on model complexity, or model readability, respectively, needs to be analyzed. Based on these insights, guidelines for designing process models in terms of coupling may be developed. And last but not least, metrics will be developed covering all those perspectives which are still underrepresented in current research.
Twenty-Third European Conference on Information Systems (ECIS), Münster, Germany, 2015 14
References
Aier, S., Riege, C. and Winter, R. (2008), “Unternehmensarchitektur – Literaturüberblick und Stand der Praxis”, WIRTSCHAFTSINFORMATIK, Vol. 50 No. 4, pp. 292–304.
Aier, S. and Schönherr, M. (2004), “Flexibilisierung von Organisations- und IT-Architekturen durch EAI”, in Aier, S. and Schönherr, M. (Eds.), Enterprise Application Integration: Fleibilisierung komplexer Unternehmensarchitekturen, Gito, Berlin, pp. 1–59.
Aier, S. and Schönherr, M. (2006), “Status quo geschäftsprozessorientierter Architekturintegration”, WIRTSCHAFTSINFORMATIK, Vol. 48 No. 3, pp. 188–197.
Allen, E.B., Khoshgoftaar, T.M. and Chen, Y. (1999), “Measuring coupling and cohesion. An infor- mation-theory approach”, in 6th Int. Software Metrics Symposium, Boca Raton, USA, 04.11, IEEE Comput. Soc. Press, Los Alamitos, USA, pp. 119–127.
Allen, E.B., Khoshgoftaar, T.M. and Chen, Y. (2001), “Measuring Coupling and Cohesion of Soft- ware Modules. An Information-Theory Approach”, in 7th Int. Software Metrics Symposium, Lon- don, UK, 04.04, IEEE Comput. Soc. Press.
Allier, S., Vaucher, S., Dufour, B. and Sahraoui, H. (2010), “Deriving Coupling Metrics from Call Graphs”, in 10th Working Conf. on Source Code Analysis and Manipulation, Timisoara, Rumania, 12.- 13.09, IEEE Comput. Soc. Press, Los Alamitos, USA, pp. 43–52.
Arshad, F., Khanna, G., Laguna, I. and Bagchi, S. (2007), Distributed Diagnosis of Failures in a Three Tier E-Commerce System, ECE Technical Reports, Purdue University.
Barros, O. (2007), “Business Process Architecture and Design”, available at:
http://www.bptrends.com/bpt/wp-content/publicationfiles/05%2D07%2DART%2DBusiness%20 Processes%20and%20Design%2DBarros%2Epdf.
Basili, Victor, R. (1992), Software modeling and measurement: The Goal/Question/Metric paradigm, College Park, MD, USA.
Becker, J., Rosemann, M. and Uthmann, C. von (2000), “Guidelines of Business Process Modeling”, in van der Aalst, W.M., Desel, J. and Oberweis, A. (Eds.), Business Process Management: Models, Techniques, and Empirical Studies, Lecture Notes in Computer Science, Vol. 1806, Springer, Ber- lin, Heidelberg, pp. 241–262.
Beyer, D., Lewerentz, C. and Simon, F. (2001), “Impact of Inheritance on Metrics for Size, Coupling, and Cohesion in Object-Oriented Systems”, in Dumke, R. and Abran, A. (Eds.), Proc. of 10th Int.
Workshop on Software Measurement: New approaches in software measurement, Berlin, 04.10- 06.10, Springer, Berlin, pp. 1–17.
Binkley, A. and Schach, S. (1998), “Validation of the coupling dependency metric as a predictor of run-time failures and maintenance measures”, in Torii, K., Futatsugi, K. and Kemmerer, R.A.
(Eds.), Proceedings of the 1998 Int. Conf. on Software Engineering: Forging New Links, Kyoto, Japan, 19.04-25.04, IEEE Comput. Soc. Press, Los Alamitos, USA, pp. 452–455.
Birkmeier, D. (2010), “On the State of the Art of Coupling and Cohesion Measures for Service- Oriented System Design”, in Santana, M., Luftman, J.N. and Vinze, A.S. (Eds.), 16th Americas Conf. on Information Systems: Sustainable IT Collaboration Around the Globe, Lima, Peru, 12.08- 15.08, AISeL.
Braunnagel, D. and Johannsen, F. (2013), “Coupling Metrics for EPC Models”, in Alt, R. and Franczyk, B. (Eds.), Int. Conf. on Wirtschaftsinformatik, Leipzig, 27.02 - 01.03.2013, AISeL, pp.
1797–1811.
Braunnagel, D., Johannsen, F. and Leist, S. (2014), “Coupling and process modelling”, in Fill, H.-G., Karagiannis, D. and Reimer, U. (Eds.), Proceedings of Modellierung 2014, Wien, Österreich, 19.03 - 21.03, Köllen, Bonn, pp. 121–137.
Briand, L. and Wust, J. (2001), “The impact of design properties on development cost in object- oriented systems”, in 7th Int. Software Metrics Symposium, London, UK, 04.04, IEEE Comput. Soc.
Press, pp. 260–271.
Twenty-Third European Conference on Information Systems (ECIS), Münster, Germany, 2015 15 Briand, L.C., Daly, J. and Wust, J. (1999), “A unified framework for coupling measurement in object-
oriented systems”, IEEE Transactions on Software Engineering, Vol. 25 No. 1, pp. 91–121.
Briand, L.C., Devanbu, P.T. and Melo, W.L. (1997), “An Investigation into Coupling Measures for C++”, in Adrion, R.W., Fuggetta, A., Taylor, R.N. and Wasserman, A.I. (Eds.), Proc. of the 19th Int. Conf. on Software Engineering: Pulling together, Boston, USA, 17.05.1997 - 23.05.1997, ACM Press, pp. 412–432.
Buhl, H.U. and Heinrich, B. (2004), “Unternehmensarchitekturen in der Praxis. Architekturdesign am Reißbrett vs. situationsbedingte Realisierung von Informationssystemen”, WIRTSCHAFTSIN- FORMATIK, Vol. 46 No. 4, p. 311.
Cardoso, J. (2006), “Process control-flow complexity metric: An empirical validation”, in IEEE Inter- national conference on Services Computing, 18. - 22.09, IEEE Comput. Soc. Press, pp. 167–173.
Cardoso, J., Mendling, J., Neumann, G. and Reijers, H.A. (2006), “A Discourse on Complexity of Process Models”, in Eder, J. and Dustdar, S. (Eds.), Business process management workshops:
BPM 2006 International Workshops, BPD, BPI, ENEI, GPWW, DPM, semantics4ws, Wien, Öster- reich, 04.09, Springer, Berlin, pp. 117–128.
Chen, J., Yeap, W.K. and Bruda, S.D. (2009), “A Review of Component Coupling Metrics for Com- ponent-Based Development”, in WRI World Congress on Software Engineering, Xiamen, China, 19.05.2009 - 21.05.2009, IEEE Comput. Soc. Press, Los Alamitos, USA, pp. 65–69.
Chidamber, S.R. and Kemerer, C.F. (1994), “A Metrics Suite for Object Oriented Design”, IEEE Transactions on Software Engineering, Vol. 20 No. 6, pp. 476–493.
Cho, E.S., Kim, C.J., Kim, S.D. and Rhew, S.Y. (1998), “Static and Dynamic Metrics for Effective Object Clustering”, in 5th Asia-Pacific Software Engineering Conf., Taipei, Taiwan, 02.12-04.12, IEEE Comput. Soc. Press, Los Alamitos, USA, pp. 87- 85.
Chowdhury, I. and Zulkernine, M. (2010), “Can complexity, coupling, and cohesion metrics be used as early indicators of vulnerabilities?”, in Shin, S.Y., Ossowski, S., Schumacher, M., Palakal, M.J., Hung, C.-C., Chowdhury, I. and Zulkernine, M. (Eds.), Proc. o. Symposium on Applied Computing, Sierre, Schweiz, 22.-26.03, ACM Press, pp. 1963–1969.
Cooper, H.M. (2006), Synthesizing research: A guide for literature reviews, Applied social research methods series, Vol. 2, 3rd ed., SAGE, Thousand Oaks, USA.
Davis, D. (2013), “3rd Biennial PEX Network Report: State of the Industry. Trends and Success Fac- tors in Business Process Excellence”, available at: http://www.processexcellencenetwork.com/
business-transformation/white-papers/trends-and-success-factors-in-business-process-ex/.
El-Emam, K. (2001), Object-Oriented Metrics: A Review of Theory and Practice, NRC.
Fenton, N.E. and Pfleeger, S.L. (1998), Software metrics: A rigorous and practical approach, 2nd ed., PWS Publ, Boston.
Ferstl, O.K. and Sinz, E.J. (2006), “Modeling of Business Systems Using SOM”, in Bernus, P., Mer- tins, K. and Schmidt, G. (Eds.), Handbook on architectures of information systems, International handbooks on information systems, 2. ed, Springer, Berlin, pp. 347–367.
Frank, U. (1994), Multiperspektivische Unternehmensmodellierung: Theoretischer Hintergrund und Entwurf einer objektorientierten Entwicklungsumgebung, Univ., Habil.-Schr.--Marburg, 1993, Be- richte der Gesellschaft für Mathematik und Datenverarbeitung, Vol. 225, Oldenbourg, München, Wien.
González, L.S., Rubio, F.G., González, F.R. and Velthuis, M.P. (2010), “Measurement in business processes: a systematic review”, Business Process Management Journal, Vol. 16 No. 1, pp. 114–
134.
Green, P., Lane, P.C., Rainer, A. and Scholz, S.B. (2009), An Introduction to Slice-Based Cohesion and Coupling Metrics, Technical Report.
Gruhn, V. and Laue, R. (2006), “Complexity Metrics for Business Process Models”, in Abramowicz, W. and Mayr, H.C. (Eds.), 9th Int. Conf. on Business Information Systems, Klagenfurt, Österreich, 31 Mai - 2 Juni, Ges. für Informatik, Bonn, pp. 1–12.