J. Perinat. Med.
13 (1985) 233 Analysis of neonatal heart rate variability by a microprocessor-based on-line system
V. Kariniemi, L. Rovamo*, M. Pohjavuori*
The Departments of Obstetrics and Gynecology and Children's Hospital, Helsinki University Central Hospital, Helsinki, Finland
1 Introduction
Continuous monitoring of fetal and neonatal heart rate has gained a wide acceptance in the clinical perinatal practice. Signal noise and pre- mature beats can create a considerable bias in the visual evaluation of cardiograms. Quantita- tive statistical methods have been presented for the assessment of the short term and the long term components of neonatal heart rate vari- ability (NHRV) [2, 7, 8]. We recently reported reference values for NHRV after normal labor and after elective cesarean section [7]. We have also shown previously that rejection logic limits have a considerable effect on the values of variability indices, albeit they are necessary in the quantitative analysis of a noisy signal as from an abdominal fetal electrocardiogram [6].
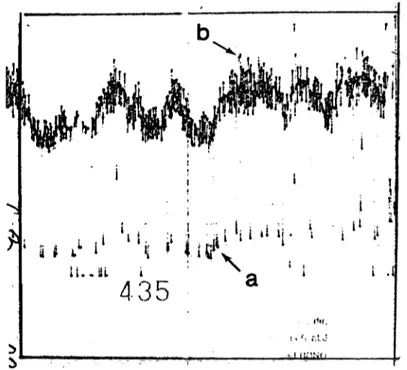
When reproducing the recorded neonatal electrocardiograms from magnetic tapes, we observed that, in addition to the infant's movements and crying, there are two further principal sources of error in neonatal heart rate tracings: the remote shadow trace caused by premature beats (Fig. 1 (a)) arid another shadow trace, close to the actual heart rate, caused by distorted QRS complexes (Fig. 1 (b)).
The aim of the present study was to analyze the effects of different rejection limits on neonatal variability indices.
435
2.1i
Supported by the Foundation of Pediatric Research.
Fig. 1. Neonatal heart rate tracing recorded from an electrocardiogram with two shadow traces: a) a remote trace created by premature beats, and b) a trigger error caused by distorted QRS complexes.
2 Subjects and methods
The series studied consisted of fourteen infants after normal labor and ten infants after ce- sarean section, of which two were born under general anesthesia and eight under epidural blockade. Atropine was used for premedication in general anesthesia, but not in epidural
234 Kariniemi et al., Neonatal heart rate variability
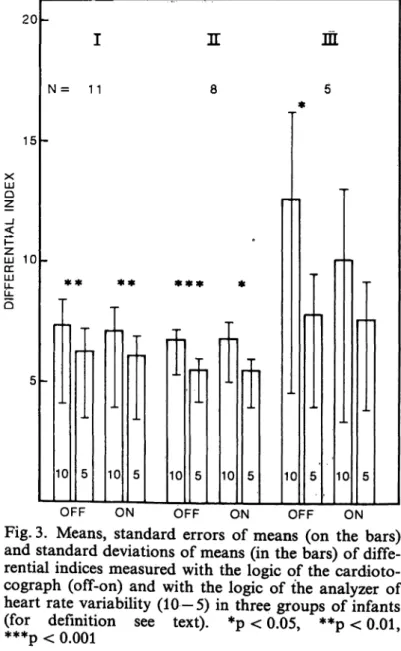
blockade. The mean birth weight was 3651 g (range 2550 — 4780), and the Apgar scores ranged from 7 to 10. Cardiorespirography (Hewlett-Packard 8025 B) was started at an age of 20 to 40 minutes and was continued for 40 to 90 minutes. A neonatal electrocardiogram was recorded with two precordial leads and fed via a cardiorespirograph and an instrument recorder (Hewlett-Packard 3960) onto a magnetic tape. The analyses of NHRV were performed by a previously described system [4] from ten minutes samples of the neonatal electrocardiogram. In this method, the short term component of heart rate variability is expressed as the differential index (DI) and the long term component as the interval index (II) [9]. The analysis is regarded as valid when 30 per cent or more of the interval differences are included in the analysis. The analyses of variability were performed four times on each sample of the electric heart signal: first the raw signal (without the rejection logic of the cardiotocograph) was analyzed using rejection limits of five and ten beats per minute (bpm), and second, the signal handled by the rejection limit of the cardiotocograph (27 bpm) was analyzed using rejection limits of five and ten bpm. The means of the variability indices obtained by these four methods were compared in three groups of subjects: I. Infants with noiseless QRS complexes and without pre- mature beats (N = 11), II. Infants with noise- less QRS complexes and premature beats (N =
8), and III. Infants with distorted QRS com- plexes (N = 5). The differences of means were calculated using Student's paired t-test. In one subject with a double-peaked QRS complex the variability indices were calculated eight times from the same period of the electrocardiogram by using rejection limits of one to ten bpm.
3 Results
The effects of different rejection logic limits on the interval indices of the newborn are shown in Fig. 2. The change of rejection limits had no effect on II when no premature beats were present or when the premature beats were excluded by the cardiotocograph (groups I and
10
xLU Q
Ξ 5GC LU
HI
N = 1 1
10 10 10
i
10 10 10
OFF ON OFF ON OFF ON
Fig. 2. Means, standard errors of means (on the bars) and standard deviations of means (in the bars) of inter- val indices measured with the logic of the cardioto- cograph (off-on) and with the logic of the analyzer of heart rate variability (10 — 5) in three groups of infants (for definition, see text). *p < 0.05
20
15 χLU Q
LU 10
<r LU
t
Q
N= 11
** ** ***
10 10 10 10 10 10
OFF ON OFF O;N OFF ON
Fig. 3. Means, standard errors of means (on the bars) and standard deviations of means (in the bars) of diffe- rential indices measured with the logic of the cardioto- cograph (off-on) and with the logic of the analyzer of heart rate variability (10—5) in three groups of infants (for definition see text). *p < 0.05, **p < 0 01
***p< 0.001 '
II). Premature beats increased the II values calculated using a rejection limit of ten bpm (group II). When distorted QRS complexes were present, II values calculated using a re- jection limit of ten bpm were also higher than those calculated using a rejection limit of five bpm (group III).
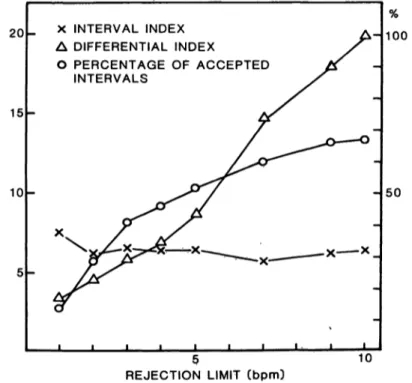
The effects of different rejection limits on DI are shown in Fig. 3. The DI values calculated using a rejection limit of ten bpm were always higher than those calculated using a rejection limit of five bpm. The mean DI was always between five and eight, except when a rejection limit of ten bpm was used in the group with distorted QRS complexes, which created a much higher DI value. The association between variability indices and rejection limits chosen for an infant with abundant double-peaked QRS complexes is shown in Fig. 4. The re- jection limit had no effect on II, but had a strong effect both on DI and on the percentage of accepted intervals. It is worth noting that DI values of less than ten were achieved when the rejection limit was lower than six bpm.
20
15
10
X INTERVAL INDEX Δ DIFFERENTIAL INDEX
Ο PERCENTAGE OF ACCEPTED INTERVALS
100
50
10 REJECTION LIMIT (bpm)
Fig. 4. The association between the rejection limit used in the calculation of the interval and the differential indices of neonatal heart rate and variability indices and the percentage of accepted intervals. The analyses of variability were performed from the same ten minute sample of the electrocardiogram.
4 Discussion
The present study suggests that rejection logic is a useful tool in processing a neonatal electrocardiogram for the analysis of neonatal heart rate variability. Other research groups have eliminated the signal noise either by wait- ing for 512 consecutive heart intervals [8] or by selecting noiseless two-minute windows [2], both of which methods are impractical for routine monitoring of the neonate. In the pre- sent study, the use of rejection logic allows the variability indices to be measured continuously in samples of a chosen time length. As has been shown previously regarding fetal heart rate [3], II is not sensitive for missing intervals due to the rejection logic. DI, on the other hand, is always somewhat lower when stricter rejection limits are used, whether there are premature beats or not. If the QRS complexes are not bipolar, as they are presumed to be in the de- tection logic of the cardiographs [1], a DI value calculated with a rejection limit of ten bpm will be much higher than those measured from bipolar signals. With a rejection limit of five bpm, even these DI values fall within the normal range. We have collected some evidence from fetal studies that the valid information of fetal heart rate variability is in those beat-to- beat differences not exceeding five bpm [5, 10, 11]. Low indices of NHRV have been reported in association with idiopathic respiratory dis- tress syndrome and prematurity [2, 8]. Too wide rejection limits, or abandoning the rejection limits totally, in the quantitative analysis of heart rate variability could produce erroneously high results in case of non-ideal QRS-complex and thus lead to false negative results. There- fore, it might be advisable to use narrow re- jection limits in neonatal studies in order to avoid the trigger error caused by distortion of the QRS complex. The shape of the QRS complexes is dependent on the electrode posi- tion, therefore the incidence of distorted QRS- complexes might be decreased also by a careful search after a bipolar signal. The use of re- jection logic allows also those epochs of neonatal electrocardiogram, which have miss- ing intervals, to be analyzed for NHRV.
236 Kariniemi et al., Neonatal heart rate variability
Premature beats do not seem to create a whether the rejection logic of the cardiograph noteworthy problem in the analysis of neonatal is used or not. The rejection logic of the heart rate variability. Their effect is excluded cardiotocograph is designed solely to make the by rejection limits of both five and ten bpm, heart rate tracings more readable.
Summary
The effects of different rejection logic limits on the results of analysis of neonatal heart rate variability from electrocardiograms by a microprocessor-based system were studied on fourteen infants after normal labor and on ten infants after elective cesarean section. In addition to the infant's movements and crying, two further main sources of error in the calculation of variability indices were detected: premature beats and problems in the shape of QRS complexes in a neonatal elec-
1 x trocardiogram. No noteworthy problem was observed in the calculation of the interval index (II), which de- scribes the long term variability of heart rate. In the calculation of the differential indices (DI), which de- scribe the short term component of heart rate, distorted
QRS complexes created very high DIs when the rejection logic was ten beats per minute (bpm). When stricter rejection limits were used (five bpm), the DI values even in these cases fell within the normal range. The DI values calculated using a rejection limit of five bpm were always lower than those calculated using a rejection limit of ten bpm, but the reference values of neonatal II and DI after normal labor were similar to those presented previously using a rejection limit of ten bpm. In conclusion, the neonatal electrocardiogram appears to be a noisy signal, comparable with the abdominal fetal electrocardiogram, and strict rejection limits are useful in processing it for indices of variability.
Keywords: Electrocardiography, heart rate variability, neonatal heart rate.
Zusammenfassung
Analyse der neonatalen Herzfrequenzvariabilität mit ei- nem mikroprozessorgesteuerten On-line-System
Wir untersuchten den Einfluß unterschiedlicher Un- terdrückungskriterien auf die Ergebnisse der Variabi- litätsanalyse im neonatalen EKG von 15 Kindern nach Spontangeburt und 10 Kindern nach primärer Sektio.
Dabei wurde ein mikroprozessorgesteuertes On-line-Sy- stem benutzt. Zusätzlich zu den Kindsbewegungen und Schreiphasen wurden zwei weitere Fehlerquellen aufge- deckt: vorzeitig einfallende Schläge und Probleme bei der Formanalyse des QRS-Komplexes im neonatalen EKG. Die Berechnung des Intervallindex (II) als Aus- druck der Langzeitvariabilität bereitete keine Schwierig- keiten. Bei der Berechnung des Differentialindex (DI), der die Kurzzeitschwankungen widerspiegelt, führten je-
doch verzerrte QRS-Komplexe zu hohen DFs, wenn als Unterdrückungskriterium 10 Schläge pro Minute (bpm) angesetzt wurden. Bei einem strengeren Unterdrückungs- kriterium (5 bpm) lagen die Werte jedoch innerhalb der normalen Streubreite. Wurden 5 bpm als Unterdrük- kungskriterium angesetzt, lagen die DI-Werte immer nie- driger als bei 10 bpm. Die Referenzwerte von neonatalen IPs und DFs nach Spontangeburt waren jedoch ver- gleichbar mit Werten, die nach Anlegung eines Un- terdrückungskriteriums von 10 bpm berechnet wurden.
Wir meinen, daß das neonatale EKG, ähnlich wie das abdominale fetale EKG, verrauschte Signale liefert und damit strenge Unterdrückungskriterien bei der Berech- nung der Variabilitätsindices angelegt werden sollten.
Schlüsselwörter: Elektrokardiographie, Herzfrequenzvariabilität, neonatale Herzfrequenz.
Resume
Analyse de la variabilite du rythme cardiaque neonatal par un microprocesseur utilisant un Systeme en temps reelOn a etudie, chez 14 enfants nes apres un travail normal et chez 10 enfants nes par cesarienne, les effets des limites des logiques de rejection differentes sur les resultats de Panalyse de la variabilite du rythme cardiaque neonatal ä partir d'electrocardiogrammes a l'aide d'un Systeme
utilisant un microprocesseur. En plus des mouveinents et des cris de l'enfant, deux sources principales d'erreur ont ete detectees dans le calcul des indices de variabilite:
les battements prematures et les problemes de la forme des complexes QRS sur Pelectrocardiogramme neonatal.
On n'a pas observe de probleme notable pour le calcul de l'index d'intervale (II), qui decrit la variabilite ä long terme du rythme cardiaque. Pour le calcul des indices J. Perinat. Med. 13 (1985)
differentiels (ID), qui decrivent la composante a court terme du rythmc cardiaque, des distorsions dans les complexes QRS ont cree des ID tres eleves lorsque la logiquc de rejection etait de dix battcments par minute (BPM). Lorsque des limites de rojection plus strictes ont etc utilisces (cinq BPM), les valeurs de chutent a Hnterieur des resultats normaux meme dans ces cas.
Les valeurs de calculees en utilisant une limite de
rejection de cinq BPM ont toujours ete plus basses que celles calculees en utilisant une limite de rejection de dix BPM. En conclusion, il apparait que 1'electrocardio- gramme neonatal est un signal parasite, comparable ä Fclectrocardiogramme foetal par voie abdominale, et des limites strictes de rejection sont utiles lorsqu'on le traite pour obtenir des indices de variabilite.
Mots-cles: Electrocardiographie, rythme cardiaque neonatal, variabilite du rythme cardiaque.
Bibliography
[1] AHOPELTO, J., K. HUKKINEN, T. E. KATILA, H.
LAINE, V. KARINIEMI: Detection of fetal QRS-com- plexes by external methods. Ann. Chir. Gynaecol.
Fenn. 64(1975) 152
[2] CABAL, L. A., B. SIASSI, B. ZANINI, J. E. HODGMAN, E. H. HON: Factors affecting heart rate variability in preterm infants. Pediatrics 65 (1980) 50
[3] KARINIEMI, V., K. HUKKINEN: Quantification of fetal heart rate variability by magnetocardiography and direct electrocardiography. Am. J. Obstet.
Gynecol. 128 (1977) 526
[4] KARINIEMI, V., T. KATILA, H. LAINE, P. ÄMMÄLÄ:
On-line quantification of fetal heart rate variability.
J. Perinat. Med. 8(1980)213
[5] KARINIEMI, V., P. ÄMMÄLÄ: Short term variability of fetal heart rate during pregnancies with normal and insufficient placental function. Am. J. Obstet.
Gynecol. 139(1981)33
[6] KARINIEMI, V., A. SIIMES, P. ÄMMÄLÄ: Antepartal analysis of fetal heart rate variability by abdominal electrocardiography. J. Perinat. Med. 10 (1982) 114 [7] POHJAVUORI, M., M. FORSS, V. KARINIEMI: Perinatal heart rate variability and circulatory adaptation of the newborn after normal labor and elective ce-
sarean section. Am. J. Obstet. Gynecol. 147 (1983) [8] TARLO, P. A., I. VÄLIMÄKI, P. M. RAUTAHARJU:943 Quantitative computer analysis of cardiac and res- piratory activity in newborn infants. J. Appl.
Physiol. 31 (1971) 70
[9] YEH, S-Y., A. FORSYTHE, E. H. HON: Quantification of fetal heart beat-to-beat interval differences.
Obstet. Gynecol. 41 (1973) 355
[10] ÄMMÄLÄ, P., V. KARINIEMI: Short term variability of fetal heart rate in cholestasis pregnancy. Am.
J. Obstet. Gynecol. 141 (1981) 217
[11] ÄMMÄLÄ, P., V. KARINIEMI: Short term variability of fetal heart rate during insulin-dependent diabetic pregnancies. J. Perinat. Med. 11 (1983) 97
Received May 14, 1984. Revised September 13, 1984.
Accepted December 10, 1984.
V. Kariniemi, M. D.
Departments of Obstetrics and Gynecology Helsinki University Central Hospital Haartmanink. 2, 00290 Helsinki Finland