See discussions, stats, and author profiles for this publication at: https://www.researchgate.net/publication/277361487
The Relationship Between Social and Emotional Integration and Reading Ability in Students With and Without Special Educational Needs in Inclusive Classes
Article in Journal of Cognitive Education and Psychology · May 2015
DOI: 10.1891/1945-8959.14.2.180
CITATIONS
10
READS
659 5 authors, including:
Some of the authors of this publication are also working on these related projects:
IMAS II: Improving Assistance in Inclusive Educational Settings IIView project
HeLi-DView project Susanne Schwab University of Vienna
169PUBLICATIONS 1,074CITATIONS SEE PROFILE
Marco Hessels University of Geneva 70PUBLICATIONS 782CITATIONS
SEE PROFILE
Markus Gebhardt Universität Regensburg 129PUBLICATIONS 981CITATIONS
SEE PROFILE
Mathias Krammer
Pädagogische Hochschule Steiermark 20PUBLICATIONS 203CITATIONS
SEE PROFILE
All content following this page was uploaded by Markus Gebhardt on 20 March 2018.
The user has requested enhancement of the downloaded file.
1 The relationship between social and emotional integration and reading ability in students with and without special educational needs in inclusive classes
Susanne Schwab University of Bielefeld Universitätsstraße 25, Q1-108 33615 Bielefeld
Germany
E-Mail: Susanne.Schwab@uni-bielefeld.de Marco G.P. Hessels, PhD.
University of Geneva
Faculty of Psychology and Educational Sciences Department of Special Education
Boulevard du Pont d’Arve 40 CH-1205 Geneva
Switzerland
Markus Gebhardt, PhD.
Technical University of Munich School of Education
Arcisstrasse 21 80333 München Germany
Mathias Krammer, M.A.
University of Graz Department of Education Special Education Unit Merangasse 70/II, A-8010 Graz Austria
Barbara Gasteiger-Klicpera, PhD.
University of Graz Department of Education Special Education Unit Merangasse 70/II, A-8010 Graz Austria
Preprint – version. For the original version see:
Schwab, S., Hessels, M. G. P., Gebhardt, M., Krammer, M., & Gasteiger-Klicpera, B.
(2015). The relationship between social and emotional integration and reading ability in students with and without special educational needs in inclusive classes. Journal of Cognitive Education and Psychology, 14(2), 180-198.
2 Abstract
The present longitudinal study focuses on the development of reading abilities and its relationship with social and emotional integration in students with and without special educational needs (SEN). The first measurements (T1) took place at the end of 5th Grade; the second series (T2) were one year later. Participants were 18 students with SEN, 18 students without SEN matched on intelligence with the SEN group and 18 students without SEN with average IQs, all from integration classes in regular secondary education in Austria. The students with SEN consistently showed the lowest reading abilities in reading fluency of words and non- words, sentence comprehension and text comprehension, followed by the low-IQ students. The average-IQ students always showed the highest reading abilities. Students with SEN reported to be less socially integrated than low-IQ students without SEN. Average-IQ students show the highest social integration. However, students with SEN showed a similar level of emotional integration as their peers. Regression analyses showed, as expected, that T1 measures of reading fluency of words and non-words, as well as sentence comprehension and text comprehension all predicted T2 measures of these variables. Intelligence was an additional predictor for word reading fluency in the average IQ group only. Social and emotional integration appeared to be additional predictors for text comprehension at T2 for students with SEN, but not for the other groups. The results of this study suggest that students will more learn when they feel socially and emotionally integrated.
Keywords: students with special needs; inclusion; reading abilities; social integration;
emotional integration
Running head: The influence of social and emotional integration on reading ability
3 Clearly, the UN-Convention on the Rights of Persons with Disabilities has instigated a strong international trend towards inclusive schooling (Bürli, 2009; Meijer, Soriano & Watkins 2003).
However, still little is known about student learning in inclusive classes in Austria. Therefore, the current study focuses on the development of reading abilities, and especially its relationship with social and emotional integration as indicators of true inclusion, in students with and without special educational needs (SEN) in inclusive classes in one of the federal states of Austria (Styria).
In contrast to other countries (see, e.g., Avramidis & Norwich, 2002; Reynolds & Fletcher- Janzen, 2000), in German-speaking areas, inclusion is understood as an improved form of integration in which all children are regarded as individuals with different initial positions, abilities and needs (Sander, 2005). All students should be provided with the best possible chances for learning and development.
In some German-speaking countries, for example in Austria, inclusion does not depend on the kind of severity of disability of the students but mainly on the school organization. In some federal states (Austria consists of 10 federal states that have a large autonomy regarding education) almost all students learn in inclusive classes, also those with severe intellectual and multiple disabilities, whereas in other federal states a substantial proportion of students with disabilities learn in special classes. The overall integration rate in Austria is about 51.2 % and is still rising, but there are large differences between the federal states (e.g., Buchner, Feyerer
& Flieger, 2009; Feyerer, 2009; Schwab, Gebhardt & Gasteiger-Klicpera, 2013). Since the state Styria follows a one track approach (Feyerer, 2009), about 80% of Styrian pupils with special education needs (SEN) are integrated in mainstream schooling (Buchner & Gebhardt, 2011).
Most of the students with SEN in integrative settings in Austria are diagnosed as having learning disabilities regarding one or more subjects (e.g., German or Mathematics). This type of disability is similar to the ICF (International Classification of Functioning, Disability and Health, WHO, 2001) category B, students with Learning Difficulties (WHO, 1993). These
4 students are mostly assigned a general special education curriculum (an adapted curriculum taught in the integrated classroom). Teachers are only provided with information about the proposed curriculum, and they neither receive further information about specific abilities of the students nor about the student’s intelligence (Gebhardt, Schwab, Schaupp, Rossmann, &
Gasteiger-Klicpera, 2012). It must be noted that although IQ is not a criterion for diagnosing a learning disability, in practice, most of these students have a below average IQ.
The significance of inclusion not only consists of placing all students within the same class, but also enriching social participation of persons with and without disabilities (Rossmann, Gasteiger-Klicpera, Gebhardt, Roloff, & Weindl, 2011; Haeberlin, Bless, Moser, & Klaghofer, 1999; Eberwein, 1999; Huber, 2006; Avramidis, 2010). A review of the literature by Bossaert, Colpin, Pijl and Petry (2011) illustrated the relationship between social participation, social integration and social inclusion. Some authors use these terms as synonyms, because they are often overlapping (see also Koster, Nakken, Pijl & Van Houten, 2009). In this study we use the terms social and emotional integration, because the constructs are named that way in the instrument we use.
Social integration leads to a more positive common social life in the entire class. However, research consistently shows that pupils with SEN feel less socially integrated and more often segregated than their peers. Students with SEN report to have fewer friends and more often feel disapproved by their classmates in integration classes (Frostad & Pijl, 2007; Huber, 2008;
Koster,Pijl, Nakken, & Van Houten, 2010; Pijl, Frostad, & Flem, 2008; Pijl & Frostad, 2010;
Ruijs & Peetsma, 2009). They also report more loneliness than children without SEN (Pijl, Skaalvik & Skaalvik, 2010). Although quite a few studies deal with social participation, it remains unclear which variables influence the development of social participation in children with and without SEN. For social behaviour it seems to be clear that positive social behaviour by the student increases social participation and that negative social behaviour lessens it (Newcomb, Bukowski, & Pattee, 1993; Rubin, Bukowski, & Parker, 1998; Gürtler, 2005; Hobi-
5 Ragaz, 2008; Huber, 2006; Schwab et al., in press). In a large sample (N=6564), Rost and Czeschlik (1994) found that intelligence was positively related to popularity and negatively related to rejection (see also the meta-analysis by Newcomb, Bukowski and Pattee, 1993).
Prosocial behavior is seen as the most powerful individual predictor of peer acceptance. Even though the conceptualization and measurement of social competence, independently from the cognitive abilities and the emotional competence of the children seems questionable (see, e.g., Bierman, 2004), the significance of social competence and cognitive abilities of children appears evident.
Although empirical research regarding the impact of integration on social participation seems to show mixed results, the positive influence of inclusive education on achievement of students with and without SEN has been confirmed in several studies (e.g., Baker, Wang, &
Walberg, 1995; Carlberg & Kavele, 1980; Haeberlin et al., 1999; Kalambouka, et al., 2007;
Merz, 1982; Myklebust, 2002, 2006; 2007; Ruijs & Peetsma, 2009; Tent et al., 1991; Wang &
Baker, 1986; Wocken, 2007). For instance, students with SEN in integrative settings showed higher reading abilities compared to students in special education classes (Dessemontet, Bless
& Morin, 2012; Manset & Semmel 1997; Schiller, Sandford & Blackorby, 2008; Waldron &
McLeskey, 1998). Integration also does not seem to have a negative influence on average developing students in inclusive schools compared to average students in mainstream classes in which no students with SEN are integrated (e.g., Dessemontet & Bless, 2013; Gandhi, 2007;
Kalambouka, Farrell, Dyson & Kaplan, 2007). Finally, a longitudinal study in Switzerland, spanning the period from primary education until young adulthood (Eckhart, Haeberlin, Sahli Lozano, & Blanc, 2011; Haeberlin, Blanc, Eckhardt, & Sahli-Lozano, 2012), showed that students from integration classes achieved higher levels of post-obligatory education (after the age of 15) than their counterparts from special classes. The latter group also changed and abandoned education more often. With regard to social aspects, it was shown that students from integration classes had a much better developed social network in adulthood. More importantly,
6 although these students had a lesser self-image during their years in primary education than students in special education classes, the inverse was true when the students reached adulthood.
Students from integration classes then showed a much better self-image and greater self- efficacy. The authors concluded that the inclusion of students with learning difficulties had a positive impact on their future personal, social and professional success (Eckhardt et al., 2011;
Haeberlin et al., 2012).
Students with SEN are particularly at risk of poor reading skills, especially in reading comprehension. About 10% of the students in German-speaking countries show a lack of reading competencies at the end of primary school (Hornberg, Valtin, Potthoff, Schwippert &
Schulz-Zander, 2007). Currently, 16% of nine- and ten-year-old Austrian students are at-risk in reading literacy (e.g. Suchán, Wallner-Paschon, Stöttinger & Bergmüller, 2007) and this percentage increases towards the end of compulsory education, with about 28% of the 15-year- old students failing to meet the international standards concerning reading competence (OECD, 2010; Gasteiger-Klicpera, Oswald, Schwab & Ederer, 2011; Schwantner & Schreiner, 2010).
Despite the fact that we know a great deal about reading skills and its development, there are no studies available that measure the development of reading skills of students with SEN in inclusive secondary education in Austria. Students with SEN were frequently excluded from studies or were assessed using other (incomparable) exercises, as was the case for the Programme for International Student Assessment (PISA; OECD, 2010), the Progress in International Reading Literacy Study (PIRLS; Mullis, Martin, Foy & Drucker 2012) and the German Internationale Grundschul-Lese-Untersuchung (IGLU; Bos, Tarelli, Bremerich-Vos &
Schwippert, 2012). In comparison, in the USA, several longitudinal studies exist that evaluate the performance development of students with and without SEN, such as the Special Education Elementary Longitudinal Study (SEELS; Schiller et al., 2008), the Pre-Elementary Educational Longitudinal Study (PEELS; Carlson et al, 2009) and the National Longitudinal Transition Study 2 (NLTS2; Wagner et al., 2003). According to the NLTS2 results (Wagner et al., 2003),
7 the students with SEN, on average, are 3.6 years behind their typically developing classmates.
The mean discrepancy in years between tested and actual Grade level is -3.4 for students with disabilities. Moreover, the discrepancy between students with and without SEN increases toward higher rades. The studies from German-speaking areas that did include students with SEN showed substantial achievement gaps in relation to typically developing students, indicating a performance difference of at least two years (Haeberlin, 1990; Tent et al., 1991;
Wocken, 2000, 2005).
Theoretically, basic reading skills should already have been developed by the end of primary education. However, empirical studies show that reading skills continue to grow during secondary education (Lenhard & Schneider, 2006). As well as SEN, many other risk-factors play a role in the development of reading skills, such as the socio-economic background of the particular child’s family and the related familial structure and features such as migration background (Baumert, Stanat & Waterman, 2006; Baumert, 2011). In OECD countries, socio- economic background and academic performance are closely related, especially in Germany and Austria (Gasteiger-Klicpera et al., 2011).
As mentioned earlier, empirical studies have illustrated the relationship between inclusion and reading abilities, students with SEN in special school showing lower abilities. This could be related to the fact that teacher expectations regarding students’ academic achievement are generally lower in special classes and that a “watered down” curriculum (Bradley, 1983, p.88) is presented (see also, Campbell & Carlson, 1995; Ellis, 1993; Katims, 2000; Martini-Willemin, 2008). Furthermore, it could be argued that better emotional and social integration would support reading development, but little is known about this relationship. Research has shown that popularity can predict school achievement (Bagwell, Newcomb & Bukowski, 1998) and that students (aged 10 and 13) with a higher emotional, social and school well-being show better concurrent and later academic achievement (Gutman & Vorhaus, 2012). Gutman and Feinstein (2008) further found that positive peer relationships fostered school achievement. Finally,
8 Berger, Alcalay, Torretti and Milicic (2011) showed that for girls a significant correlation existed between social integration and academic achievement.
Aims of the study
In Austria’s national context it appears essential to acquire more empirical knowledge about reading achievement and its development of students with SEN in inclusive classrooms.
Furthermore, as little research exists about the relationship between reading achievement and emotional and social integration, these relationships were also investigated in this study. The two main research questions of this study thus are:
1) What is the level of reading skills of 5th Grade students with SEN and how do these develop during one school year? How do these skills develop compared to those of students without SEN with either low or average IQ?
2) Does emotional and social integration contribute to the development of reading skills?
Method
Procedure
The analyses for this study are based on data from the study “Schulische Integration im Längsschnitt – KompetenzEntwicklung bei SchülerInnen mit und ohne SPF in der Sekundarstufe I – SILKE” (Academic integration in a longitudinal study – development of competencies of students with and without SEN in secondary schools; see also Gebhardt, Schwab, Krammer & Gasteiger-Klicpera, 2012; Gebhardt, Schaupp, Schwab, Rossmann, &
Gasteiger-Klicpera, 2012; Schwab et al., in press). Data regarding academic performance and social integration were collected in two waves among students from eight integration classes (and one special class which will not be considered here) in a large city in Austria. The students completed tests and questionnaires at the end of 5th Grade (June 2011 – T1) and at the end of
9 6th Grade (June 2012 – T2). All assessments took place during the first two hours of two consecutive school days. Depending on the class, the assessments took 70-100 minutes per day.
Members from the research team supported students with SEN during the assessment to ensure that they correctly understood the instructions. In addition, the regular teacher and a special needs teacher of each class completed a questionnaire about every student taking part in the study.
Sample
In the total sample, 179 students (116 boys, 63 girls) participated at T1 and 177 students (110 boys, 67 girls) participated at T2. The sample included Informed consent was obtained from all parents whose child(ren) participated in the study and the research was approved by the Styrian Regional School Authority. Since the analyses focused on the development of reading competencies on the one hand and the relationship with social and emotional participation on the other, only students who completed the assessments at both T1 and T2 were included in the final sample. Furthermore, as we wanted to compare students with and without SEN, we first of all created two matched subgroups. The first group (subsequently indicated by SEN) consisted of 18 students with special educational needs (14 boys, 4 girls) with a mean IQ of 79.0 (SD=7.9; range 64-90). These were all the students with SEN that were included in the total sample and for whom all the various measures were available. The second group (indicated by L-IQ) consisted of 18 students (13 boys, 5 girls) who were individually matched on IQ with the first group (mean IQ = 79.4, SD = 7.8, range 64-90), but who were not diagnosed as having SEN. We then added a random sample of students with IQs in the average range (90-110). This third group (indicated by A-IQ) consisted of 18 students (13 boys, 5 girls) with a mean IQ of 99.6 (SD = 6.1, range 90-109). Both the SEN and L-IQ students were about one year older than the A-IQ students. Mean ages were 11.8 years (SD=0.8), 11.8 (SD=1.0) and 10.7 years (SD=0.5) for the SEN, L-IQ and A-IQ group, respectively (F2,51=12.630, p ≤ .001). The
10 migration background of the students (Austrian students versus students from immigrant families) was more or less equally distributed across the three groups (χ2 = 2.383, df=2, n.s.), thus avoiding migration background as a possible confounding factor.
Measures
Reading fluency of words and non-words were measured with two individually administered subtests from the Salzburger reading and spelling test (SLRT II: Moll & Landerl, 2010). Moll and Landerl (2010) report parallel test reliabilities of .90 and .98, for reading fluency of words and non-words, respectively. In these subtests, the student has to read as many (non-)words as possible within one minute. The number of correctly read words constitutes the total score. The theoretical maximum score is 156 for both subtests.
Reading comprehension was estimated using the subtests sentence comprehension and text comprehension from the German reading comprehension test for 1st to 6th Graders (Elfe 1-6:
Lenhard & Schneider, 2006). For these subscales Lenhard and Schneider (2006) reported internal consistencies of .93 and .92. The maximum scores are 28 and 20 (1 point per item) for sentence comprehension and text comprehension, respectively.
General cognitive abilities (IQ) were estimated at T1 with the Culture Fair Intelligence Test CFT20-R (Weiß, 2008). This language-free intelligence test was chosen so as to not disadvantage students with a migration background and/or poor German language proficiency (Stability coefficient: rtt = 0.80).
The students further filled out the FDI 4-6 (Fragebogen zur Erfassung von Dimensionen der Integration von Schülern; Haeberlin, Moser, Bless, & Klaghofer, 1989) which measures the degree of social integration (e.g., “I am very happy with my classmates”) and emotional integration (e.g., “I like going to school”). The reliability of the scales was shown in a Swiss survey of students from 5th and 6th Grade (α = 0.89 and α = 0.93, for social integration and
11 emotional integration, respectively). Both scales (15 items each) have a minimum score of 0 and a maximum of 60 and were used at T1 only
Results
Descriptive statistics and repeated measures analyses of variance
The means and standard deviations of the three groups (SEN, L-IQ, and A-IQ) on all reading variables, as well as social and emotional integration are presented in Table 1.
The mean scores for social integration vary from 32.6 in the SEN group to 44.5 in the A- IQ group. Analysis of variance shows a significant group effect (F2,51 = 7.743, p ≤ .001, 𝜂𝜂𝑝𝑝2 = .23). Post-hoc tests (Bonferroni) show that the scores of students with SEN are significantly lower than those of the low IQ students (p ≤ .05) and the group of average students (p ≤ .001).
The latter two groups are not significantly different. With regard to emotional integration, the means vary from 22.6 in the A-IQ group to 30.5 in the L-IQ group. The SEN group has a mean score relatively close to that of the L-IQ group (28.6). The differences between the groups are not significant (F2,53 = 1.339, n.s.; 𝜂𝜂𝑝𝑝2 = .05), mainly due to the large intra-group variation.
Consistent with previous research, the results on the reading measures, both on T1 and T2 show that students with SEN consistently have the lowest scores (at T1 these correspond to the 21st and 20th percentile for word reading fluency and non-word reading fluency and to the 8th and 9th percentile for sentence and text comprehension, respectively), followed by the L- IQ students. The A-IQ students always show the highest mean scores. For reading fluency, a multivariate repeated measures analysis of variance shows significant effects for time (higher scores at second assessment, p < .001), measure (higher scores for words than for non-words, p < .001), a significant group effect (SEN students score significantly lower than the two other groups, p < .01), as well as significant two way interaction effects (time x group, p < .01;
measure x group, p < .05; measure x time, p < .001). The three way interaction effect (time x
12 measure x group) is not significant. To further investigate the effects, univariate repeated measures analyses of variance were executed. For reading fluency of words, the analysis shows a significant time effect (Wilks’ λ = .39, F1,51 = 78.358, p < .001, 𝜂𝜂𝑝𝑝2 = .61, power = 1.00), a significant group effect (F1,51 = 5.685, p < .01, 𝜂𝜂𝑝𝑝2 = .18, power = .84) and a significant time x group interaction effect (Wilks’ λ = .86, F2,51 = 4.010, p < .05, 𝜂𝜂𝑝𝑝2 = .14, power = .69). Post-hoc tests (Bonferroni) reveal that the SEN group has a significantly lower mean score than both the L-IQ group (p < .05) and the A-IQ group (p < .01). The L-IQ and A-IQ groups are not significantly different. It must also be noted that the mean score of the L-IQ group approaches that of the A-IQ group at the end of 6th Grade, hence the interaction effect, and that the mean score in word reading fluency of the SEN group increases at a similar rate as that of the A-IQ group.
13 Table 1. Mean raw scores and standard deviations for students with SEN (SEN), low IQ (L- IQ) and average IQ (A-IQ) for all variables at T1 and T2.
SEN (N=18) L-IQ (N=18) A-IQ (N=18)
M SD M SD M SD
T1
Social integration Emotional integration Reading fluency Words
Non-words Comprehension Sentence Text
T2
Reading fluency Words
Non-words Comprehension Sentence Text
32.6 28.6
57.7 38.3
10.9 7.6
66.3 40.8
13.5 8.5
8.0 14.9
19.3 12.9
4.1 3.7
20.7 11.7
5.1 5.2
40.9 30.5
73.5 47.3
13.7 11.0
87.2 55.2
16.6 13.7
12.2 16.6
21.5 13.4
5.4 4.5
20.2 14.4
5.0 5.0
44.5 22.6
81.6 52.9
16.7 13.5
87.9 56.4
18.6 15.7
6.9 13.7
24.7 16.7
4.2 3.3
24.0 15.0
3.0 4.3
For reading fluency of non-words, a significant time effect (Wilks’ λ = .61, F1,51 = 32.852, p < .001, 𝜂𝜂𝑝𝑝2 = .39, power = 1.00), a significant group effect (F1,51 = 5.940, p < .01, 𝜂𝜂𝑝𝑝2 = .19, power = .86) and a significant interaction effect (Wilks’ λ = .86, F2,51 = 4.198, p < .05, 𝜂𝜂𝑝𝑝2 = .14,
14 power = .71) are found. Here, too, post-hoc tests (Bonferroni) reveal that the SEN group has significantly lower scores than both the L-IQ group (p < .05) and the A-IQ group (p < .01) and that the L-IQ and A-IQ groups are not significantly different. Again, the mean score of the L- IQ group approaches that of the A-IQ group at the end of 6th Grade. The mean score in non- word reading fluency of the SEN group increases almost at a similar rate as that of the A-IQ group.
With regard to reading comprehension, the multivariate repeated measures analysis of variance shows significant effects for time (higher scores at second assessment, p < .001), measure (higher scores for words than for non-words, p < .001) and a significant group effect (here, too, SEN students score significantly lower than the two other groups, p < .001).
However, there are no significant interaction effects. To further investigate the effects, univariate repeated measures analyses of variance were executed. With regard to sentence comprehension, a significant time effect (Wilks’ λ = .62, F1,51 = 31.413, p < .001, 𝜂𝜂𝑝𝑝2 = .38, power = 1.00), a significant group effect (F1,51 = 7.401, p < .01, 𝜂𝜂𝑝𝑝2 = .23, power = .93), but no significant interaction effect (Wilks’ λ = .98, F2,51 = 0.460, n.s., 𝜂𝜂𝑝𝑝2 = .02, power = .12) is found.
Post-hoc tests (Bonferroni) indicate that the SEN group has a significantly lower mean score than the A-IQ group (p < .001). The other differences are not significant. All groups increase at a similar rate from T1 to T2.
Finally, regarding text comprehension, a significant time effect (Wilks’ λ = .73, F1,51 = 18.460, p < .001, 𝜂𝜂𝑝𝑝2 = .27, power = .99) and a significant group effect (F1,51 = 12.150, p < .01, 𝜂𝜂𝑝𝑝2 = .32, power = .99) are found. The SEN group seems to show somewhat less progress than the two other groups, but no significant interaction effect is found (Wilks’ λ = .95, F2,51 = 1.301, n.s., 𝜂𝜂𝑝𝑝2 = .05, power = .27). The post-hoc comparisons (Bonferroni) specify that the SEN group has a significantly lower mean score than the L-IQ group (p < .01) and the A-IQ group (p <
.001). The other two groups are not significantly different.
15 Correlations
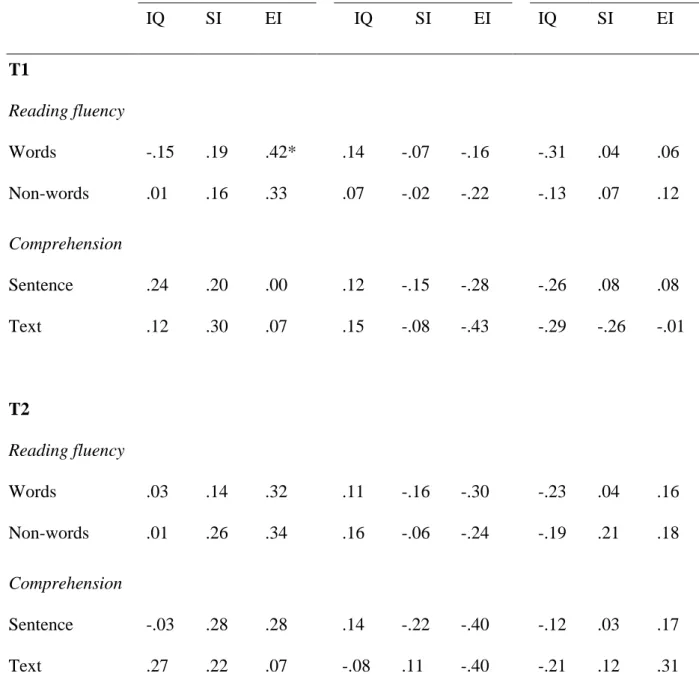
The correlations among the four reading tasks are generally moderate to high (both at T1 and T2, as well as between T1 and T2) and are comparable across the groups. The correlations between the reading measures on the one hand, and social integration, emotional integration and intelligence, on the other, are presented in Table 2. These are calculated for each of the groups separately.
16 Table 2. Correlations between reading measures, social and emotional integration and intelligence in the three groups
SEN (N=18) L-IQ (N=18) A-IQ (N=18)
IQ SI EI IQ SI EI IQ SI EI
T1
Reading fluency Words
Non-words Comprehension Sentence Text
T2
Reading fluency Words
Non-words Comprehension Sentence Text
-.15 .01
.24 .12
.03 .01
-.03 .27
.19 .16
.20 .30
.14 .26
.28 .22
.42*
.33
.00 .07
.32 .34
.28 .07
.14 .07
.12 .15
.11 .16
.14 -.08
-.07 -.02
-.15 -.08
-.16 -.06
-.22 .11
-.16 -.22
-.28 -.43
-.30 -.24
-.40 -.40
-.31 -.13
-.26 -.29
-.23 -.19
-.12 -.21
.04 .07
.08 -.26
.04 .21
.03 .12
.06 .12
.08 -.01
.16 .18
.17 .31 SI=Social integration, EI=Emotional Integration
* p ≤ .05, one-tailed
Table 2 shows that most of the correlations are low to moderate and, due to the small N, only one is significant (one-tailed, since only positive correlations are expected). We will not discuss the individual correlations (as they are relatively low and non-significant), nevertheless, the
17 patterns of the correlations are interesting. First of all, intelligence generally shows low positive correlations with the reading measures at both measurement points, but only in the A-IQ group (except word reading fluency) and L-IQ (except text comprehension) groups. In the SEN group, the correlations are all low and negative. Secondly, in the A-IQ group, social and emotional integration show low to moderate positive correlations with the reading measures (significant for emotional integration with word reading fluency). However, these correlations are negative in the L-IQ group. These are very low with social integration, and low to moderate for emotional integration. The highest correlations for emotional integration are found with text comprehension at T1 and with sentence and text comprehension at T2 (they are not marked as significant, as they are in the opposite direction of what was expected). In the SEN group, on the other hand, the correlations with social and emotional integration are generally positive (except text comprehension with social and emotional integration at T1), though very low.
Prediction of performance gains
Although the patterns of correlations are informative about relationship that may exist at T1 and T2, they do not inform us about the possible relationships between performance gains on the one hand, and intelligence, migration background as an important context variable and social and emotional integration on the other. To investigate whether the latter variables could predict performance gains in the four reading variables, hierarchical regression analyses were executed. Since the correlational patterns were substantially different across groups, the regression analyses were executed for each group separately. Performance in reading abilities at T2 (word reading, non-word reading, sentence comprehension and text comprehension) were entered as dependent variables. In each analysis, the initial level at T1 was entered in step 1, to obtain the residual gain in each of the four variables. The residual gain is the gain that a student shows, that cannot be predicted by the initial level. Next, the students’ intelligence and migration background were entered in step 2 (Stepwise method). In the third and final step,
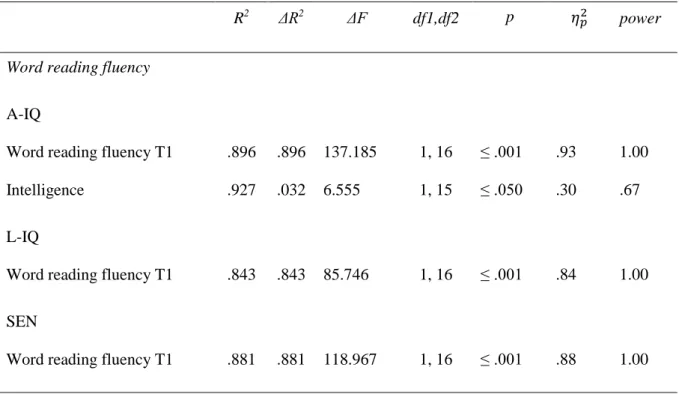
18 social and emotional integration were entered as predictors (Stepwise). The four series of regression analyses, executed for each of the groups separately, are presented in Table 3.
With regard to word reading fluency, Table 3 shows that the effects are not always the same. In the low-IQ group, as well as in the group of students with SEN, only the measure taken at T1 predicts word reading fluency at T2 and the effects are of comparable magnitude (𝜂𝜂𝑝𝑝2 = .84 and .88, respectively). In the average-IQ group, next to word reading fluency at T1, intelligence adds to the prediction (𝜂𝜂𝑝𝑝2 = .93 and .30, with powers of 1.00 and .63, respectively).
For non-word reading fluency, only the T1 measure appears to be a significant predictor.
The effects are equal in the three groups (𝜂𝜂𝑝𝑝2 = .84, .83 and .85, respectively, and power = 1.00).
Table 3. Results of hierarchical regression analyses, as well as effect sizes and power, with students’ reading achievements at T2 as dependent variables, and reading achievements at T1 (Step 1), intelligence and migration background (Step 2) and social and emotional integration (Step 3) as independent variables.
R2 ΔR2 ΔF df1,df2 p 𝜂𝜂𝑝𝑝2 power
Word reading fluency
A-IQ
Word reading fluency T1 Intelligence
L-IQ
Word reading fluency T1 SEN
Word reading fluency T1
.896 .927
.843
.881 .896 .032
.843
.881
137.185 6.555
85.746
118.967
1, 16 1, 15
1, 16
1, 16
≤ .001
≤ .050
≤ .001
≤ .001
.93 .30
.84
.88
1.00 .67
1.00
1.00 Non-word reading fluency
A-IQ
19 Non-word reading fluency T1
L-IQ
Non-word reading fluency T1 SEN
Non-word reading fluency T1
.836
.834
.850 .836
.834
.850
81.719
80.145
90.582
1,16
1, 16
1, 16
≤ .001
≤ .001
≤ .001
.84
.83
.85
1.00
1.00
1.00 Sentence comprehension
A-IQ
Sentence comprehension T1 L-IQ
Sentence comprehension T1 SEN
Sentence comprehension T1
.226
.850
.527 .226
.850
.527
4.673
90.714
17.832
1, 16
1, 16
1,16
≤ .050
≤ .001
≤ .001
.23
.85
.53
.53
1.00
.98 Text comprehension
A-IQ
Text comprehension T1 L-IQ
Text comprehension T1 SEN
Text comprehension T1 Social integration Emotional integration
.381
.657
.552 .659 .753
.381
.657
.552 .107 .095
9.847
30.653
19.692 4.700 5.362
1, 16
1, 16
1, 16 1, 15 1, 14
≤ .010
≤ .001
≤ .001
≤ .050
≤ .050
.38
.66
.72 .28 .28
.84
1.00
1.00 .59 .58
Sentence comprehension at T2 is also predicted by sentence comprehension at T1 only, but the effect-sizes differ from group to group. For the A-IQ group, the effect-size 𝜂𝜂𝑝𝑝2 = .23 (power
20
= .53). In the L-IQ group the effect-size 𝜂𝜂𝑝𝑝2 = .85 (power = 1.00) and in the group of SEN students the effect-size 𝜂𝜂𝑝𝑝2 = .53 (power = .98).
With regard to text comprehension, table 3 shows that text comprehension at T1 is a significant predictor in both the A-IQ group (𝜂𝜂𝑝𝑝2 = .83, power = .84) and the L-IQ group (𝜂𝜂𝑝𝑝2 = .66, power = 1.00). In the SEN group, not only text comprehension at T1 is a significant predictor (𝜂𝜂𝑝𝑝2 = .72, power = .84), but social integration and emotional integration, both with effect-sizes of 𝜂𝜂𝑝𝑝2 = .28 and powers of .59 and .58, respectively, contribute significantly to the prediction.
Finally, migration background is never a significant predictor of reading performance.
Discussion
The results first of all show that students with SEN consistently have the lowest scores on the four reading measures, while the average IQ students always have the highest scores. The significant interaction effect on the reading fluency measures is caused by the fact that the low- IQ group is catching up with the average-IQ group. The students with SEN, however, progress but do not reduce the gap. In the present research, the L-IQ almost reaches the same level as the A-IQ group: an average of almost 1.5 words per second. The same observation is true for non-word reading, i.e., the L-IQ group catches up with the A-IQ group, to a reading speed of almost 1 word per second. The lower value is, of course, related to the fact that these are non- existing words that are not in the students’ repertoire and decoding of these words is not automatized. The students with SEN also progress on non-word reading fluency, but much less than for word reading fluency.
The results further indicate a significantly lower social integration for students with SEN than the low- and average-IQ students, which is in line with the research literature (Frostad &
21 Pijl, 2007; Huber, 2008; Koster, et al., 2010; Pijl, et al., 2008; Pijl & Frostad, 2010; Ruijs &
Peetsma, 2009). The latter two groups do not differ significantly. With regard to emotional integration, however, students with SEN and low IQ students show somewhat higher scores than average students, although the differences are not significant as a result of the large variation within the groups. The pattern of correlations (although not significant due to the small N) suggest that social and emotional integration are positively related to the reading measures in the A-IQ group, but negatively related in the L-IQ group. This might be explained by the fact these students have not been stigmatized as SEN students and have preserved a relatively good self-image. Another hypothesis could be that they actually did receive more support from the teachers because they had difficulties, but were not associated with the low expectations that students with SEN are often confronted with (Bradley, 1983; Campbell & Carlson, 1995; Ellis, 1993; Katims, 2000; Martini-Willemin, 2008).
The negative correlations found between intelligence and the reading measures in the SEN group may well be related to the fact that traditional intelligence tests have been shown to be invalid measures for assessing the abilities of those with intellectual disabilities or learning disabilities (e.g., Budoff, 1967, 1987; Guthke, 1977, 1990; Hessels, Vanderlinden & Rojas, 2011; Hessels-Schlatter, 2002; Reschly, 1997; Riccio, Houston, & Harrison, 1998; Tiekstra, Hessels & Minnaert, 2009). Research has shown that traditional intelligence tests often underestimate the learning capacity of students with SEN and that they often do not predict concurrent or future learning in these populations.
Finally, with regard to the prediction of learning progress in reading, intelligence shows to only be a predictor for reading fluency in the average-IQ group. Intelligence has no additional predictive power for learning in reading in the two low performing groups. This can be seen as a further argument for the independence of reading abilities and intelligence especially in the L-IQ group, a theme that has been discussed frequently (see, e.g., Fuchs & Young, 2006;
Jiménez Glez & Rodrigo López, 1994; Rodrigo López & Jiménez Glez, 2000).
22 In the SEN group, social and emotional integration appear to be a predictor for the most complex learning situation, i.e., text comprehension. It can be assumed that in classes where the social and emotional integration are perceived as more positive, the students feel more accepted, they communicate and discuss more intensively and verbally interact more which in turn may have a positive influence on their verbal abilities and their text comprehension. The fact that social and emotional integration are significant predictors in the SEN group only, might be explained by the fact that both the L-IQ and A-IQ groups are comprised of students that experience relatively few or no problems with learning and, consequently, even if they feel that they have not integrated well, this does not hinder them. For SEN students who do have learning problems, social and emotional integration may well be a facilitating factor for learning.
To conclude, the results of the present study show that SEN students demonstrate progress in a number of reading abilities from 5th to 6th Grade. Nevertheless, they do not reach the level of performance of matched low-IQ students. As reading abilities are of great importance in most school subjects (and will continue to be in many activities in life), it is the most important school achievement variable and therefore schools should promote the development of reading abilities of SEN students. The results of this study seem to imply that students will make better progress when they feel socially and emotionally integrated. The close relationship between reading and social participation suggests that successful interventions also need to take the development of social relationships within the class into account. Moreover, several studies (e.g., Ainscow, 2006; Haeberlin et al., 1989; Huber, 2008) confirm that wellbeing and social participation are the most important elements of effective inclusive education and that inclusion cannot exist without the social participation of all students.
Finally, it must be mentioned that the current study has two limitations. The first concerns the self-reports on emotional and social integration of the students. These are, of course, subjective measures and may or may not reflect the student’s real integration. It is, for instance, well-known that students with disabilities show a tendency to overestimate their school
23 performance (Hessels, Hessels-Schlatter, Bosson &Balli, 2009) and generally are less able to correctly evaluate their situation due to lacking metacognitive competencies (Swanson, 1993).
This might also apply to the students’ evaluation of their social and emotional integration.
Another explanation may be related to preserving self-image, as it may be quite difficult to say of yourself that you do not have any friends in your class. To counter such weaknesses in future research, we will try including more socio-metric data, such as reported friendships within the classroom (by the student and by the peers) and/or classroom observations. A final limitation of the study is the small sample size which might limit generalizability and comparability with other studies. However, we think that this is largely compensated by the fact that students were all matched on intellectual ability, which made the groups highly comparable.
References
Ainscow, M., Booth, T., Dyson, A., Farrell, P., Frankham, J., Gallannaugh, F., Howes, A., &
Smith, R. (2006). Improving schools, developing inclusion. London: Routledge.
Avramidis, E. (2010). Social relationships of pupils with special educational needs in the mainstream primary class: peer group membership and peer‐assessed social behaviour, European Journal of Special Needs Education, 25(4), 413-429.
Avramidis, E., & Norwich, B. (2002). Teachers’ attitudes towards integration/inclusion: A review of the literature. European Journal of Special Needs Education, 17(2), 129-47.
Bagwell, C. L., Newcomb, A. F., & Bukowski,W. M. (1998). Preadolescent friendship and peer rejection as predictors of adult adjustment. Child Development, 69, 140–153.
Baker, E.T., Wang, M.C., & Walberg, H.J. (1995). The effect of inclusion on learning.
Educational Leadership, 52(4), 33-35.
Baumert, J. (2011). Expertenrat „Herkunft und Bildungserfolg“. Empfehlungen für bildungspolitische Weichenstellungen in der Perspektive auf das Jahr 2020 [Expert panel
"Origin and school achievement". Recommandations for school policy development towards the year 2020]. Berlin, Germany: Max-Planck-Institut für Bildungsforschung.
Baumert, P., Stanat, P., & Watermann, R. (2006). Herkunftsbedingte Disparitäten im Bildungswesen: Differenzielle Bildungsprozesse und Probleme der Verteilungsgerechtigkeit. Vertiefende Analysen im Rahmen von PISA 2000 [Disparities in the school system due to origin: Differential schooling processes and problems and just distribution. In depth analysis of PISA 2000]. Wiesbaden, Germany: VS.
Berger, C., Alcalay, L., Torretti, A., & Milicic, N. (2011). Socio-emotional well-being and academic achievement: evidence from a multilevel approach. Psicologia: Reflexão e Crítica [online], 24(2), 344-351. http://dx.doi.org/10.1590/S0102-79722011000200016 Bierman, K. L. (2004). Peer rejection: Developmental Processes and Intervention Strategies.
London: Guilford.
Bos, W., Tarelli, I., Bremerich-Vos, A., & Schwippert, K. (2012). IGLU 2011, Lesekompetenzen von Grundschulkindern in Deutschland im internationalen Vergleich
24 [IGLU 2011, Reading competencies of German primary school children in an international perspective]. Münster, Germany: Waxmann
Bradley, T.B. (1983). Remediation of cognitive deficits: A critical appraisal of the Feuerstein model. Journal of Mental Deficiency Research, 27, 79-92.
Bürli, A. (2009). Integration/Inklusion in Großbritannien [Inclusion in the Great-Britain]. In A.
Bürli, U. Strasser & A.-D. Stein (Hrsg.), Integration und Inklusion aus internationaler Sicht [Integration and inclusion from an international perspective] (pp. 95-108). Bad Heilbrunn, Germany: Klinkhardt.
Buchner, T., Feyerer, E., & Flieger, P. (2009). Report on the social inclusion and social protection of disabled people in European countries. Retrieved from http://www.disabilityeurope.net/content/pdf/AT%20social%20inclusion%20report.pdf Buchner, T., & Gebhardt, M. (2011). Zur schulischen Integration in Osterreich: Historische
Entwicklung, Forschung und Status Quo [School integration in Austria: Historical development, research and status quo]. Zeitschrift fur Heilpadagogik, 62, 298-304.
Budoff, M. (1967) Learning potential among institutionalized young adult retardates. American Journal of Mental Deficiency, 72, 404-411.
Budoff, M. (1987) The validity of learning potential assessment. In C. S. Lidz (Ed.), Dynamic assessment: an interactional approach to evaluating learning potential (pp. 52-81). New York: Guilford.
Campbell, C., & Carlson, J.S. (1995). The dynamic assessment of mental abilities. In J.S.
Carlson (Vol. Ed.), Advances in cognition and educational practice (Vol. 3, pp. 1-31).
Greenwich, CT: JAI Press Inc.
Carlberg, C. & Kavale, K. (1980). The ffficacy of special versus regular class placement for exceptional children: A meta-analysis. The Journal of Special Education, 14, 3, 295 309.
Carlson, E., Daley, T., Bitterman, A., Heinzen, H., Keller, B., Markowitz, J., & Riley, J. (2009).
Early school transitions and the social behavior of children with disabilities: Selected findings from the pre-elementary education longitudinal study. Rockville, MD: Westat.
Available at www.peels.org.
Dessemontet, R.S., Bless, G., & Morin, D. (2012). Effects of inclusion on the academic achievement and adaptive behaviour of children with intellectual disabilities. Journal of Intellectual Disability Research, 56, 6, 579-587.
Dessemontet, R.S., & Bless, G. (2013). The impact of including children with intellectual disability in general education classrooms on the academic achievement of their low-, average-, and high-achieving peers. Journal of Intellectual & Developmental Disability, 38(1), 23–30.
Eberwein, H. (1999). Integrationspädagogik als Weiterentwicklung (sonder-)pädagogischen Denkens und Handelns [Pedagogy for integration as a further development of thinking and acting in special pedagogy]. In H. Eberwein (Ed.), Integrationspädagogik – Kinder mit und ohne Behinderung lernen gemeinsam [Pedagogy for integration – Children with and without disabilities learn together] (pp. 55-68). Weinheim, Germany: Beltz Verlag.
Eckhart, M., Haeberlin, U., Sahli L., C., & Blanc, P. (2011). Langzeitwirkungen der schulischen Integration. Beiträge zur Heil- und Sonderpädogogik, Band 33 [Long term effects of school integration. Contributions to special pedagogy. Volume 33] Bern, Switzerland:
Haupt Verlag..
Ellis, E.S. (1993). Integrative strategy instruction: A potential model for teaching content area subjects to adolescents with learning disabilities. Journal of Learning Disabilities, 26, 358- 383, 398.
Feyerer, E. (2009). Qualität in der Sonderpädagogik: Rahmenbedingungen für eine verbesserte Erziehung, Bildung und Unterrichtung von Schüler/inne/n mit sonderpädagogischem Förderbedarf [Quality in special pedagogy: Basic conditions for better upbringing,
25 education and teaching of students with special education needs]. In W. Specht (Ed.), Nationaler Bildungsbericht Österreich 2009. Band 2: Fokussierte Analysen bildungspolitischer Schwerpunktthemen. [National education report 2009. Volume 2.
Focused analyses of educational policy themes] Graz, Austria: Leykam. Available from http://www.bmukk.gv.at/medienpool/17992/nbb_band2.pdf.
Frostad, P., & Pijl, S.J. (2007). Does being friendly help in making friends? The relation between the social position and social skills of pupils with special needs in mainstream education. European Journal of Special Needs Education, 22, 1, 15-30.
Fuchs, D., & Young, C.L. (2006). On the irrelevance of intelligence in predicting responsiveness to reading instruction. Exceptional Children, 73, 1, 8-30.
Gandhi, A.G. (2007). Context matters: Exploring relations between inclusion and reading achievement of students without disabilities. International Journal of Disability, Development and Education, 54, 1, 91–112.
Gasteiger-Klicpera, B., Oswald, S., Schwab, S., & Ederer, E. (2011). The interdependence between language and reading abilities in children with German as first or second language:
can supporting language acquisition prevent school failure in children with a migration background? Quarterly Bulletin of the Vienna NGO Committee on the Family, 78, 1, 6-12.
Gebhardt, M., Schwab, S., Schaupp, H., Rossmann, P., & Gasteiger-Klicpera, B. (2012).
Heterogene Gruppen in mathematischen Grundfertigkeiten. Eine explorative Erkundung der Fahigkeiten im Grundrechnen in Integrationsklassen der 5. Schulstufe. Zeitschrift für Inklusion [online], 1-2. Retrieved from http://www.inklusion- online.net/index.php/inklusion-online/article/view/69/69
Guthke, J. (1977) Zur Diagnostik der intellectuellen Lernfähigkeit [The assessment of intellectual learning ability]. Berlin, Germany: VEB Deutscher Verlag der Wissenschaften.
Gutman, L.M., & Feinstein, L. (2008). Pupil and school effects on children's well-being.
London: DCSF.
Gutman. L.M., & Vorhaus, J. (2012). The impact of pupil behaviour and wellbeing on educational outcomes. DfE Research Brief 253 [online]. London: DfE . Retrieved from https://www.gov.uk/government/uploads/system/uploads/attachment_data/file/170331/D FE-RR253.pdf
Gürtler, C. (2005). Soziale Ungleichheit unter Kindern: Über die Rolle von Kind- und Elternhausmerkmalen für die Akzeptanz und den Einfluss eines Kindes in seiner Schulklasse [Social injustice among children: About the role of children and parental/family characteristics regarding acceptance and the influence of a child in the classroom]. Unpublished Doctoral Dissertation. Postdam, Germany: University of Potsdam.
Haeberlin, U., Moser, U., Bless, G., & Klaghofer, R. (1989). Integration in die Schulklasse:
Fragebogen zur Erfassung von Dimensionen der Integration von Schülern: FDI 4-6 [Integration in the classroom: questionnaire for assessing dimensions of student integration: FDI 4-6]. Bern, Switzerland: Haupt Verlag.
Haeberlin, U., Bless, G., Moser, U., & Klaghofer, R. (1999). Integration in die Schulklasse:
Fragebogen zur Erfassung von Dimensionen der Integration von Schülern: FDI 4-6 [Integration in the classroom: questionnaire for assessing dimensions of student integration: FDI 4-6]. In U. Haeberlin (Ed.). Beiträge zur Heil- und Sonderpädagogik, 8.
Beiheft zur Vierteljahresschrift für Heilpädagogik und ihre Nachbargebiete [Contributions to special pedagogy 8. Supplement to the quarterly journal of special pedagogy and adjacent areas]. Bern, Switzerland: Haupt Verlag.
Haeberlin, U., Blanc, P., Eckhart, M., & Sahli-Lozano , C. (2012, May). Intégration scolaire d'enfants en difficultés d'apprentissage: effets à long terme. Information sur la recherche éducationnelle, CSRE, n° 12:021 [School integration and learning difficulties: long term
26 effects. Report on educational research, CSRE, No 12:021]. Retrieved from http://www.skbf-csre.ch/pdf/12021.pdf
Hessels, M.G.P., Hessels-Schlatter, C., Bosson, M.S., & Balli, Y. (2009). Metacognitive teaching in a special education class. Journal of Cognitive Education and Psychology, 8, 182-201.
Hessels, M.G.P., Vanderlinden, K., & Rojas, L. (2011). Training effects in dynamic assessment:
A pilot study of eye movement as indicator of problem solving behaviour before and after training. Educational and Child Psychology, 28, 101-113.
Hessels-Schlatter, C. (2002) A dynamic test to assess learning capacity in people with severe impairments. American Journal on Mental Retardation, 107, 340-351.
Hobi-Ragaz, G. (2008). Reproduktion sozialer Ungleichheit? Die Bedeutung von Eltern-, Kind- und Familienmerkmalen für den sozialen Status unter gleichaltrigen der mittleren Kindheit [Reproduction of social inequality? The impact of parent, child and family characteristics on social status of children with equal age in middle childhood]. In M. Eisner, & D.
Ribeaud (Eds.), Forschungsbericht aus der Reihe z-proso: Zürcher Projekt zur sozialen Entwicklung von Kindern, Bericht No. 7 [Research report from the Zurich project on social development of children, No. 7]. Zürich, Switzerland: University of Zurich.
Hornberg, S., Valtin, R., Potthoff, B., Schwippert, K., & Schulz-Zander, R. (2007).
Lesekompetenzen von Mädchen und Jungen im internationalen Vergleich []International comparision of reading competence of girls and boys. In W. Bos, S. Hornberg, K.H.
Arnold, , G. Faust, L. Fried, E.M. Lankes, R. Schwippert, & M. Valtin, (Eds.). IGLU 2006. Lesekompetenzen von Grundschulkindern in Deutschland im internationalen Vergleich [Reading competencies of primary schoolchildren in Germany ininternational comparison]. (pp. 195-223). Münster, Germany: Waxmann.
Huber, C. (2006). Soziale Integration in der Schule?!: Eine empirische Untersuchung zur sozialen Integration von Schülern mit sonderpädagogischem Förderbedarf im gemeinsamen Unterricht [Social integration in school?! An empirical investigation on the social integration of students with special education needs in mainstream classes].
Marburg, Germany: Tectum.
Huber, C. (2008). Jenseits des Modellversuchs:Soziale Integration von Schülern mit sonder- pädagogischem Förderbedarf im Gemeinsamen Unterricht – Eine Evaluationsstudie [The other side of models: social integration of students with special education needs in mainstream classes – An evaluation study]. Heilpädagogische Forschung, 1, 2–14.
Jiménez Glez, J.E., & Rodrigo López, M. (1994). Is it true that the differences in reading performance between students with and without LD cannot be explained by IQ? Journal of Learning Disabilities, 27, 155-163.
Kalambouka, A., Farrell, P., Dyson, A., & Kaplan, I. (2007). The impact of placing pupils with special educational needs in mainstream schools on the achievement of their peers.
Educational Research,. 49(4). 365-382.
Katims, D.S. (2000). Literacy instruction for people with mental retardation: Historical highlights and contemporary analysis. Education and Training in Mental Retardation and Developmental Disabilities, 35, 3-15.
Koster, M., Pijl, S.J., Nakken, H., & Van Houten, E. (2010). Social participation of students with special needs in regular primary education in The Netherlands. International Journal of Disability, Development and Education, 57(1), 59-75.
Landerl, K., & Wimmer, H. (2008). Development of word reading fluency and orthograpic spelling in a consisten orthography: An 8-year follow-up. Journal of Educational Psychology, 100, 150 – 161.
Lenhard W, Schneider W. (2006). ELFE 1-6: Ein Leseverständnistest für Erst – und Sechstklässler [ELFE 1-6: A reading comprehension test for 1st and 6th graders]. Göttingen, Germany: Hogrefe.
27 Manset, G., & Semmel, M. I. (1997). Are inclusive programs for students with mild disabilities effective? A comparative review of model programs. The Journal of Special Education, 31(2), 155-180.
Martini-Willemin, B.-M. (2008). Projet scolaire et participation sociale de personnes présentant une déficience intellectuelle. [School projects and social participation of persons with intellectual disability]. Unpublished doctoral thesis. Geneva: University of Geneva.
McLeskey, J., & Waldron, N.L. (1998).The effects of an inclusive school program on students with mild and severe learning disabilities. Exceptional Children, 64, 395-405.
Meijer, C., Soriano, V., & Watkins, A. (2003). Sonderpädagogische Förderung in Europa [Special needs support in Europe]. Denmark: Europäische Agentur für Entwicklungen in der Sonderpädagogischen Förderung.
Merz, K. (1982). Lernschwierigkeiten- Zur Effizienz von Fördermaßnahmen an Grund- und Lernbehindertenschulen [Learning difficulties – The efficacy of support measures in mainstream and special education classes]. Heilpädagogische Forschung, 1, 53-69.
Moll, K., & Landerl, K. (2010). Lese- und Rechtschreibtest: Weiterentwicklung des Salzburger Lese- und Rechtschreibtest (SLRT) [Reading and spelling test: Development of the Salzburger reading and spelling test (SLRT)]. Bern, Switzerland: Hans Huber.
Mullis, I.V.S., Martin, M.O., Foy, P. & Drucker, K.T. (2012) PIRLS 2011 International Results in Reading. Chestnut Hill: TIMSS & PIRLS International Study Centre.
Myklebust, J.O. (2002). Inclusion or exclusion? Transition among special needs students in upper cecondary education in Norway. European Journal of Special Needs Education, 17(3), 251-263.
Myklebust, J.O. (2006). Class placement and competence attainment among students with special education needs. British Journal of Special Education, 33(2), 76-81.
Myklebust J.O. (2007) Diverging paths in upper secondary education: competence attainment among students with special educational needs. International Journal of Inclusive Education, 11, 215–31.
Newcomb, A.F., Bukowski, W.M., & Pattee, L. (1993). Children's peer relations: A meta- analysis of popular, rejected, neglected, controversial and average sociometric status.
Psychological Bulletin, 113, 99-128.
OECD (2010). Pisa 2009 Results: What students know and can do – Student performance in reading, mathematics and science (Vol. 1). PISA: OECD Publishing. Retrieved from http://dx.doi.org/10.1787/9789264091450-en
Pijl, S.J., & Frostad, P. (2010). Peer acceptance and self-concept of students with disabilities in regular education. European Journal of Special Needs Education, 25(1), 93-105.
Pijl, S.J., Frostad P., & Flem, A. (2008). The social position with special needs in regular schools, Scandinavian Journal of Educational Research, 52(4), 387-405.
Pijl, S.J., Skaalvik, E.M., & Skaalvik, S. (2010). Students with special needs and the composition of their peer group. Irish Educational Studies, 29, 57-70.
Reschly, D.J. (1997) Diagnostic and treatment utility of intelligence tests. In D.P. Flanagan, J.L. Genshaft, & P.L. Harrisson (Eds.), Contemporary intellectual assessment: theories, tests, and issues (pp. 437-456). New York: Guilford.
Riccio, C.A., Houston, F., & Harrison, P.L. (1998) Assessment practices for children with severe mental retardation. Journal of Psychoeducational Assessment, 16, 292-301.
Reynolds, C., & Fletcher-Janzen, E. (2000). Encyclopedia of special education (3 volumes).
New York: Wiley.
Rodrigo López, M. & Jiménez Glez, J.E. (2000). IQ vs phonological recoding skill in explaining differences between poor readers and normal readers in word recognition:
Evidence from a naming task. Reading and Writing, 12, 129-142.
Rossmann, P., Gasteiger Klicpera, B., Gebhardt, M., Roloff, C., & Weindl, A. (2011). Zum Selbstkonzept von SchülerInnen mit sonderpädagogischem Förderbedarf in Sonderschulen
28 und Integrationsklassen [The self-concept of students with special education needs in special school and integration classes]. In R. Mikula & H. Kittl-Satran (Eds.). Dimensionen der Erziehungs- und Bildungswissenschaft [Dimensions of educational and teaching sciences]. Graz, Austria: Leykam.
Rubin, K.H., Bukowski W.M., & Parker, J.G. (1998): Peer interactions, relationships, and groups. In N. Eisenberg (Ed.), Handbook of Child Psychology: Social, emotional, and personality development (pp. 619-700). New York: Wiley.
Ruijs, N.M. & Peetsma, T.T.D. (2009). Effects of inclusion on students with and without special educational needs reviewed. Educational Research Review, 4, 67 – 79 .
Sanders, A. (2005). Konzepte einer inklusiven Pädagogik [Concepts in inclusive pedagogy].
Zeitschrift für Heilpädagogik, 55(5), 240–244.
Schiller E, Sanford C, Blackorby J. (2008) A national profile of classroom experiences and academic performance of students with learning disabilities; Retrieved from http://www.seels.net/info_reports/SEELS_LearnDisability_%20SPEC_TOPIC_REPORT .12.19.08ww_FINAL.pdf
Schwab, S., Gebhardt, M., & Gasteiger-Klicpera, B. (2013). Sozialverhalten von SchülerInnen mit und ohne sonderpädagogischen Förderbedarf in der Sekundarstufe I [Social behaviour of students with and without special education needs in secondary education].
Heilpädagogische Forschung, 3, 140-147.
Schwantner, U. & Schreiner, C. (2010) (Eds.). Pisa 2009. Internationaler Vergleich von Schülerleistungen. Erste Ergebnisse [Pisa 2009. International comparison of school achievements. First results]. Graz, Austria: Leykam Verlag.
Sucán, B., Wallner-Paschon, C., Stöttinger, E. & Bergmüller, S. (2007). PIRLS 2006.
Internationaler Vergleich von Schülerleistungen [PIRLS 2006. International comparison of school achievements]. Graz, Austria: Leykam.
Swanson, H. L. (1993). Executive processing in learning disabled readers. Intelligence, 17, 117–149.
Tent, L., Witt, M., Bürger, W. & Zschoche-Lieberum, C. (1991). Ist die Schule für Lernbehinderte überholt? [Is the school for children with learning disabilities obsolete]
Heilpädagogische Forschung, 1, 289-320.
Tiekstra, M., Hessels, M.G.P., & Minnaert, A.E.M.G. (2009). Learning abilities in adolescents with cognitive impairments. Psychological Reports, 105, 1-12.
Wagner, M., Marder, C., Blackorby, J., Cameto, R., Newman, L., Levine, P. et al. (2003). The Achievement of Youth with Disabilities during Secondary School: A Report from the National Longitudinal Transition Study 2 (U.S. Department of Education, Hrsg.), Menlo
Park, CA: SRI International. Retrieved from http://www.nlts2.org/reports/2003_11/nlts2_report_2003_11_complete.pdf
Waldron, N.L., & McLeskey, J. (1998). The effects of an inclusive school program on students with mild and severe learning disabilities. Exceptional Children, 64, 395-405.
Wang, M. C. & Baker, E. T. (1986). Mainstreaming programs: Design features and effects.
Journal of Special Education, 19(4), 503-521.
Weiß, R.H. (2008). CFT 20 R: Grundintelligenztest Skala 2- Revision [CFT 20 R. Basic intelligence test 2 - Revision]. Göttingen, Germany: Hogrefe.
Wocken, H. (2000). Leistung, Intelligenz und Soziallage von Schülern mit Lernbehinderungen.
Vergleichende Untersuchung an Förderschulen in Hamburg [Achievement, intelligence and social status of students with learning disabilities. Comparative research in special schools in Hamburg]. Zeitschrift für Heilpädagogik, 12, 492-503.
Wocken, H. (2005). Andere Länder, andere Schüler?: Vergleichende Untersuchungen von Förderschülern in den Bundesländern Brandenburg, Hamburg und Niedersachen [Other states, other students? Comparative research in the federal states Brandenburg, Hamburg
29 and Niedersachsen]. Retrieved from http://bidok.uibk.ac.at/library/wocken- forschungsbericht.html
Wocken, H. (2007): Fördert Förderschule? Eine empirische Rundreise durch Schulen für
‘optimale Förderung’ [Does the special school support learning? A journey through school for ‘optimal support’]. In I. Demmer-Dieckmann & A. Textor (Eds.), Integrationsforschung und Bildungspolitik im Dialog [A dialog between research in integration and educational policy] (pp. 35-59). Bad Heilbrunn, Germany: Klinkhardt.
World Health Organisation. (1993). The ICD-10 classification of mental and behavioural disorders. Diagnostic criteria for research. Geneva: WHO.
View publication stats View publication stats