A User Acceptance Model for Robotic Process Automation
Judith Wewerka Institute of Databases and
Information Systems Ulm University Ulm, Germany 0000-0002-4809-2480
Sebastian Dax Chair of Information Systems III
University Regensburg Regensburg, Germany sebastian.dax@wiwi.uni-regensburg.de
Manfred Reichert Institute of Databases and
Information Systems Ulm University Ulm, Germany 0000-0003-2536-4153
Abstract—Robotic Process Automation (RPA) is the rule-based automation of business processes by software bots mimicking human interactions to relieve employees from tedious work. How- ever, any RPA initiative will not be successful if user acceptance is poor. So far, variables influencing RPA user acceptance have not been systematically investigated. The objective of this paper is to develop a model for assessing RPA user acceptance as well as variables influencing it. We derive this model using the Technology Acceptance Model (TAM) and extend TAM by RPA- specific variables. Our empirical validation indicates that the most important variables, which significantly influence perceived usefulness and perceived ease of use are facilitating conditions, result demonstrability,innovation joy, andsocial influence. These findings can be used to derive concrete recommendations for the design and implementation of RPA bots increasing acceptance of employees using the bots during their daily work. For the first time, an RPA user acceptance model is presented and validated contributing to an increased maturity of RPA projects.
Index Terms—Robotic Process Automation, Technology Accep- tance Model, User Acceptance
I. INTRODUCTION
Robotic Process Automation (RPA) aims to automate busi- ness processes or parts of them with software bots (bots for short) by mimicking human interactions with the graphical user interface [6]. Recently, many RPA approaches were implemented and the RPA software market grew by 60%
in 2018 [17]. On one hand, RPA shall relieve employees from tedious works [22]. On the other, it shall save full time equivalents [53]. Employees might, therefore, refuse the use of bots, fearing that they loose their job otherwise [14]. To cope with these fears, the basic variables determining RPA user acceptance need to be understood.
This paper explores these variables by developing an RPA user acceptance model and evaluating it in the automotive industry. A widely used model for predicting technology adop- tion behavior is the Technology Acceptance Model (TAM) [32], [47]. TAM has been applied in areas like, e.g., mobile payment [32], mobile library applications [55], and search- based software engineering [36]. TAM represents beliefs about the consequences of a behavior byinternal variablesdescrib- ing individual perceptions. These internal variables, in turn, are influenced byexternal variables. Internal variables include perceived usefulness (PU), perceived ease of use(PEOU),
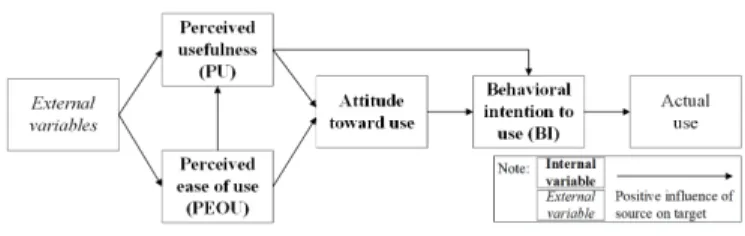
Fig. 1. TAM 1 model.
attitude toward use, and behavioral intention to use (BI) (cf. Figure 1). In particular, PU, i.e., “the degree to which a person believes that using a particular system would enhance his or her job performance” [12] andPEOU, i.e., “the degree to which a person believes that using a particular system would be free of effort” [12], directly influence attitude toward use, which has an impact onBI, and, finally, on the actual use. PU is hypothesized to influence BI directly. These hypothesized interconnections are represented by directed ar- rows (cf. Figure 1), which indicate a positive influence of the source variable on the target variable. Though there is a variety of technology adoption and acceptance models, TAM is considered as the by far most widely used and most influential predictive interpretation model in the analysis and prediction of information technology adoption behavior [32]. Thus, our RPA user acceptance model is based on TAM 1 [11] and its extensions TAM 2 and TAM 3.
The RPA user acceptance model can be used to develop an understanding of the variables of RPA adoption and use.
Consequently, underutilization of future RPA bots shall be prevented and the adoption of already existing RPA bots shall be increased. Overall, the RPA user acceptance model presented in this paper shall help companies to actually realize the economic and technological benefits of RPA.
II. METHODOLOGY
This section introduces the methodology for deriving and validating the RPA user acceptance model (cf. Figure 2). In general, we distinguish two major steps, which are presented in Sections III and IV. Step 1 reviews literature on TAM to collect external variables. Moreover, it studies literature
Fig. 2. Methodology.
on RPA to identify inclusion and exclusion criteria, which are then applied on the collected external variables. These variables, the basic model from TAM literature, and additional RPA-specific variables form our RPA user acceptance model.
Step 2 validates this RPA user acceptance model. A survey is conducted and the obtained data is used to validate the RPA user acceptance model. The analysis of the obtained data allows for optimizing the RPA user acceptance model.
III. DERIVING ANRPA USERACCEPTANCEMODEL
We apply the first step of our method (cf. Figure 2, left) to obtain an initial RPA user acceptance model, i.e., the collection of external variablesfrom TAM literature (cf. Section III-A), the identification of inclusion and exclusion criteria from RPA literature (cf. Section III-B), and the application of these criteria on the variables (cf. Section III-C).
A. Collecting External Variables from TAM Literature We review TAM literature to collect external variables.
TAM 1 has two extensions:TAM 2[48] andTAM 3[47]. The former investigates external variables influencing PU, while the latter determines external variables affecting PEOU. Note that these extensions excludeattitude toward use, originally covered by TAM 1. On one hand, it has proven to be non- significant in practice. On the other, as the connection between PEOU and BI is significant, it is added to the model.
Table I summarizes external variables introduced by the models TAM 1 - TAM 3. To cover a variety of external variables and to explain user acceptance in the best possible way, we additionally consider the Unified Theory of Accep- tance and Use of Technology 1 and 2 (UTAUT 1, UTAUT 2) [49], [50]. The latter is based on eight existing user accep- tance models and is a good summary of possible variables influencing user acceptance. We omit the interconnections between the variables and refer to [10], [11], [13], [33], [37], [44], [46]–[51] instead. In addition to external variables, moderating variables may be added to a technology accep- tance model. The latter moderate the influence of external variables on internal ones like, e.g., experience [23], [48]–
[50], voluntariness [2], [23], [48], [49], age [49], [50], and gender [49], [50]. Figure 3 visualizes the difference between external,internal, and moderating variables.
TABLE I
External variablesDERIVED FROM TECHNOLOGY ACCEPTANCE LITERATURE.
External variable Definition Model
Subjective norm, so- cial influence
Social influence of people being important to the user
TAM 2, UTAUT 1 Image Use of the technology enhances the
reputation or status of the user
TAM 2 Job relevance New technology is applicable to
the job of the user
TAM 2 Result demonstrabil-
ity
Effects from the use of technology are tangible for the user
TAM 2 Output quality The technology performs job-
related tasks
TAM 2 Computer self-
efficacy
Users’ perception of their ability to use computers
TAM 3 Perceptions of exter-
nal control, facilitat- ing conditions
Availability of resources and sup- port structure to facilitate the use of the technology
TAM 3, UTAUT 1 Computer anxiety Users’ fear or apprehension when
using computers
TAM 3 Computer playful-
ness
Intrinsic motivation of users for applying emerging technologies
TAM 3 Perceived enjoyment,
hedonic motivation
System-specific fun and pleasure for using the technology
TAM 3, UTAUT 2 Objective usability Actual effort required to complete
specific tasks using the technology
TAM 3 Price value Trade off between perceived bene-
fits of the technology and the costs caused by its use
UTAUT 2
Habit Automatic behavior due to learning UTAUT 2
Fig. 3. Relation betweenexternal,internal, and moderating variables.
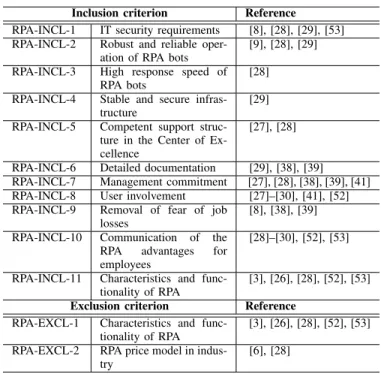
B. Identifying Inclusion/Exclusion Criteria in RPA Literature This section reviews RPA literature in order to derive inclusion and exclusion criteria for deciding whether or not external variables (cf. Table I) shall be considered in the RPA user acceptance model. As RPA is a rather new research area, we additionally consider critical success factors dis- cussed in Business Process Management [38], Process-aware Information Systems [39], and Workflow Implementation [8], [9], [41] to obtain more rigor criteria. Table II shows the derived inclusion and exclusion criteria. Note that all criteria are initially derived from RPA literature.
C. Applying the Criteria on the Variables
We apply the inclusion and exclusion criteria (cf. Table II) to theexternal variables(cf. Table I), resulting in those variables that might affect PUandPEOUin the RPA context.
A variable is included in the RPA user acceptance model if it fulfills at least one inclusion criterion and is excluded if any exclusion criterion is met. Besides the RPA-specific exclusion criteria, we introduce two additional ones:
TABLE II
INCLUSION/EXCLUSION CRITERIA DERIVED FROMRPALITERATURE. Inclusion criterion Reference
RPA-INCL-1 IT security requirements [8], [28], [29], [53]
RPA-INCL-2 Robust and reliable oper- ation of RPA bots
[9], [28], [29]
RPA-INCL-3 High response speed of RPA bots
[28]
RPA-INCL-4 Stable and secure infras- tructure
[29]
RPA-INCL-5 Competent support struc- ture in the Center of Ex- cellence
[27], [28]
RPA-INCL-6 Detailed documentation [29], [38], [39]
RPA-INCL-7 Management commitment [27], [28], [38], [39], [41]
RPA-INCL-8 User involvement [27]–[30], [41], [52]
RPA-INCL-9 Removal of fear of job losses
[8], [38], [39]
RPA-INCL-10 Communication of the RPA advantages for employees
[28]–[30], [52], [53]
RPA-INCL-11 Characteristics and func- tionality of RPA
[3], [26], [28], [52], [53]
Exclusion criterion Reference RPA-EXCL-1 Characteristics and func-
tionality of RPA
[3], [26], [28], [52], [53]
RPA-EXCL-2 RPA price model in indus- try
[6], [28]
- CTX-EXCL-1: Variable is out of scope for our research, i.e., the external variable does not contribute to a basic understanding of RPA user acceptance.
- CTX-EXCL-2: Variable is outdated. Note that the first technology acceptance models are around 40 years old and not every variable is valid in its original version anymore.
Table III summarizes theexternal variableswe included as well as the reason for inclusion. The criteria are elaborated in detail in the following:
- Social influence. According to literature on RPA use cases, management commitment is important to adopt RPA bots (RPA-INCL-7).
- Job relevance. To be job-relevant, the bots need to be robust and reliable (RPA-INCL-2). Users should state relevant bot features to be relieved from repetitive tasks (RPA-INCL-8, RPA-INCL-11).
- Result demonstrability. This variable tests whether the bot is reliable, documented, and results are tangible (RPA- INCL-2, RPA-INCL-6).
- Computer self-efficacy. According to RPA literature, users should be involved in RPA projects and their fear of losing their job should be reduced (RPA-INCL-8, RPA- INCL-9). This variable varies from user to user.
- Facilitating conditions. To investigate whether support by experts (RPA-INCL-5) or documentation (RPA-INCL-6) is available to the user. As reported by RPA literature, both aspects constitute important success factors for RPA.
- Innovation joy. This variable is derived as a positive form ofcomputer anxietyand is included to investigate whether
TABLE III
External variablesINCLUDED IN THERPAUSER ACCEPTANCE MODEL. External variable Inclusion criteria
Social influence RPA-INCL-7
Job relevance RPA-INCL-2, RPA-INCL-8, RPA-INCL-11 Result demonstrability RPA-INCL-2, RPA-INCL-6
Computer self-efficacy RPA-INCL-8, RPA-INCL-9 Facilitating conditions RPA-INCL-5, RPA-INCL-6 Innovation joy RPA-INCL-9
Hedonic motivation RPA-INCL-11
the attitude of the user toward new technology (RPA- INCL-9) has an influence on acceptance.
- Hedonic motivation. RPA should be used to redeploy employees from boring routine work to more interesting, decision-making tasks (RPA-INCL-11). Thus, hedonic motivation might influence RPA bot acceptance.
Having a closer look at the inclusion criteria, we notice that RPA-INCL-1 and RPA-INCL-10 have never been used to include an external variable from Table I. Thus, it is rea- sonable to include additional RPA-specific external variables not listed in this table. [42] integrates trust with TAM, as
“trust is essential for understanding interpersonal behavior”
[42]. In an RPA-specific context, trust can be observed from both a reliability and a risk perspective. Therefore, trust meets RPA-INCL-1, RPA-INCL-2, RPA-INCL-4, and RPA-INCL- 6 and is included in our RPA user acceptance model. We further add variable user involvement (RPA-INCL-8, RPA- INCL-10) to the RPA user acceptance model as it refers to user involvement during the design and implementation of RPA bots. Additionally, it checks whether the user has been informed about the opportunities provided by automation.
Table IV depictsexternal variablesexcluded from the RPA user acceptance model and corresponding exclusion criteria:
- Image. This variable is excluded as in a working context, reputation is nowadays improved through hard work and good results, but not by using a specific technology (CTX-EXCL-2).
- Output quality. The output of RPA bots is either correct or incorrect. Therefore, output quality is not measurable on a scale and thus it is excluded (RPA-EXCL-1).
- Computer playfulness. RPA bots only work in the defined way and the user cannot play with them or try out different functions (RPA-EXCL-1).
- Objective usability. The execution time of the bot cannot be influenced by the user once the bot is triggered.
Therefore, this variable is excluded (RPA-EXCL-1).
- Price value. In practice, users do not pay to use RPA bots. Hence, price value is excluded (RPA-EXCL-2).
- Habit. To measure this variable, it is required to conduct the survey several times. Our goal is to obtain a basic understanding of RPA user acceptance. Thus, we exclude this variable (CTX-EXCL-1).
The moderating variables experience, voluntariness, age, and gender are excluded due to CTX-EXCL-1. Remember that the
TABLE IV
External variablesEXCLUDED FROM THERPAUSER ACCEPTANCE MODEL. External variable Exclusion criteria
Image CTX-EXCL-2
Output quality RPA-EXCL-1 Computer playfulness RPA-EXCL-1 Objective usability RPA-EXCL-1
Price value RPA-EXCL-2
Habit CTX-EXCL-1
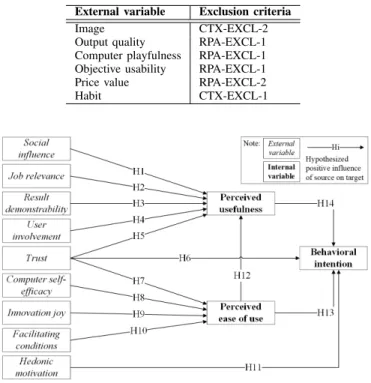
Fig. 4. RPA user acceptance model.
objective of this study is to get a basic understanding of RPA user acceptance as well as the variables influencing it.
Internal variables as well as all interconnections are strongly oriented to the original TAM. We excludeactual use as TAM is more likely to predict BI than actual use [45], which is in line with our research goal. Figure 4 shows the RPA user acceptance model including all variables (external andinternal), interconnections, and resulting hypotheses (H1- H14). Remember that an interconnection hypothesizes a pos- itive influence of the source variable on the target variable of the arrow.
IV. VALIDATING THERPA USERACCEPTANCEMODEL
To validate the derived RPA user acceptance model em- pirically, a quantitative survey is developed, reviewed, and sent to actual and potential RPA users (cf. Fig 2, right). The Appendix summarizes all external and internal variables of the RPA user acceptance model, the corresponding question items, and references (cf. Table VI). All variables are queried by three question items each (cf. [11]). Most question items are taken from the questionnaires of TAM literature. Any adjustments of the question items to the RPA context are documented in Table VI. Each question item is tokenized to facilitate the reference to specific ones. The user answers the question items by a 7-point Likert scale ranging from 1 (“I totally disagree”) to 7 (“I totally agree”). Additionally, questions to gather general information, i.e., gender, age, and experience with RPA bots, are included at the beginning of the questionnaire. After reviewing the questionnaire with some
Fig. 5. Descriptive analysis.
trail subjects, we sent it to 150 RPA users in a large automotive company.
In the following, the data gathered with this questionnaire are analyzed using the partial least squares-structural equation modeling with the SmartPLS V.3.2.9 software. Firstly, we assess the minimum sample size and conduct a descriptive analysis (cf. Section IV-A). We adhere to the guidelines set out for the use of partial least squares-structural equation modeling in information systems [4], [5], [21]. Therefore, secondly, the quality of the measurement model is checked (cf. Section IV-B). This analysis considers the interconnections between the variables and the questions in the questionnaire.
Thirdly, the structural model, i.e., the interconnection between the variables themselves, is analysed (cf. Section IV-C). Hence, we compare the theoretical model with reality as characterized by the gathered data.
A. Descriptive Analysis
The minimum sample size for partial least squares-structural equation modeling should be equal to the maximum of: ten times the largest number of question items used to measure a variable, i.e., 30, or ten times the largest number of arrows directed at a variable, i.e., 50 [19]. Therefore, the minimal sample size for our model is 50. Out of the 150 employees to whom the questionnaire had been sent, we received 50 responses, resulting in a response rate of 33.33% and fulfilling the minimal sample size.
Of the 50 respondents, 58% (N=29) are male and 42%
(N=21) are female. The majority is 30 years or younger (46%, N=23); 34% (N=17) of the respondents have an age between 31 and 40 years, 10% (N=5) are between 41 and 50 years old, and 10% (N=5) are 50 years or older (cf. Figure 5, left).
Note that 56% (N=28) of the respondents have been using RPA bots for more than six months, 16% (N=8) between three and six months, 18% (N=9) between one and three months, and 10% (N=5) less than a month (cf. Figure 5, right).
B. Measure Model Assessment
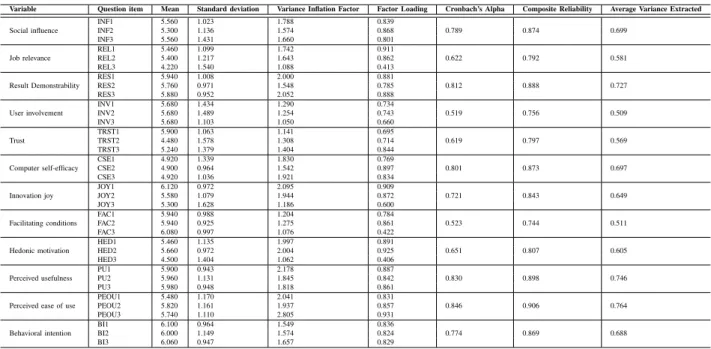
Before testing the hypotheses in the structural model, the quality of the measurement model is assessed in terms of reliability(Cronbach’s Alpha, Composite Reliability),conver- gent validity(Average Variance Extracted, Factor Loadings), and discriminant validity (Fornell-Larcker Criterion, Cross Loadings). The respective tables can be found in the Appendix.
Reliability refers to the degree to which a measure is free of variable error [15]. To test reliability, Cronbach’s Alpha and
Composite Reliability are evaluated. As minimum threshold value for Cronbach’s Alpha we use 0.600 as we are still in an exploratory research phase [4]. This threshold is not reached by variables user involvement(0.519) andfacilitating conditions(0.523) (cf. Table VII). However, for early stages of research, Cronbach’s Alpha values between 0.500 and 0.600 are recommended [40] and are fulfilled by all variables. The values of Composite Reliability lie between 0.744 (facilitat- ing conditions) and 0.906 (PEOU), exceeding the suggested value of 0.700 [4] (cf. Table VII). As Composite Reliability is regarded as more suitable to assess reliability [4], the model holds the reliability constraints.
Convergent validity refers to whether the items comprising a scale behave as if they are measuring a common underlying variable [12]. Convergent validity is assessed by Average Variance Extracted and Factor Loadings. An average vari- ance extracted of 0.500 or higher is satisfactory meaning that on average a variable explains (more than) 50% of the variance of its items [43]. All variables fulfill this constraint with values ranging from 0.509 for user involvement to 0.764 for PEOU (cf. Table VII). Factor Loadings, in turn, correspond to the correlation coefficients of each question item with its variable [5]. Factor Loadings of 0.500 or greater are necessary for achieving practical significance [18]. Note that this constraint is not met by REL3 (0.413), FAC3 (0.422), and HED3 (0.406).
However, values between 0.300 and 0.400 are still acceptable.
Therefore, all question items fulfill the requirements and convergent validity is ascertained (cf. Table VII).
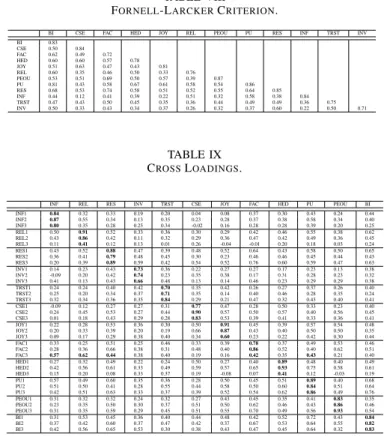
Discriminant validity corresponds to the degree to which a variable is truly distinct from others [18]. The Fornell- Larcker Criterion and Cross Loadings are used to assess discriminant validity. The former is fulfilled if each variable shares more variance with its assigned question items than with other variables in the model [4]. This constraint is met by all variables (cf. Table VIII). The latter criterion, i.e., Cross Loadings, demands that the loadings of a question item with its variable should be higher than the loadings with all remaining variables [19]. This constraint is not met by FAC3, which is, therefore, omitted from the empirical evaluation of the structural model (cf. Table IX).
Furthermore, the RPA user acceptance model is checked for high levels ofmulticollinarityby evaluating theVariance In- flation Factor, which should not exceed 5 [19]. The question items of our RPA user acceptance model show no signs of multicollinearity with a maximum variance inflation factor of 2.805 for PEOU3 (cf. Table VII).
In summary, the quality of the measurement model is ascer- tained, and the constraints for reliability as well as convergent and discriminant validity are met.
C. Structural Model Assessment
The structural model is assessed in terms of hypotheses testing and coefficients of determination using the partial least squares algorithm. The maximum number of iterations is set to 500 and the stop criterion to 10−7. Path coefficients are standardized regression coefficients used in assessing causal
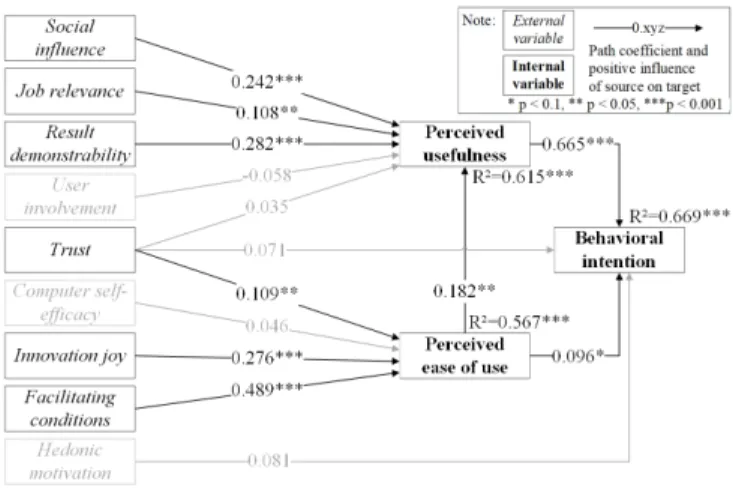
Fig. 6. Structural model with path coefficients, significance levels, andR2 values.
linkages and relative effects between statistical variables in partial least squares-structural equation modeling [19], [24].
Regarding the assessment of path coefficients in partial least squares models, a minimum threshold of 0.100 is considered to be significant [34]. Thecoefficients of determinationare de- noted asR2values measuring the proportion of the variance of theinternalvariables explained by theexternalones [20]. The R2values should be judged in relation to studies investigating the same internal variable. R2 values can be high for well understood phenomena or low for less understood phenomena [54]. The bootstrapping algorithm (number of Bootstrap sub samples = 5000) is used to compute the significance level of the path coefficients, i.e.,p-values. If the p-value exceeds 5%, there is no empirical support to retain a question item or a variable’s interconnection, and, thus, its theoretical relevance should be questioned [19].
Figure 6 depicts R2 values of each internal variable and the path coefficients as well as p-values of each hypothesis.
Non-significant variables and interconnections are printed in grey. The following external variables have positive and significant influence on PU: social influence (b = 0.242, p <0.001), job relevance (b = 0.108,p <0.05), and result demonstrability(b= 0.282,p <0.001). PU has a positive and significant influence on BI (b = 0.665, p <0.001). In turn, PEOUis significantly influenced in positive direction bytrust (b= 0.109,p <0.05),innovation joy(b= 0.276,p <0.001), andfacilitating conditions(b= 0.489,p <0.001). Moreover, PEOU influences PU (b= 0.182,p <0.05) and BI (b= 0.096, p < 0.1) positively and significantly. Thus, Hypotheses H1- H3, H7, H9, H10, and H12-H14 are supported.
V. DISCUSSION
The presented results are discussed in the following. First, statistically significant interconnections are explained (cf. Sec- tion V-A). Second, statistically non-significant interconnec- tions are analysed and possible reasons for non-significance are provided (cf. Section V-B). Third, the R2 values of the RPA user acceptance model are compared with R2 values
in TAM 1 - TAM 3 (cf. Section V-C). Fourth, we derive recommendations for increasing RPA user acceptance based on the statistically significant interconnections in our RPA user acceptance model (cf. Section V-D). Fifth, threats to validity are discussed (cf. Section V-E).
A. Statistically Significant Interconnections
Hypothesis H1 is in line with TAM 2, TAM 3, UTAUT 1, and UTAUT 2, describing the leveraging effect of social influence on PU. The interconnection shows a comparatively high path coefficient of 0.242. On one hand, this indicates the importance of management commitment and support. On the other, word-of-mouth propaganda is revealed as a driver for RPA adoption. Employees perceive RPA as useful, increasing their productivity, if colleagues consider the technology as useful. Although 72% of the respondents have been using RPA bots over at least three months, the impact of social influence on PU is high. For the early phases of using RPA bots, we assume that social influence has an even greater importance.
The hypothesized influence of job relevanceonPU is em- pirically supported (H2) although the path coefficient (0.108) is only slightly above the threshold of 0.100. H2 emphasizes that PU of RPA becomes higher if the RPA bot takes over frequently recurring or time-consuming tasks. Question item REL3 checks whether the workload of a respondent can hardly be handled without RPA bots (cf. Table VI). The low factor loading of 0.413 (cf. Table VII) indicates that RPA is a supporting technology not being capable of replacing workforce.
Hypothesis H3, i.e., “result demonstrabilitypositively influ- ences PU”, is supported. Note that this finding is in line with the observations made in TAM 2 and TAM 3. Employees need to understand what RPA bots can do for them and why their usage is beneficial. If users cannot trace efficiency gains back to RPA, they do not perceive RPA usefulness and eventually do not accept it, although RPA bots produce the desired results.
Result demonstrability is the strongest driver for PU showing a path coefficient of 0.282.
Regarding the predictors ofPEOU,trust(H7) has a signif- icant, but low impact (0.109). Nevertheless, for employees it is important to trust the RPA bots to perform as designed and deliver the desired results. If trust is low, the user monitors and verifies all results produced by RPA bots. Thus, process time and effort increase and negatively influence PEOU.
Hypothesis H9 describes the influence of innovation joy on PEOU and is supported with a high path coefficient of 0.276. Innovation joy follows a more general approach than computer anxiety (in TAM 3). In particular, it examines the attitudes of users concerning new technologies and their fear of being replaced by them. Question item JOY3 states that the respondent is not afraid of being replaced by computers in near future (cf. Table VI). As opposed to JOY1 and JOY2, JOY3 is characterized by a low mean of 5.300 and a factor loading of 0.600 (cf. Table VII). Altogether, respondents do not fully agree with this statement. The individual joy of a
user to explore new technologies plays a major role for the PEOU of RPA.
Facilitating conditionscorrespond to the external variable with the strongest effect onPEOU(H10). The path coefficient of 0.489 shows the highest influence for all external variables of the RPA user acceptance model. The significance of the interconnection is in line with the empirical investigations made in TAM 3 (perceptions of external control), UTAUT 1, and UTAUT 2. Although question item FAC3 is omitted from the RPA user acceptance model due to discriminant validity violations (cf. Table IX), it is essential for the employees to be provided with the resources and knowledge necessary to use the RPA bots. Literature on technology acceptance emphasizes that in early stages older employees attach more importance to receiving assistance with new technology. Although 80% of the respondents are 40 years or younger and 72% have been using RPA for more than 3 months, facilitating conditions have a strong influence on PEOU.
PEOU significantly influences PU with a path coefficient of 0.182 (H12). This finding is in line with TAM 1, TAM 2, and TAM 3. The easier RPA bots are to operate, the more useful they might be. Thus, the use of RPA bots should not cause user efforts. According to TAM 3, the effect of PEOU on PU becomes stronger with increasing experience. 72% of the respondents have been using RPA bots for more than 3 months and have gained enough experience to judge the difficulty of using RPA bots. This results in the strong influence, PEOU has on PU in the RPA context.
The interconnection between PEOUand BI(H13) is par- tially supported. The path coefficient of 0.096 is slightly below the threshold of 0.100, and the p-value of 0.093 is statistically significant if a 90% confidence interval is acceptable [19].
In TAM 1, the influence of PEOU on BI is justified by the fact that the performance advantages of a system can be outweighed by the effort of using it. In TAM 3, the effect of PEOU on BI weakens with increasing experience.
Note that an experienced user is accustomed to the way a systems works and knows how to use it. In UTAUT 1, the effect of effort expectancy on BI is only significant after initial training; it becomes non-significant with increasing experience. Therefore, the weak influence of PEOU on BI is due to the experience the respondents have with RPA.
PU is the key driver for BI with a path coefficient of 0.665 (H14). PU, in turn, is significantly impacted by social influence, job relevance, result demonstrability, and PEOU.
The interconnection shows that RPA bots should contribute to a substantial increase in job performance and productivity to be adopted by the employees. UTAUT 1 empirically validates that men and particularly younger men place more importance on task accomplishment. These findings are in line with our empirical investigation in the RPA context: 80% of the respondents are 40 years or younger and 58% are male.
B. Statistically Non-Significant Interconnections
Regarding RPA use cases, we include a number ofexternal variablesin the RPA user acceptance model. Though not all
are statistically significant, they still provide valuable insights.
The influence ofuser involvementonPU(H4) is statistically not significant. As a potential explanation, its question items INV1 and INV2 are distinct from INV3 (cf. Table VI). The latter checks whether the user was informed about the benefits RPA provides for him. Theoretically, RPA can lead to higher job satisfaction. INV1 and INV2 ask whether the respondent is involved in clarifying the automation needs and the testing of RPA bots. We hypothesize that users involved in designing and testing the requirements of RPA bots better understand how useful the technology is. However, this effect has not been proven true for our sample group.
The hypothesized effects of trust onPU(H5) andBI(H6) are statistically not significant. Theoretically, the intercon- nection between trust and PU is justified by the fact that the user is dependent on the programmer of the RPA bots [42]. Empirically, this reasoning does not apply, as RPA is a supporting technology and users still have the possibility to complete a certain task manually, if they do not trust the RPA bots. Moreover, trust is hypothesized to create positive attitudes toward a certain technology, reducing the uncertainty associated with its use, i.e. increasing BI [42]. This reasoning is statistically not confirmed by the survey. PU is the key driver for BI, whereas trust becomes less important. Finally, privacy risk concerns seem to be non-relevant as well.
In the RPA context,computer self-efficacyhas no significant influence on PEOU(H8). RPA requires only basic computer skills, which does not pose a problem concerning our sample group. The assumed effect of different computer-related skills of users on their PEOU does not vindicate.
The hypothesized interconnection between hedonic moti- vation and BI is statistically not significant (H11). Question item HED3 states that the use of RPA bots is entertaining (cf. Table VI). Its factor loading is extremely low compared to the other question items of hedonic motivation (cf. Table VII). RPA bots do not claim to be enjoyable, their main purpose is to increase productivity. According to UTAUT 2, hedonic motivation becomes less important in predicting BI with increasing experience and can be a reason to explore emerging technologies. In the long term, employees use RPA for more pragmatic purposes, e.g., to be relieved from non- value adding tasks.
C. Comparing Coefficients of Determination
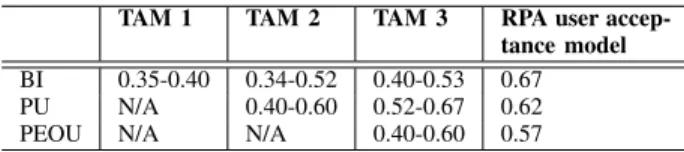
The R2 values are compared with existing technology acceptance literature to evaluate their quality. Note that the values in Table V are non-deterministic as they depend on, e.g., the respective study participants and their experience. Our RPA user acceptance model explains 67% of the variance in BI. This value is higher than the R2 values ofBIin TAM 1, TAM 2, and TAM 3. Variablessocial influence,job relevance, andresult demonstrabilityexplain 62% of the variance inPU.
Compared to TAM 2, theR2value of the RPA user acceptance model exceeds the value of TAM 2 and ranks in the middle compared to TAM 3. External variables of PU are not modeled in TAM 1 and the R2 value cannot be compared. Variables
TABLE V R2VALUES IN COMPARISON.
TAM 1 TAM 2 TAM 3 RPA user accep- tance model BI 0.35-0.40 0.34-0.52 0.40-0.53 0.67
PU N/A 0.40-0.60 0.52-0.67 0.62
PEOU N/A N/A 0.40-0.60 0.57
trust, innovation joy, and facilitating conditions explain 57%
of the variance in PEOU. Note that this value is highly acceptable compared to TAM 3 whoseR2 value lies between 40% and 60%. PEOU is not modeled in TAM 1 and TAM 2 and, therefore, a comparison is impossible.
D. Recommendations for Increasing RPA User Acceptance Based on the statistically significant interconnections of the RPA user acceptance model, recommendations to increase RPA user acceptance are derived. We recommend ensuring management support and establishingRPA opinion multi- pliers, which both serve as a kind of technology ambassador advertising RPA use in personal contact with their colleagues.
This finding is in line with literature on RPA use cases, which additionally observes that the number of RPA projects grows exponentially, if management is promoting the technology [27]. Based on the influence of job relevance on PU, the potential use cases must be examined thoroughly. Any automation must introduce real benefits, otherwise it is not worth for the employee to learn how to use RPA bots, e.g., the predicted savings of full time equivalents due to RPA automation should be carefully chosen. This is in line with the literature on RPA use cases, e.g., [53] proposes to automate processes saving three full time equivalents and more.
Intensive communication and practical demonstration of RPA advantages, e.g., through live demonstrations of existing RPA bots, are crucial as well. These tasks could be accom- plished by the RPA opinion multipliers, which can convince their colleagues that RPA relieves them from repetitive and boring tasks, and enables them to work on more sophisticated and value-adding activities. The recommendations are based on the high influence ofresult demonstrabilityandinnovation joy onPU andPEOUrespectively. Our empirical data show that employees are generally not hesitant to try out new technologies, but have concerns that RPA eventually leads to job losses. RPA literature considers the removal of fear of job losses and the clarification of new opportunities the automation offers as crucial success factor for RPA projects [28].
Areliable and trustworthy operation of RPA botsneeds to be ensured although the influence oftrustonPEOUis low.
Literature on RPA use cases suggests that RPA bots should have built-in controls and checkpoints to verify that the process ran correctly, e.g., regular updates on the current processing status may increase confidence in the technology [29].
Facilitating conditions are the most influential variable of the RPA user acceptance model as well as key success driver of RPA projects. On one hand, extensive training sessions
should be offered to users, e.g., which information and in which manner information must be provided to the RPA bots.
Detailed documentationand user manuals help employees to look up the way RPA bots work. On the other, users need to be equipped with the resources necessary to use RPA bots. This includes the infrastructure as well as the access rights required.
Our empirical investigation shows that facilitating conditions are one of the key variables of RPA for our rather young and experienced sample group. This indicates that support should be continuously provided to employees of all ages during the complete life cycle of the RPA bots.
Special attention should be paid to a user-friendly de- sign. This includes, the communication between RPA bots and users. Moreover, RPA bots could use optical character recognition instead of rigid selectors to find information on dynamically changing platforms like a website.
The statistically non-significant interconnections enable fur- ther recommendations. Regarding our sample group, user involvementdoes not significantly influencePUand is, there- fore, not necessary. Computer self-efficacy has no influence on PEOU. RPA requires only basic computer skills. The interconnection between hedonic motivation and BI is not significant. Thus, the enhancement of hedonic motivation does not contribute to a sustainable use of RPA bots.
E. Threats to Validity
As thread to validity, the RPA user acceptance model is only validated in one company in the automotive domain. Note that carrying out the survey in other companies or industry sectors might lead to different results. Moreover, our work is limited to the concepts of the chosen literature on technology acceptance and not all possible variables influencing RPA user acceptance might have been considered. Finally, our sample group is young and experienced with RPA. An increased number and a more balanced distribution of respondents could further enhance the explanatory power of the model.
VI. SUMMARY ANDOUTLOOK
Our goal was to gain a basic understanding of key variables influencing RPA user acceptance. This goal has been achieved by expanding TAM by external variables. The developed RPA user acceptance model is empirically validated. Our results confirm thatsocial influence,job relevance, and result demonstrabilitypositively influencePU.Trust,innovation joy, and facilitating conditions are significant as well as positive influencing variables of PEOU. Note that the goodness of fit of our RPA user acceptance model is highly satisfying compared to other TAMs. Finally, concrete recommendations for developing new RPA bots and improving existing RPA bots are developed. Future work can focus on incorporating additional external variables into the developed RPA user acceptance model, testing our results with diverse user groups, and modeling moderating variables, e.g., gender, age, or ex- perience to deepen the understanding of RPA user acceptance.
APPENDIX
REFERENCES
[1] R. Agarwal and E. Karahanna, “Time Flies When You’re Having Fun:
Cognitive Absorption and Beliefs about Information Technology Usage,”
MIS Q, vol. 24, no. 4, pp. 665–694, 2000.
[2] R. Agarwal and J. Prasad, “The Role of Innovation Characteristics and Perceived Voluntariness in the Acceptance of Information Technologies,”
Decis Sci, vol. 28, no. 3, pp. 557–582, 1997.
[3] S. Aguirre and A. Rodriguez, “Automation of a Business Process Using Robotic Process Automation (RPA): A Case Study,” in Workshop on Eng Appl. Springer, 2017, pp. 65–71.
[4] M. Al-Emran, V. Mezhuyev, and A. Kamaludin, “PLS-SEM in Informa- tion Systems Research: A Comprehensive Methodological Reference,”
inInt Conf on Advanced Intelligent Systems and Informatics. Springer, Cham, 2018, pp. 644–653.
[5] J. C. Anderson and D. W. Gerbing, “Structural equation modeling in practice: A review and recommended two-step approach,”Psychol Bull, vol. 103, no. 3, pp. 411–423, 1988.
[6] A. Asatiani and E. Penttinen, “Turning robotic process automation into commercial success - Case OpusCapita,” J Inf Technol Teach Cases, vol. 6, no. 2, pp. 67–74, 2016.
[7] F. G. Barbeite and E. M. Weiss, “Computer self-efficacy and anxiety scales for an Internet sample: testing measurement equivalence of existing measures and development of new scales,” Comput Human Behav, vol. 20, no. 1, pp. 1–15, 2004.
[8] J. Becker, C. V. Uthmann, M. zur Muehlen, and M. Rosemann, “Identi- fying the workflow potential of business processes,” inHICCS. IEEE, 1999, pp. 10–20.
[9] S. Choenni, R. Bakker, and W. Baets, “On the Evaluation of Workflow Systems in Business Processes,”Electron J Inf Sys Eval, vol. 6, no. 2, pp. 33–44, 2003.
[10] D. R. Compeau and C. A. Higgins, “Application of Social Cognitive Theory to Training for Computer Skills,”Inf Syst Res, vol. 6, no. 2, pp.
118–143, 1995.
[11] F. D. Davis, “A technology acceptance model for empirically testing new end-user information systems: Theory and results,” Ph.D. dissertation, Massachussetts Institute of Technology, 1985.
[12] ——, “Perceived Usefulness, Perceived Ease of Use, and User Accep- tance of Information Technology,”MIS Q, vol. 13, no. 3, pp. 319–339, 1989.
[13] W. B. Dodds, K. B. Monroe, and D. Grewal, “Effects of Price, Brand, and Store Information on Buyers’ Product Evaluations,” J Mark Res, vol. 28, no. 3, pp. 307–319, 1991.
[14] D. Fernandez and A. Aman, “Impacts of Robotic Process Automation on Global Accounting Services,”Asian J Account Gov, vol. 9, pp. 123–132, 2018.
[15] M. Fishbein and I. Ajzen, “Belief, attitude, intention, and behavior: An introduction to theory and research,” 1977.
[16] C. R. Franz and D. Robey, “Organizational context, user involvement, and the usefulness of information systems,”Decis Sci, vol. 17, no. 3, pp. 329–356, 1986.
[17] Gartner, “Predicts 2020: RPA Renaissance Driven by Morphing Offer- ings and Zeal for Operational Excellence,” Tech. Rep., 2020.
[18] J. F. Hair, W. C. Black, B. J. Babin, and R. E. Anderson, “Multivariate Data Analysis,”Essex Pearson Educ Ltd, 2014.
[19] J. F. Hair, C. M. Ringle, and M. Sarstedt, “PLS-SEM: Indeed a Silver Bullet,”J Mark Theory Pract, vol. 19, no. 2, pp. 139–152, 2011.
[20] J. F. Hair, M. Sarstedt, C. M. Ringle, and J. A. Mena, “An assessment of the use of partial least squares structural equation modeling in marketing research,”J Acad of Mark Sci, vol. 40, no. 3, pp. 414–433, 2012.
[21] J. Hair, C. L. Hollingsworth, A. B. Randolph, and A. Y. L. Chong, “An updated and expanded assessment of PLS-SEM in information systems research,”Ind Manag Data Syst, vol. 117, no. 3, pp. 442–458, 2017.
[22] P. Hallikainen, R. Bekkhus, and S. L. Pan, “How OpusCapita Used Internal RPA Capabilities to Offer Services to Clients,”MIS Q Exec, vol. 17, no. 1, pp. 41–52, 2018.
[23] J. Hartwick and H. Barki, “Explaining the Role of User Participation in Information System Use,”Manage Sci, vol. 40, no. 4, pp. 440–465, 1994.
[24] J. Henseler, G. Hubona, and P. A. Ray, “Using PLS path modeling in new technology research: updated guidelines,” Ind Manag Data Syst, vol. 116, no. 1, pp. 2–20, 2016.
TABLE VI
VARIABLE,TOKEN,QUESTION ITEM,AND REFERENCE.
Variable Token Question item Reference
General questions
GEN Which gender are you? [49], [50]
AGE How old are you? [49], [50]
USE How long have you been using RPA bots? [11]
Social influence
INF1 People who influence my behavior think that I should use RPA bots. [47]–[50]
INF2 People who are important to me recommend me to use RPA bots. [47]–[50]
INF3 The management has advised me to use RPA bots. [47], [49]
Job relevance
REL1 In my job, the usage of RPA bots is important. [47], [48]
REL2 In my job, the usage of RPA bots is relevant. [47], [48]
REL3 My workload could hardly be handled without RPA bots. [47] (adapted)
Result demonstrability
RES1 I have no difficulty telling others about the results of using RPA bots. [47], [48]
RES2 The results of using RPA bots are comprehensible to me. [47], [48]
RES3 I have no difficulty explaining why using RPA bots may or may not be beneficial. [47], [48]
User involvement
INV1 I (or the user group) was involved in the explanation and clarification of the automation needs and objectives. [16] (adapted)
INV2 I (or the user group) was heavily involved in testing RPA bots. [16] (adapted)
INV3 Prior to the implementation, I was informed about new possibilities the automation creates for me. self-developed Trust
TRST1 I trust the RPA bots to behave in a privacy-protecting and tamper-proof manner. [35], [42] (adapted)
TRST2 I accept the results of RPA bots without subsequent checking. self-developed
TRST3 I trust the RPA bots to perform as designed and deliver the desired results without malfunctions. [35] (adapted) Computer self-efficacy
CSE1 I can always manage to solve difficult computer problems if I try hard enough. [25] (adapted) CSE2 I am confident that I can handle unexpected error messages from the computer efficiently. [25] (adapted)
CSE3 I feel confident troubleshooting computer problems. [7]
Innovation joy
JOY1 In general, I am not hesitant to try out new technologies. [1] (adapted)
JOY2 I feel confident and relaxed while trying out new technologies. [31]
JOY3 I am not afraid that my job will be done by computers in the near future. self-developed Facilitating conditions
FAC1 I have the resources necessary to use RPA bots. [49], [50]
FAC2 I have the knowledge necessary to use RPA bots. [49], [50]
FAC3 A specific person (or group) is available for assistance when I have difficulties using RPA bots. [49], [50]
Hedonic motivation
HED1 Using RPA bots is fun. [50]
HED2 Using RPA bots is enjoyable. [50]
HED3 Using RPA bots is entertaining. [50]
Perceived usefulness
PU1 Using RPA bots in my job increases my productivity. [11], [49], [50]
PU2 Using RPA bots enables me to accomplish tasks more quickly. [11], [49], [50]
PU3 Overall, I find RPA bots useful in my job. [11], [49], [50]
Perceived ease of use
PEOU1 I find it easy to get RPA bots to do what I want them to do. [11], [47], [48]
PEOU2 Learning to work with RPA bots is easy for me. [11], [49], [50]
PEOU3 Overall, I find RPA bots easy to use. [11], [47]–[50]
Behavioral intention
BI1 I intend to use RPA bots frequently. [47], [48] (adapted)
BI2 I will always try to use RPA bots if my task are suitable. [50] (adapted)
BI3 I will use RPA bots in the near future. [49] (adapted)
TABLE VII
MEAN,STANDARD DEVIATION, VARIANCEINFLATIONFACTOR, FACTORLOADING, CRONBACH’SALPHA, COMPOSITERELIABILITY,ANDAVERAGE VARIANCEEXTRACTED MEASURES FOR EACH QUESTION ITEM.
Variable Question item Mean Standard deviation Variance Inflation Factor Factor Loading Cronbach’s Alpha Composite Reliability Average Variance Extracted Social influence
INF1 5.560 1.023 1.788 0.839
0.789 0.874 0.699
INF2 5.300 1.136 1.574 0.868
INF3 5.560 1.431 1.660 0.801
Job relevance
REL1 5.460 1.099 1.742 0.911
0.622 0.792 0.581
REL2 5.400 1.217 1.643 0.862
REL3 4.220 1.540 1.088 0.413
Result Demonstrability
RES1 5.940 1.008 2.000 0.881
0.812 0.888 0.727
RES2 5.760 0.971 1.548 0.785
RES3 5.880 0.952 2.052 0.888
User involvement
INV1 5.680 1.434 1.290 0.734
0.519 0.756 0.509
INV2 5.680 1.489 1.254 0.743
INV3 5.680 1.103 1.050 0.660
Trust
TRST1 5.900 1.063 1.141 0.695
0.619 0.797 0.569
TRST2 4.480 1.578 1.308 0.714
TRST3 5.240 1.379 1.404 0.844
Computer self-efficacy
CSE1 4.920 1.339 1.830 0.769
0.801 0.873 0.697
CSE2 4.900 0.964 1.542 0.897
CSE3 4.920 1.036 1.921 0.834
Innovation joy
JOY1 6.120 0.972 2.095 0.909
0.721 0.843 0.649
JOY2 5.580 1.079 1.944 0.872
JOY3 5.300 1.628 1.186 0.600
Facilitating conditions
FAC1 5.940 0.988 1.204 0.784
0.523 0.744 0.511
FAC2 5.940 0.925 1.275 0.861
FAC3 6.080 0.997 1.076 0.422
Hedonic motivation
HED1 5.460 1.135 1.997 0.891
0.651 0.807 0.605
HED2 5.660 0.972 2.004 0.925
HED3 4.500 1.404 1.062 0.406
Perceived usefulness
PU1 5.900 0.943 2.178 0.887
0.830 0.898 0.746
PU2 5.960 1.131 1.845 0.842
PU3 5.980 0.948 1.818 0.861
Perceived ease of use
PEOU1 5.480 1.170 2.041 0.831
0.846 0.906 0.764
PEOU2 5.820 1.161 1.937 0.857
PEOU3 5.740 1.110 2.805 0.931
Behavioral intention
BI1 6.100 0.964 1.549 0.836
0.774 0.869 0.688
BI2 6.000 1.149 1.574 0.824
BI3 6.060 0.947 1.657 0.829