advances.sciencemag.org/cgi/content/full/7/14/eabf5908/DC1
Supplementary Materials for
Deep-sea predator niche segregation revealed by combined cetacean biologging and eDNA analysis of cephalopod prey
F. Visser*, V. J. Merten, T. Bayer, M. G. Oudejans, D. S. W. de Jonge, O. Puebla, T. B. H. Reusch, J. Fuss, H. J. T. Hoving
*Corresponding author. Email: f.visser@uva.nl Published 31 March 2021, Sci. Adv. 7, eabf5908 (2021)
DOI: 10.1126/sciadv.abf5908
This PDF file includes:
Figs. S1 to S3 Tables S1 to S7
Supplementary Methods Supplementary Discussion References
Supplementary Figures and Tables
Supplementary Figure S1. Risso’s dolphin and Cuvier’s beaked whale foraging habitat.
Distance from shore (left) and bottom depth (right) at Risso’s dolphin (Grampus griseus; RD) foraging dive observations and sighting locations of Cuvier’s beaked whale (Ziphius cavirostris;
CBW). Data represent group means.
Supplementary Figure S2. Presence of cephalopod taxa preyed upon by one or both cetacean predators in their respective foraging zones. In total 35 cephalopod taxa (at taxonomic level of family or lower) were detected in the foraging zones for Risso’s dolphins (Grampus griseus; RD) and Cuvier’s beaked whales (Ziphius cavirostris; CBW) of which seven were only found in CBW zone, 15 were only found in RD zone and 13 taxa were found in both foraging zones.
Supplementary Figure S3. Species accumulation curves of cephalopod eDNA taxa detections for Risso’s dolphin and Cuvier’s beaked whale foraging habitats. In total, 30 cephalopod taxa were detected in Risso’s dolphin (Grampus griseus; RD) habitat (4 CTD casts) and the curve illustrates the nearing of the asymptote. In Cuvier’s beaked whale (Ziphius cavirostris; CBW) habitat (2 CTD casts), 26 taxa were detected. Based on the Risso’s dolphin habitat curve, a relatively small number of additional taxa (1-3 per cast), at relatively low eDNA density, is expected to be discovered with additional CTD casts.
Supplementary Table S1. Risso’s dolphin (Grampus griseus) and Cuvier’s beaked whale (Ziphius cavirostris) tag data record summary. Tag attachment and foraging dive
characteristics of individuals tagged off Terceira Island, Azores. Ind. = individual. Dur = dive duration. Max. = maximum. Dive types performed: mesopelagic (MESO) and shallow (SH) by Risso’s dolphin, Deep-Wide (DW) and Deep-Layer-Restricted (DLR) by Cuvier’s beaked whale.
Ind. Tag ID Date Local Time
Dur (h)
# Foraging Dives Max. depth (m)
# buzzes
Risso’s dolphin total MESO/SH MESO / SH
1 gg13_238a 26-8-2013 16:12 5.7 5 2/3 496/159 19
1 gg17_203a 22-7-2017 12:33 9.3 20 20/0 564/- 274
2 gg15_229a 17-8-2015 9:41 16.7 40 10/30 571/307 262
3 gg15_229c 17-8-2015 13:53 11.0 18 0 /18 -/413 133
4 gg16_169a 17-6-2016 14:12 4.9 11 8/3 249/559 62
5 gg16_171a 19-6-2016 8:51 11.7 4 4/0 623/- 16
6 gg17_200a 19-7-2017 11:04 15.9 26 25/1 534/146 267
7 gg18_214a 2-8-2018 15:37 10.3 21 6/15 364/244 155
Cuvier’s beaked whale DLR / DW DLR / DW
1 zc15_205a 24-7-2015 14:38 24.7 9 6/3 1138/1756 318
1 zc15_212a 31-7-2015 8:45 11.8 6 1/5 911/1625 237
2 zc15_212b 31-7-2015 8:46 12.3 5 0/5 -/1715 189
1 zc17_205a 24-7-2017 16:28 24.7 11 1/10 1092/1764 471
3 zc17_227a 15-8-2017 10:21 18.1 7 1/6 1067/1536 168
4 zc18_185a 4-7-2018 11:19 23.5 8 3/5 1101/1428 250
5 zc19_196a 15-7-2019 13:39 12.1 7 0/7 -/1605 220
6 zc19_197a 16-7-2019 16:26 23.5 7 0/7 -/1782 215
Total - Risso’s dolphin 85.5 145 75/70 1188
Total – Cuvier’s beaked whale 150.5 60 12/48 2068
Supplementary Table S2. Cuvier’s beaked whale (Ziphius cavirostris; CBW) and Risso’s dolphin (Grampus griseus; RD) Hidden Markov Model (HMM) dive type classification results. HMM classification of dive types based on maximum dive depth and width of the within- dive foraging zone (SD of buzz depth; CBW) and maximum dive depth (RD).
HMM SELECTION
Cuvier’s beaked whale Risso’s dolphin
AIC AIC
3 states 1430.095 BEST MODEL 2 states 1731.197 BEST MODEL
4 states 1436.223 3 states 1746.782
2 states 1439.224 4 states 1757.948
1 state 1530.692 1 state 1801.410
HMM SUMMARY - 3 STATES HMM SUMMARY - 2 STATES
Maximum depth State 1 State 2 State 3 State 1 State 2
Mean 1042.7 1299.1 1608.8 204.1 508.1
SD 66.1 148.8 109.2 81.1 51.8
SD Buzz depth (m)
Mean 37.0 112.5 203.3
SD 10.7 41.6 37.3
Supplementary Table S3. Summary of CTD sampling records off Terceira Island, Azores.
Total number of samples obtained from a specific depth combining all sampling locations in Risso’s dolphin (RD; Grampus griseus) foraging habitat (4 CTD casts; maximum bottom depth 800 m) and Cuvier’s beaked whale (CBW; Ziphius cavirostris) foraging habitat (2 CTD casts;
maximum bottom depth 1600 m). Each sample consisted of three biological replicates.
Depth (m) RD foraging habitat
4 casts
CBW foraging habitat 2 casts
50 4 -
100 4 -
200 4 2
300 4 -
400 4 -
500 4 2
600 4 -
800 1 2
1100 - 1150 2
1150 - 1200 2
1250 - 1400 2
1475 - 1500 2
1550 - 1600 2
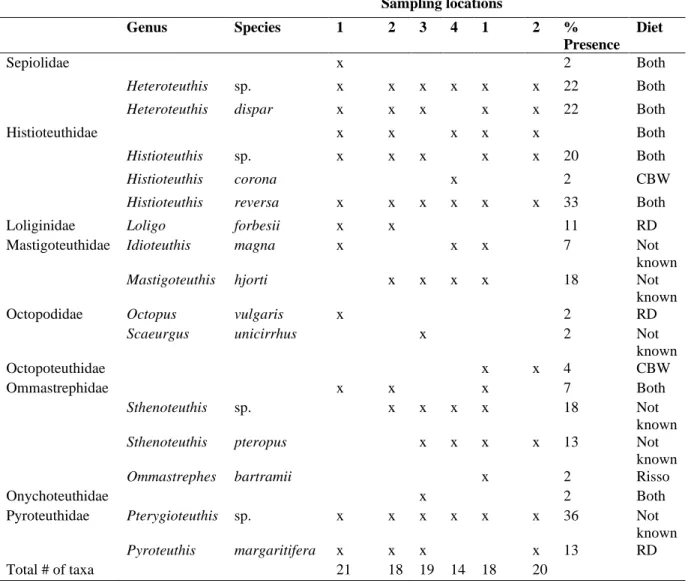
Supplementary Table S4. Cephalopod taxa detected using eDNA analysis in the foraging habitat of Risso’s dolphins (Grampus griseus, RD) and Cuvier’s beaked whales (Ziphius cavirostris, CBW) off Terceira Island, Azores. eDNA metabarcoding with two universal
cephalopod primer pairs resulted in the detection of 39 cephalopod taxa. In total 29 and 16 sampling records were analyzed from respectively 4 and 2 casts in RD and CBW habitat. ”x”
indicates presence. % Presence: % of sampling records in which the species was detected. Diet:
species previously recorded in the diet of RD, CBW or both, or not known from diet records. Diet data was derived from literature (stomach content analysis; Tables S5 and S6). eDNA records were identified to the nearest possible taxonomic level.
RD habitat CBW habitat Sampling locations
Genus Species 1 2 3 4 1 2 %
Presence Diet Class
Cephalopoda x x 4 Both
Order
Teuthida x x x x x x 64 Both
Family
Architeuthidae x 2 Not known
Alloposidae Haliphron atlanticus x x x x 13 CBW
Chtenopterygidae Chtenopteryx sp. x 2 Both
Chtenopteryx sicula x 2 Both
Chiroteuthidae Chiroteuthis sp. x 2 Both
Chiroteuthis mega x 2 Not known
Grimalditeuthidae Grimalditeuthis bonplandi x 2 Not known
Planctoteuthis levimana x 2 Not known
Cranchiidae Bathothauma lyromma x 2 Not known
Liocranchia reinhardti x x x x x x 38 CBW
Leachia sp. x 2 Not known
Taonius pavo x 2 CBW
Cycloteuthidae Cycloteuthis sirventi x 2 CBW
Enoploteuthidae Abralia redfieldi x x x x x x 33 Not known
Abraliopsis atlantica x x x 7 Not known
Abraliopsis sp. x 2 RD
Enoploteuthis leptura x x x x x x 60 Not known
Table S4 – Continued
RD habitat CBW habitat
Sampling locations
Genus Species 1 2 3 4 1 2 %
Presence Diet
Sepiolidae x 2 Both
Heteroteuthis sp. x x x x x x 22 Both
Heteroteuthis dispar x x x x x 22 Both
Histioteuthidae x x x x x Both
Histioteuthis sp. x x x x x 20 Both
Histioteuthis corona x 2 CBW
Histioteuthis reversa x x x x x x 33 Both
Loliginidae Loligo forbesii x x 11 RD
Mastigoteuthidae Idioteuthis magna x x x 7 Not
known
Mastigoteuthis hjorti x x x x 18 Not
known
Octopodidae Octopus vulgaris x 2 RD
Scaeurgus unicirrhus x 2 Not
known
Octopoteuthidae x x 4 CBW
Ommastrephidae x x x 7 Both
Sthenoteuthis sp. x x x x 18 Not
known
Sthenoteuthis pteropus x x x x 13 Not
known
Ommastrephes bartramii x 2 Risso
Onychoteuthidae x 2 Both
Pyroteuthidae Pterygioteuthis sp. x x x x x x 36 Not
known
Pyroteuthis margaritifera x x x x 13 RD
Total # of taxa 21 18 19 14 18 20
Supplementary Table S5. Presence and contribution of cephalopods in the diet of Risso’s dolphin (Grampus griseus) in the North Atlantic Ocean and the Mediterranean Sea.
Contribution indicated as % of individuals (N) and % biomass (B). Locations: MED =
Mediterranean Sea, LIG = Ligurian Sea, AEG = North Aegean Sea, CEL = Celtic Sea, NEA = North-East Atlantic, NOR = Norwegian Sea. Diet data from supplementary references (64–69).
MED LIG AEG CEL NEA NOR Source
Family N/B N/B N/B N/B N/B N/B
Ancistrocheiridae 2.2 (64)
Argonautidae 45.5 0.8/2.98 (64, 67)
Brachioteuthidae 1.2 0.8/2.05 (64, 67)
Chiroteuthidae 0.4 (64)
Cranchiidae 0.7
0.3
(64)
Eledonidae 1.8 38/55 67.9/56.9 (64–66)
Enoploteuthidae 1.1 (64)
Histioteuthidae 8.4 5.1 60.9
3.6/1.2 78/80.6
29.6/61.4 5 14.4/33.5
2
(64, 67–
69)
Loliginidae 0.3 7/8 7.9/19.5 (64–66)
Mastigoteuthidae 3.9 (64)
Octopodidae 0.3
0.1 0.7
(64)
Ocythoidae 1.5 (64)
Ommastrephidae 5.3
0.5 6.2 2.6
7.3/13.2 5/5
21/19
0.2/0.1 0.2/0.1
(64–66, 69)
Onychoteuthidae 7.3 3.5
9.1/4.9 (64, 69)
Sepiidae 0.7 28/13 85.7/94.6 (64, 66,
70)
Sepiolidae 0.3
0.3 1.8/0.04
(64, 69)
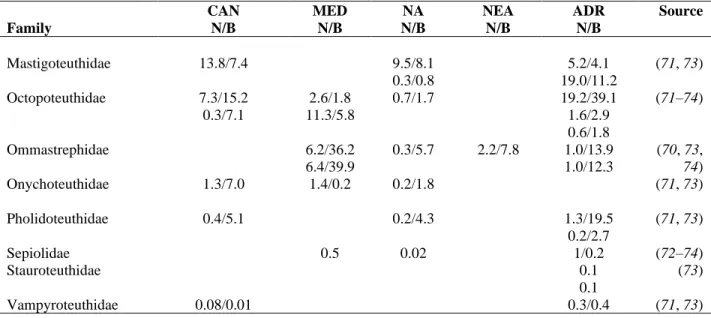
Supplementary Table S6. Presence and contribution of cephalopods in the diet of Cuvier’s beaked whale (Ziphius cavirostris) in the North Atlantic Ocean and the Mediterranean Sea. Contribution indicated as % of individuals (N) and % biomass (B). Locations: CAN = Canary Islands, MED = Mediterranean Sea, NA = North Atlantic, NEA = North-East Atlantic, ADR = Adriatic Sea. Diet data derived from supplementary references (70–74).
CAN MED NA NEA ADR Source
Family N/B N/B N/B N/B N/B
Alloposidae 10/10 (71)
Amphitretidae 0.02 (73)
Ancistrocheiridae 0.08/0.3 3.4/0.6
2.1/0.2
(71, 74)
Bathyteuthidae 0.01 (74)
Brachioteuthidae 0.3/0.02 1.2/0.1 0.3/0.03 (70, 73)
Chiroteuthidae 5.1/3.0 1.8/0.6
16.3/5.4
2.4/1.9 48.5/17.7
2.53/1.1 3.3/1.3
(71–74)
Chtenopterygidae 5.5/0.5
12.8/1.1
0.2/0.05 (73, 74)
Cranchiidae 2.5/2.4
9.4/1.3 24.8/3.1
1.3/2.1 24.3/10.9
5.92/2.4
9.5/7.2 0.04 0.3/0.8 10.8/9.4 22.2/13.9
9.5/8 1.6/1.4 1.4/1.2 26.6/22.7
9.1/8 1/0.2 4.9/3.7 48.9/4.3 17.2/9.7 35.5/24.8
(70–74)
Cycloteuthidae 0.3/2.1
0.4/1.0
0.04/0.4 0.1/0.7
0.4
(73, 74)
Gonatidae 11.2/26.3 2.6/7.6 4.6/9.0
3.56/5.8
(70, 73)
Histioteuthidae 0.8/6.6
1.7/1.2 14.7/7.3
5.0/9.6
7.5/34.6 12.1/40 63.1/24.4
12.8/4.3
0.4/2.9 1.5/5.3 0.4/0.8 4.3/2.2
2.1/4.4 32.6/26.6
9.1/14.6 12.1/20.1
0.9/1.7 0.3/0.4 27.6/15.8
0.4/0.5 0.4/2.1 0.1/0.1 3.03/1.2
(70–74)
Table S6 – Continued
CAN MED NA NEA ADR Source
Family N/B N/B N/B N/B N/B
Mastigoteuthidae 13.8/7.4 9.5/8.1
0.3/0.8
5.2/4.1 19.0/11.2
(71, 73) Octopoteuthidae 7.3/15.2
0.3/7.1
2.6/1.8 11.3/5.8
0.7/1.7 19.2/39.1
1.6/2.9 0.6/1.8
(71–74)
Ommastrephidae 6.2/36.2
6.4/39.9
0.3/5.7 2.2/7.8 1.0/13.9 1.0/12.3
(70, 73, 74)
Onychoteuthidae 1.3/7.0 1.4/0.2 0.2/1.8 (71, 73)
Pholidoteuthidae 0.4/5.1 0.2/4.3 1.3/19.5
0.2/2.7
(71, 73)
Sepiolidae 0.5 0.02 1/0.2 (72–74)
Stauroteuthidae 0.1
0.1
(73)
Vampyroteuthidae 0.08/0.01 0.3/0.4 (71, 73)
Supplementary Table S7. Overview of bioinformatic analysis of eDNA samples taken off Terceira Island, Azores. Number of sequencing reads kept for CephMLS targeting the mitochondrial 16S rRNA gene and Ceph18S targeting the nuclear 18S rRNA gene cephalopod primer pairs after each bioinformatic analysis step.
Ceph18S CephMLS:16S
Bioinformatic analysis step N Reads Sequence variants
N Reads Sequence variants Sequencing reads from MiSeq run 5409847 4462367
Quality filtering and trimming 2076862 4174222
Merging of paired-end reads 2002720 4081555
Removing of chimeras 1912785 2300 4003315 977
Remove sequences below e < 1e-20
409 123
Removal of unassigned sequence variants
230 88
Removal of non-cephalopod SV 219 51
Supplementary Methods – eDNA Processing
Contamination reduction measurements
To prevent contamination, single-capped PCR-tubes, single-use consumables and disposable gloves were used and sampling devices, laboratory equipment and surfaces were cleaned with 50% bleach regularly. eDNA extractions, pre- and post-PCRs were physically separated.
DNA extractions
Each filter was cleaned with 50% bleach from the outside to remove any DNA contamination.
720 µl ATL-buffer and 80 µl proteinase K were added directly into the filter with 5 ml single-use syringes. The filters were incubated for at least 2 hours at 56 °C with agitation. After incubation, the buffer mix from inside the filter was transferred to a sterile 2 ml Eppendorf tube using 5 ml syringes. From each sample, 600 µl was pipetted to a new 2 ml Eppendorf tube to obtain equal volumes for all samples. After adding 600 µl AL-Buffer and 600 µl 99% ethanol high grade, the normal DNeasy Blood and Tissue protocol was used. DNA was diluted in 2x 25 µl AE-Buffer from the kit.
Metabarcoding PCRs - Controls, replicates and sequencing
For the CephMLS primer, tissue-derived DNA from three cephalopod species that do not occur in the central Atlantic: Alloteuthis media, Pareledone sp. and Megaleledone setebos and a mock community control including 3 ng/µl of each cephalopod species mentioned above have been used. The same were used for the Ceph18S primer, but after the first PCR it was noted that the positive controls did not work well with the Ceph18S primer pair according to a gel picture. Four extra positive controls were added for samples processed with the Ceph18S primer pair:
Bathyteuthis abyssicola, Mastigopsis hjorti and Histioteuthis reversa, and a mock community
control with these three species (~3 ng/μl per species).
These species do occur in the Azores area, but because they were added to the samples after the first PCR the possibility of contamination was minimal. Final concentrations of the positive controls were measured with a Qubit fluorometer and ranged between 10 – 19 ng/µl.
Negative controls included filtration blanks with MilliQ, extraction blanks and PCR negative controls. In eight extraction blanks, one filtration blank and five PCR blanks (including replicates) from 30 blanks in total, contamination was found ranging from 11 to 16,188 reads. The positive controls worked on all plates, except on one plate processed with the primer CephMLS. This plate including all samples was excluded from further analysis. Of all detected taxa, 47% were found in PCR duplicate and 60% in biological replicates. This is consistent with other studies (75),
showing that a large percentage of operational taxonomic units or sequence variants is only found in one of the biological replicates.
The two sequencing runs of all 313 samples (incl. positive controls, blanks and replicates) produced 5,409,847 and 4,462,367 input reads for Ceph18S and CephMLS, respectively. After DADA2 analysis, 1,912,785 and 4,003,315 output reads were obtained resulting in 2,327 and 978 sequence variants for Ceph18S and CephMLS, respectively. Sequences were only kept when they could be aligned to at least order level resulting in 241 and 54 sequence variants for Ceph18S and CephMLS, respectively, that were discarded. After discarding all sequence variants with less than ten reads, 282 assigned sequence variants were retained. The mean (SD) sequencing depth across samples was 3726.13+/- 16161.73.
Bioinformatic analysis with IDTAXA
The taxonomic assignment of the environmental samples and all controls against the training set was performed by IDTAXA with the R package DECIPHER version 2.6.0. The confidence threshold for accepting a classification was set to the default of 60% which is a very high
confidence and provides a conservative classification with relatively few misclassifications and over classifications. In addition to the IDTAXA algorithm, we applied the BLAST classifier which assigns a sequence based on its nearest neighbor in a training set. Sequences were searched against the NCBI nucleotide (nt) database (retrieved in June 2020) using the blastn program. Due to the reasons stated above, IDTAXA was used as baseline analysis. Differing taxonomic
assignments made by BLAST resulting in higher taxonomic level classifications compared to IDTAXA where checked and added to the final results when they met the following criteria: a) 100% match of the whole query sequence against the reference sequence with no other species with 100% match: accepted at species level, b) 97-99% match of the query sequence against the reference sequence accepted at genus level, c) 95 – 97% match of the query sequence against the reference sequence: accepted at family level.
Several sequence variants occurring in one sample but assigning to the same species were combined and the total number of reads and the number of merged sequence variants were kept.
Sequence variants with less than ten reads were removed to reduce the possibility of
contamination or sequencing error. All species found in the negative controls were removed from the corresponding plates. That is, all taxa found in the PCR negative control were removed from the corresponding plate and taxa found in the filtration and extraction blanks were removed from the corresponding batch of samples that were filtered or extracted together with that control.
Supplementary Discussion – eDNA analysis
The need for replication in eDNA studies is related to the patchy distribution of eDNA and PCR stochasticity (76). False positives may originate from contamination (either from the field, lab or cross-contamination between samples or the positive controls) or from sequences being assigned to the wrong taxa. This may result from the limited number of sequences available in Genbank which are sometimes associated with a wrongly identified taxa. Alternatively, one gene may not be sufficient to differentiate between closely related species. False negatives may occur when species are known to occur in the region and are abundant prey in cetacean diets but were not detected by eDNA. Examples are Taningia danae and Ancistrocheirus lesueurii (77, 78). The fact that these two species have not been found with eDNA in this study may be a consequence of an insufficient reference database, as T. danae and A. lesueurii sequences are not well represented in GenBank, but are known from sperm whales hunting off the Azores. Other possibilities for false negatives are patchiness of eDNA, insufficient primer specificity for certain taxa, PCR
stochasticity and also species-specific eDNA shedding rates. Taningia danae is a very large squid (78) and one would expect enough eDNA to be present for detection. The same question arises for Architeuthis, the longest squid species on earth, which was not found frequently in our eDNA
data. However, previous studies show that the size of an animal does not always reflect the amount of eDNA that is being shed (79). Our findings confirm that replication as well as positive and negative controls are indispensable for obtaining a representative number of species in a sampled water (75). Several factors such as weather conditions, temperature, behavior, body size, age, density, habitat use and skin texture together with varying oceanographic properties
influence the production and degradation of eDNA. Therefore, detection rates with eDNA may be species-specific.
REFERENCES AND NOTES
1. R. Danovaro, C. Gambi, A. Dell’Anno, C. Corinaldesi, S. Fraschetti, A. Vanreusel, M. Vincx, A. J.
Gooday, Exponential decline of deep-sea ecosystem functioning linked to benthic biodiversity loss.
Curr. Biol. 18, 1–8 (2008).
2. E. Ramirez-Llodra, A. Brandt, R. Danovaro, B. De Mol, E. Escobar, C. R. German, L. A. Levin, P.
Martinez Arbizu, L. Menot, P. Buhl-Mortensen, B. E. Narayanaswamy, C. R. Smith, D. P. Tittensor, P. A. Tyler, A. Vanreusel, M. Vecchione, Deep, diverse and definitely different: Unique attributes of the world’s largest ecosystem. Biogeosciences. 7, 2851–2899 (2010).
3. R. Danovaro, E. Fanelli, J. Aguzzi, D. Billett, L. Carugati, C. Corinaldesi, A. Dell’Anno, K. Gjerde, A. J. Jamieson, S. Kark, C. M. Clain, L. Levin, N. Levin, E. Ramirez-Llodra, H. Ruhl, C. R. Smith, P. V. R. Snelgrove, L. Thomsen, C. L. Van Dover, M. Yasuhara, Ecological variables for developing a global deep-ocean monitoring and conservation strategy. Nat. Ecol. Evol. 4, 181–192 (2020).
4. P. L. Tyack, M. Johnson, N. A. Soto, A. Sturlese, P. T. Madsen, Extreme diving of beaked whales. J.
Exp. Biol. 209, 4238–4253 (2006).
5. S. L. Watwood, P. J. O. Miller, M. Johnson, P. T. Madsen, P. L. Tyack, Deep-diving foraging behaviour of sperm whales (Physeter macrocephalus). J. Anim. Ecol. 75, 814–825 (2006).
6. P. Arranz, K. J. Benoit-Bird, B. L. Southall, J. Calambokidis, A. S. Friedlaender, P. L. Tyack, Risso’s dolphins plan foraging dives. J. Exp. Biol. 221, jeb165209 (2018).
7. M. R. Clarke, Cephalopods as prey. III. Cetaceans, Philos. Trans. Biol. Sci. 351, 1053–1065 (1996).
8. M. R. Heithaus, A. Frid, A. J. Wirsing, B. Worm, Predicting ecological consequences of marine top predator declines. Trends Ecol. Evol. 23, 202–210 (2008).
9. K. J. Benoit-Bird, B. L. Southall, M. A. Moline, Predator-guided sampling reveals biotic structure in the bathypelagic. Proc. R. Soc. B Biol. Sci. 283, 20152457 (2016).
10. M. Johnson, P. T. Madsen, W. M. X. Zimmer, N. Aguilar de Soto, P. L. Tyack, Beaked whales echolocate on prey. Proc. R. Soc. Lond. B Biol. Sci. 271, S383–S386 (2004).
11. G. L. Kooyman, Diving physiology, in Enzyclopedia of Marine Mammals, W. F. Perrin, B. Würsig, J. G. M. Thewissen, Eds. (Elsevier, 2009), pp. 327–332.
12. D. Thompson, M. A. Fedak, How long should a dive last? A simple model of foraging decisions by breath-hold divers in a patchy environment. Anim. Behav. 61, 287–296 (2001).
13. E. L. Hazen, A. S. Friedlaender, J. A. Goldbogen, Blue whales (Balaenoptera musculus) optimize foraging efficiency by balancing oxygen use and energy gain as a function of prey density. Sci. Adv.
1, e1500469 (2015).
14. P. R. Boyle, P. Rodhouse, Oceanic and deep-sea species, in Cephalopods: Ecology and Fisheries (Blackwell Science, 2005), pp. 176–204.
15. V. V. Laptikhovsky, H. Fock, U. Piatkowski, R. Schwarz, H. J. T. Hoving, Reproductive strategies of deep-sea squid (Mastigoteuthidae, Chiroteuthidae, Batoteuthidae and Cranchiidae). Mar. Biol.
166, 85 (2019).
16. H. J. T. Hoving, J. A. A. Perez, K. S. R. Bolstad, H. E. Braid, A. B. Evans, D. Fuchs, H. Judkins, J.
T. Kelly, J. E. A. R. Marian, R. Nakajima, U. Piatkowski, A. Reid, M. Vecchione, J. C. C. Xavier, The Study of Deep-Sea Cephalopods (Advances in Marine Biology, 2014), vol. 67;
https://linkinghub.elsevier.com/retrieve/pii/B9780128002872000032.
17. J. H. Wormuth, C. F. E. Roper, Quantitative sampling of oceanic cephalopods by nets: Problems and recommendations. Biol. Oceanogr. 2, 357–377 (1983).
18. K. M. Ruppert, R. J. Kline, M. S. Rahman, Past, present, and future perspectives of environmental DNA (eDNA) metabarcoding: A systematic review in methods, monitoring, and applications of global eDNA. Glob. Ecol. Conserv. 17, e00547 (2019).
19. P. F. Thomsen, P. R. Møller, E. E. Sigsgaard, S. W. Knudsen, O. A. Jørgensen, E. Willerslev, Environmental DNA from seawater samples correlate with trawl catches of subarctic, deepwater fishes. PLOS ONE 11, e0165252 (2016).
20. E. E. Sigsgaard, I. B. Nielsen, S. S. Bach, E. D. Lorenzen, D. P. Robinson, S. W. Knudsen, M. W.
Pedersen, M. A. Jaidah, L. Orlando, E. Willerslev, P. R. Møller, P. F. Thomsen, Population
characteristics of a large whale shark aggregation inferred from seawater environmental DNA. Nat.
Ecol. Evol. 1, 0004 (2017).
21. K. J. Benoit-Bird, B. L. Southall, M. A. Moline, Dynamic foraging in Risso’s dolphins revealed in 4- dimensions. Mar. Ecol. Prog. Ser. 632, 10.3354/meps13157 (2019).
22. G. S. Schorr, E. A. Falcone, D. J. Moretti, R. D. Andrews, First long-term behavioral records from Cuvier’s beaked whales (Ziphius cavirostris) reveal record-breaking dives. PLOS ONE 9, e92633 (2014).
23. J. Barlow, G. S. Schorr, E. A. Falcone, D. J. Moretti, Variation in dive behavior of Cuvier’s beaked whales with seafloor depth, time-of-day, and lunar illumination. Mar. Ecol. Prog. Ser. 644, 199–214 (2020).
24. M. P. Johnson, P. L. Tyack, A digital acoustic recording tag for measuring the response of wild marine mammals to sound. IEEE J. Ocean. Eng. 28, 3–12 (2003).
25. I. Cascão, R. Domokos, M. O. Lammers, R. S. Santos, M. A. Silva, Seamount effects on the diel vertical migration and spatial structure of micronekton. Prog. Oceanogr. 175, 1–13 (2019).
26. D. C. B. Miller, P. A. Wheeler, Biological Oceanography (Wiley-Backwell, ed. 2, 2012).
27. A. I. Arkhipkin, H. Bjørke, Ontogenetic changes in morphometric and reproductive indices of the squid Gonatus fabricii (Oegopsida, Gonatidae) in the Norwegian Sea. Polar Biol. 22, 357–365 (1999).
28. S. H. Shane, Relationship between pilot whales and Risso’s dolphins at Santa Catalina Island, California, USA. Mar. Ecol. Prog. Ser. 123, 5–11 (1995).
29. K. L. Hartman, F. Visser, A. J. E. Hendriks, Social structure of Risso’s dolphins (Grampus griseus) at the Azores: A stratified community based on highly associated social units. Can. J. Zool. 86, 294–
306 (2008).
30. N. Aguilar de Soto, F. Visser, P. L. Tyack, J. Alcazar, G. Ruxton, P. Arranz, P. T. Madsen, M.
Johnson, Fear of killer whales drives extreme synchrony in deep diving beaked whales. Sci. Rep. 10, 13 (2020).
31. C. Carbone, A. I. Houston, The optimal allocation of time over the dive cycle: An approach based on aerobic and anaerobic respiration. Anim. Behav. 51, 1247–1255 (1996).
32. M. R. Clarke, Oceanic cephalopod distribution and species diversity in the eastern North Atlantic.
Arquipél. Life Mar. Sci. 23A, 27–46 (2006).
33. P. Jereb, C. F. E. Roper, Cephalopods of the world. An annotated and illustrated catalogue of cephalopod species known to date. FAO Species Cat. Fish. Purp. 2, 605 (2010).
34. C. F. E. Roper, R. E. Young, Vertical Distribution of Pelagic Cephalopods (Smithsonian Contributions to Zoology, Smithsonian Institution Press, 1975);
https://doi.org/10.5479/si.00810282.209.
35. B. A. Seibel, B. H. Robison, S. H. D. Haddock, Post-spawning egg care by a squid. Nature 438, 929 (2005).
36. A. Quetglas, A. de Mesa, F. Ordines, A. Grau, Life history of the deep-sea cephalopod family Histioteuthidae in the western Mediterranean. Deep Sea Res. Part Oceanogr. Res. Pap. 57, 999–
1008 (2010).
37. H. J. T. Hoving, M. Vecchione, Mating behavior of a deep-sea squid revealed by in situ videography and the study of archived specimens. Biol. Bull. 223, 263–267 (2012).
38. K. E. Carpenter, N. De angelis, Eds. The Living Marine Resources of the Eastern Central Atlantic.
FAO Species Identification Guide for Fishery Purposes, vol. 1 (FAO, Rome, 2014), pp. 1–663.
39. T. Wada, H. Doi, D. Togaki, R. Kaida, M. Nagano, I. Katano, M. Suzuki, T. Ohtani, H. Mitsuhashi, Exploring a legendary giant squid: An environmental DNA approach. Mar. Biol. 167, 160 (2020).
40. F. M. Porteiro, The present status of the squid fishery (Loligo forbesi) in the Azores archipelago.
Fish. Res. 21, 243–253 (1994).
41. M. J. Cruz, V. L. Jordao, J. G. Pereira, R. S. Santos, M. A. Silva, Risso’s dolphin depredation in the Azorean hand-jig squid fishery: Assessing the impacts and evaluating effectiveness of acoustic deterrents. ICES J. Mar. Sci. 71, 2608–2620 (2014).
42. C. E. Doughty, J. Roman, S. Faurby, A. Wolf, A. Haque, E. S. Bakker, Y. Malhi, J. B. Dunning, J.- C. Svenning, Global nutrient transport in a world of giants. Proc. Natl. Acad. Sci. 113, 868–873 (2016).
43. A. M. de Roos, L. Persson, Population and Community Ecology of Ontogenetic Development (Monographs in Population Biology, Princeton Univ. Press, 2013).
44. H. J. T. Hoving, S. L. Bush, S. H. D. Haddock, B. H. Robison, Bathyal feasting: Post-spawning squid as a source of carbon for deep-sea benthic communities. Proc. R. Soc. B Biol. Sci. 284, 20172096 (2017).
45. A. I. Arkhipkin, Squid as nutrient vectors linking Southwest Atlantic marine ecosystems. Deep Sea Res. Part II Top. Stud. Oceanogr. 95, 7–20 (2013).
46. B. L. Southall, K. J. Benoit-Bird, M. A. Moline, D. Moretti, Quantifying deep-sea predator–prey dynamics: Implications of biological heterogeneity for beaked whale conservation. J. Appl. Ecol. 56, 1040–1049 (2019).
47. K. J. Benoit-Bird, B. L. Southall, M. A. Moline, D. E. Claridge, C. A. Dunn, K. A. Dolan, D. J.
Moretti, Critical threshold identified in the functional relationship between beaked whales and their prey. Mar. Ecol. Prog. Ser. 654, 1–16 (2020).
48. F. Visser, P. J. O. Miller, R. N. Antunes, M. G. Oudejans, M. L. Mackenzie, K. Aoki, F. P. A. Lam, P. H. Kvadsheim, J. Huisman, P. L. Tyack, The social context of individual foraging behaviour in long-finned pilot whales (Globicephala melas). Behaviour 151, 1453–1477 (2014).
49. E. Kniest, Visual Detection and Ranging (VADAR), version 1.45.06 (Univ. Newctle. Callaghan Aust., 2012).
50. EMODnet Bathymetry Consortium, EMODnet Digital Bathymetry (EMODnet Bathymetry Consort., 2016); https://doi.org/10.12770/c7b53704-999d-4721-b1a3-04ec60c87238.
51. QGIS.org, 2020. QGIS Geographic Information System. QGIS Association. http://www.qgis.org.
52. P. Arranz, S. L. DeRuiter, A. K. Stimpert, S. Neves, A. S. Friedlaender, J. A. Goldbogen, F. Visser, J. Calambokidis, B. L. Southall, P. L. Tyack, Discrimination of fast click-series produced by tagged Risso’s dolphins (Grampus griseus) for echolocation or communication. J. Exp. Biol. 219, 2898–
2907 (2016).
53. W. M. X. Zimmer, M. P. Johnson, P. T. Madsen, P. L. Tyack, Echolocation clicks of free-ranging Cuvier’s beaked whales (Ziphius cavirostris). J. Acoust. Soc. Am. 117, 3919–3927 (2005).
54. B. T. McClintock, T. Michelot, momentuHMM: R package for generalized hidden Markov models of animal movement. Methods Ecol. Evol. 9, 1518–1530 (2018).
55. R Core Team, R: A Language and Environment for Statistical Computing (R Foundation for Statistical Computing, 2018); www.R-project.org/.
56. P. Arranz, N. A. de Soto, P. T. Madsen, A. Brito, F. Bordes, M. Johnson, Following a foraging fish- finder: Diel habitat use of Blainville’s beaked whales revealed by echolocation. PLOS ONE 6, e28353 (2011).
57. L. Breiman, Random forests. Mach. Learn. 45, 5–32 (2001).
58. D. S. W. de Jonge, V. Merten, T. Bayer, O. Puebla, T. B. H. Reusch, H.-J. T. Hoving, A novel metabarcoding primer pair for environmental DNA analysis of Cephalopoda (Mollusca) targeting the nuclear 18S rRNA region. R. Soc. Open Sci. 8, 201388 (2021).
59. S. N. Jarman, K. S. Redd, N. J. Gales, Group-specific primers for amplifying DNA sequences that identify Amphipoda, Cephalopoda, Echinodermata, Gastropoda, Isopoda, Ostracoda and Thoracica.
Mol. Ecol. Notes. 6, 268–271 (2006).
60. M. Leray, S.-L. Ho, I.-J. Lin, R. J. Machida, MIDORI server: A webserver for taxonomic assignment of unknown metazoan mitochondrial-encoded sequences using a curated database.
Bioinformatics 34, 3753–3754 (2018).
61. B. J. Callahan, P. J. McMurdie, M. J. Rosen, A. W. Han, A. J. A. Johnson, S. P. Holmes, DADA2:
High-resolution sample inference from Illumina amplicon data. Nat. Methods 13, 581–583 (2016).
62. A. Murali, A. Bhargava, E. S. Wright, IDTAXA: A novel approach for accurate taxonomic classification of microbiome sequences. Microbiome. 6, 140 (2018).
63. R. E. Young, Vertical distribution and photosensitive vesicles of pelagic cephalopods from Hawaiian Waters. Fish. Bull. 76, 583–615 (1978).
64. A. Evans, “A systematic review of the squid family Cranchiidae (Cephalopoda: Oegopsida) in the Pacific Ocean,” thesis, Auckland University of Technology, Auckland, New Zealand (2018).
65. C. Blanco, M. Á. Raduán, J. A. Raga, Diet of Risso’s dolphin (Grampus griseus) in the western Mediterranean Sea. Sci. Mar. 70, 407–411 (2006).
66. D. Bloch, Life history of Risso’s dolphin (Grampus griseus) (G. Cuvier, 1812) in the Faroe Islands.
Aquat. Mamm. 38, 250–266 (2012).
67. M. R. Clarke, P. L. Pascoe, The stomach contents of a Risso’s dolphin (Grampus griseus) stranded at Thurlestone, South Devon. J. Mar. Biol. Assoc. U. K. 65, 663–665 (1985).
68. C. B. Milani, A. Vella, P. Vidoris, A. Christidis, E. Koutrakis, A. Frantzis, A. Miliou, A.
Kallianiotis, Cetacean stranding and diet analyses in the North Aegean Sea (Greece). J. Mar. Biol.
Assoc. U. K. 98, 1011–1028 (2018).
69. B. Oztürk, A. Salman, A. A. Öztürk, A. Tonay, Cephalopod remains in the diet of stripped dolphins (Stenella coeruleoalba) and Risso’s dolphins (Grampus griseus) in the eastern Mediteranean. Vie Milieu - Life Environ. 57, 53–59 (2007).
70. M. Würtz, R. Poggi, M. R. Clarke, Cephalopods from the stomachs of a Risso’s dolphin (Grampus griseus) from the Mediterranean. J. Mar. Biol. Assoc. UK 72, 861–867 (1992).
71. J. Spitz, Y. Cherel, S. Bertin, J. Kiszka, A. Dewez, V. Ridoux, Prey preferences among the
community of deep-diving odontocetes from the Bay of Biscay, Northeast Atlantic. Deep Sea Res.
Part Oceanogr. Res. Pap. 58, 273–282 (2011).
72. C. Blanco, J. A. Raga, Cephalopod prey of two Ziphius cavirostris (Cetacea) stranded on the western Mediterranean coast. J. Mar. Biol. Assoc. UK 80, 381–382 (2000).
73. I. Kovačić, M. Đuras, H. Gomerčić, H. Lucić, T. Gomerčić, Stomach contents of two Cuvier’s beaked whales (Ziphius cavirostris) stranded in the Adriatic Sea. Mar. Biodivers. Rec. 3, E19 (2011).
74. M. B. Santos, G. J. Pierce, J. Herman, A. López, A. Guerra, E. Mente, M. R. Clarke, Feeding ecology of Cuvier’s beaked whale (Ziphius cavirostris): A review with new information on the diet of this species. J. Mar. Biol. Assoc. UK 81, 687–694 (2001).
75. M. B. Santos, V. Martin, M. Arbelo, A. Fernández, G. J. Pierce, Insights into the diet of beaked whales from the atypical mass stranding in the Canary Islands in September 2002. J. Mar. Biol.
Assoc. U. K. 87, 243–251 (2007).
76. E. A. Andruszkiewicz, H. A. Starks, F. P. Chavez, L. M. Sassoubre, B. A. Block, A. B. Boehm, Biomonitoring of marine vertebrates in Monterey Bay using eDNA metabarcoding. PLOS ONE 12, e0176343 (2017).
77. M. W. Pedersen, S. Overballe-Petersen, L. Ermini, C. Der Sarkissian, J. Haile, M. Hellstrom, J.
Spens, P. F. Thomsen, K. Bohmann, E. Cappellini, I. B. Schnell, N. A. Wales, C. Carøe, P. F.
Campos, A. M. Z. Schmidt, M. T. P. Gilbert, A. J. Hansen, L. Orlando, E. Willerslev, Ancient and modern environmental DNA. Philos. Trans. R. Soc. B Biol. Sci. 370, 20130383 (2015).
78. M. Vecchione, R. E. Young, Ancistrocheiridae Pfeffer 1912, Ancistrocheirus lesueurii (Orbigny 1842). Ancistrocheirus Gray 1849 (2016);
http://tolweb.org/Ancistrocheirus_lesueurii/19632/2016.11.16, in The Tree of Life Web Project;
http://tolweb.org/.
79. M. Vecchione, T. Kubodera, R. E. Young, Taningia Joubin 1931, Taningia danae Joubin 1931 (2010); http://tolweb.org/Taningia_danae/19840/2010.08.22, in The Tree of Life Web Project, http://tolweb.org/.
80. R. Pinfield, E. Dillane, A. K. W. Runge, A. Evans, L. Mirimin, J. Niemann, T. E. Reed, D. G. Reid, E. Rogan, F. I. P. Samarra, E. E. Sigsgaard, A. D. Foote, False-negative detections from
environmental DNA collected in the presence of large numbers of killer whales (Orcinus orca).
Environ. DNA. 1, 316–328 (2019).