INDIA
Cyclone Phailin in Odisha
October 2013
Rapid Damage and Needs Assessment Report
Asian Development Bank Government of Odisha The World Bank
Public Disclosure Authorized Public Disclosure Authorized Public Disclosure Authorized Public Disclosure Authorized
83886
Title and inside photos courtesy:
Government of Odisha Design and printed by:
Colorcom Advertising
INDIA
Cyclone Phailin in Odisha
October 2013
Rapid Damage and Needs Assessment Report
December 2013
Asian Development Bank Government of Odisha The World Bank
Foreword
The Very Severe Cyclone Storm "Phailin" that hit the coast of Odisha on October 12, 2013, brought with it very high speed winds and heavy rainfall that caused extensive damages particularly to houses, standing crops, power and communication infrastructure in the coastal districts of the State.
We are thankful that the casualties were minimal and my heartfelt gratitude goes to all the Government employees and the rescue teams for their efforts in creating the preparedness for this calamity and helping the Government to successfully evacuate nearly 1 million people. This has been one of the largest rescue operations in the history of our country.
This report – "Rapid Damage and Needs Assessment: Cyclone Phailin in Odisha 2013" – lays the ground for the effective recovery from cyclone impacts. The Odisha Government recognizes the necessity to continuously improve on disaster risk reduction and management capabilities, and aims to rebuild a more resilient future for its citizens.
Presently we need to immediately start rehabilitation and rebuilding of damaged assets, infrastructure and livelihoods. This report provides a detailed breakdown of the affected sectors, the extent of damages sustained, the reconstruction/recovery needs, and the recovery strategy. We in Odisha are committed to 'build back smarter' to minimize future risks.
NAVEEN PATNAIK Chief Minister
Government of Odisha
Foreword
On October 12. 2013, Cyclone Phailin hit the coast of Odisha near Gopalpur in Ganjam district, affecting about 13.2 million people in 171 blocks in 18 Districts of the state, and resulting in 44 human casualties. The damage caused by the cyclone was due to the unprecedented wind velocity of up to 220 kmph followed by torrential rains that caused massive destruction in the districts of Ganjam, Puri, Khurdha, and the Chilika lagoon.
The success of minimizing human casualties was due to the resolve of the state and our team's preparedness. The government of Odisha and OSDMA had commenced preparatory activities by immediately dispatching emergency assistance and evacuating people.
Over 1 million people were evacuated within 36 hours preceding the landfall of Cyclone Phailin, which is one of the largest emergency evacuations carried out within a record timeframe. These efforts were made in close collaboration with the Odisha Disaster Rapid Action Force (ODRAF), National Disaster Response Force (NDRF), Central Reserve Police Force (CRPF), Odisha State Armed Police (OSAP), and the Indian Air Force (IAF).
The need to immediately start recovery and reconstruction work after Cyclone Phailin, especially in the affected districts, has prompted the State Government, in collaboration with the World Bank and the Asian Development Bank, to initiate an assessment of the recovery needs in order to draw up a comprehensive recovery framework. The "Cyclone Phailin in Odisha 2013: Rapid Damage and Needs Assessment" report is the result of this exercise which was undertaken during November 26 to December 3, 2013.
We recognize that each disaster is an opportunity to improve our resilience and risk measures within the State. This report lays the groundwork for an enduring recovery of high resilience measures within the State, and sustainable restoration of livelihoods among the affected population.
JK MOHAPATRA
Chief Secretary
Government of Odisha
Acknowledgement
The Rapid Damage and Needs Assessment Report (RDNA), post-Cyclone Phailin in Odisha, was prepared in response to a request from the Department of Economic Affairs (DEA), Government of India (GoI). It was undertaken jointly by the Government of Odisha (GoO), the Asian Development Bank and the World Bank. The RDNA team visited Bhubaneswar (Odisha) and the three most severely affected districts of Ganjam, Puri and Khordha, from November 26 to December 3 2013, and collaborated with the GoO to assess the damage and develop a recovery and restoration framework.
The team met with various line departments, and district offi cers of different sectors within the GoO that have been involved in the damage enumeration. The team extends its appreciation to Mr. Injeti Srinivas (ACS and Development Commissioner), Mr. U.N.
Behera (ACS Finance) and Dr. Taradatt, (ACS, Revenue and Disaster Management Department MD-OSDMA), the district collectors of Ganjam, Khordha and Puri for meeting and sharing valuable information and insights.
The team wishes to acknowledge and sincerely thank all the other Government offi cials and various line departments who assisted and participated in this exercise, both at the state and at the district levels. Without their valuable insights, active support and logistical arrangements, the team’s fi eldwork would not have been productive.
The RDNA Team
11
The RDNA team was led by Deepak Singh (World Bank) and Andrew Jeffries (ADB). The team members from
the World Bank included: Vinayak N. Ghatate, Vasudha Sarda, Vidhyadhar Phatak, Satyanarayanan Pallagani,
Hemang Karelia, Ignacio Urrutia, Navid Rahimi, Alok Pattanaik, Dechen Tshering, Jurminla Jurminla,
BKD Raja, Addepalli Sita Ramakrishna, Khabilongtshup Khumujam, Satya Mishra, Vidya Mahesh, Peeyush
Sekhsaria, and Malini Nambiar. The ADB team comprised of Harish Kumar Varma, Anil Motwani, Jyotirmoy
Banerjee and Yasmin Siddiqi.
Contents
ABBREVIATIONS & ACRONYMS x
EXECUTIVE SUMMARY xii
CHAPTER 1: INTRODUCTION 1
1.1 Vulnerability to Natural Disasters 1
1.2 The Disaster: Cyclone Phailin 2
1.3 State Government Response 4
CHAPTER 2: PROCESS AND METHODOLOGY OF THE ASSESSMENT 5
2.1 Assessment Process 5
2.2 Assessment Scope 6
2.3 Assessment Methodology 6
2.4 Limitations and Caveats 7
CHAPTER 3: DAMAGE AND NEEDS ASSESSMENT 8
3.1 Housing 8
3.2 Public Buildings 11
3.3 Damage to Heritage Monuments 14
3.4 Roads 15
3.5 Urban Infrastructure (Water Supply, Roads, Drains and Sewerage) 16
3.5.1 Rural Water Supply and Sanitation 18
3.6 Agriculture 19
3.6.1 Horticulture 21
3.6.2 Irrigation Infrastructure 22
3.6.3 Livestock 24
3.7 Livelihoods 26
3.7.1 Fisheries 27
3.7.2 Non-farm Sector: Handloom, Handicraft and Small and
Micro Enterprises 28
3.8 Power Infrastructure 30
3.9 Forest and Plantations 32
3.10 Socially Vulnerable Sections: Cyclone Impacts and Recovery Needs 33
CHAPTER 4: SUMMARY OF POST- CYCLONE RECOVERY NEEDS 36
CHAPTER 5: ENHANCING DISASTER RISK MANAGEMENT 40
THE WAY FORWARD 40
List of Tables
Table 1 Preliminary Estimation of Reconstruction Cost xiii
Table 2 Assessment Time Frame 5
Table 3 Damages to Housing 9
Table 4 Reconstruction Cost for Damaged Houses 10
Table 5 Cost for Providing Basic Services and Land acquisition 10 Table 6 Cost of Reconstruction, Providing Basic Services and Land Acquisition 11
Table 7 Damages to Non-Residential Buildings 12
Table 8 Damages to Residential Buildings 12
Table 9 Estimated Cost for Non-Residential Building 13
Table 10 Estimated Cost for Residential Buildings 13
Table 11 Damage to Heritage Monuments 14
Table 12 Estimated Cost for Heritage Monuments 14
Table 13 Damages to Roads 15
Table 14 Estimated Cost for Reconstruction 16
Table 15 Summary of Damage to Urban infrastructure 17 Table 16 Summary of Preliminary Estimation of Damage to Urban
Infrastructure 18
Table 17 District-wise status and impact of damaged Rural Water Supply
Schemes 19
Table 18 Reconstruction Cost for Rural Water Supply and Sanitation 19
Table 19 Agriculture Lands Affected 20
Table 20 District wise Estimated Loss to Agriculture Sector 21 Table 21 Horticulture Crop Production Details 2010-11 21
Table 22 Horticulture Crop Area Damaged 22
Table 23 Estimated Loss of Horticultural Crop in Three Districts 22
Table 24 Details of the Damage to Irrigation Infrastructure 24
Table 25 Estimated Damage to Irrigation Infrastructure 24
Table 26 Number of Livestock Affected and Dead 25
Table 27 Estimated Loss of Livestock (large, small and poultry) 26 Table 28 Summary Table of Estimated Cost for Four Sectors 26 Table 29 Summarised Damages to Livelihood in Ganjam, Khordha and Puri 27
Table 30 Damage to Fisheries 28
Table 31 Damage sustained by Handloom and Handicraft Sector 29
Table 32 Estimated Recovery Cost of MSME 30
Table 33 Estimated Recovery Cost of Power 31
Table 34 Estimates Recovery Needs for Ganjam District 32
Table 35 Damage to Reserve Forest and Plantations 33
Table 36 Sector-wise Overview of Recovery Needs 37
List of Figures
Figure 1 Wind and Cyclone Zones of Odisha 2
Figure 2 Tracking of Cyclone ‘Phailin’ 3
Abbreviations & Acronyms
ADB Asian Development Bank BCM Billion Cubic Meters CCA Culturable Command Area CDR Cyclone Damage Report CGP Captive Generating Plants CRPF Central Reserve Police Force
CSMMC Cyclone Shelter Management and Maintenance Committee DEA Department of Economic Affairs
DFO District Forest Offi cer
DoWR Department of Water Resources DPR Detailed Project Report
DSS Decision Support System FSI Fishery Survey of India
FSMMC Flood Shelter Management and Maintenance Committee GIS Geographic Information System
GoI Government of India GoO Government of Odisha GSDP Gross State Domestic Product
HH Households
IAF Indian Air Force IAY Indira Aawas Yojna
ICZMP Integrated Coastal Zone Management Project IMD Indian Meteorological Department
JnNURM Jawaharlal Nehru National Urban Renewable Mission
KV Kilo Volt
MDR Major District Road
MSME Micro, Small and Medium Enterprise
NCRMP National Cyclone Risk Mitigation Project
NDMA National Disaster Management Authority
NDRF National Disaster Response Force NTFP Non-Timber Forest Product ODR Other District Road
ODRAF Odisha Disaster Rapid Action Force OLM Odisha Livelihood Mission
OSAP Odisha State Armed Police
OSDMA Odisha State Disaster Management Authority PMGSY Pradhan Mantri Gramin Sadak Yojna
PPAS Power Purchase Agreements PWD Public Works Department RAY Rajiv Aawas Yojna
RCC Reinforced Concrete Cement
RDNA Rapid Damage and Needs Assessment
R&DM Revenue and Disaster Management Department RWSS Rural Water Supply Schemes
SLDC State Load Dispatch Center STU State Transmission Utility
THR Take Home Ration
ULBs Urban Local Bodies
VSCS Very Severe Cyclonic Storm
WB World Bank
WBM Water Bound Macadam
Executive Summary
1. The Very Severe Cyclonic Storm (VSCS) ‘Phailin’ made landfall at the coast of Odisha near Gopalpur in Ganjam district on October 12, 2013. Eighteen out of the thirty districts in the state were affected by the storm and subsequent fl oods. The majority damages were due to high speed winds of up to 220 kmph followed by fl ooding ensued by torrential rains. The observed storm surge was up to about 3.5 m above normal, inundating large areas in the districts of Ganjam, Puri, Khordha, and around Chilika lagoon. The cyclone left 44 people dead, damaged about 256,600 homes and affected about 13.2 million people in over 18,370 villages.
2. Preparedness of the Government of Odisha (GoO) and the coastal communities and their resolve to ensure zero casualties resulted in prompt action to the warning of the cyclone. The GoO dispatched emergency assistance and evacuated people to safer places.
This effort was made in close collaboration with the Odisha State Disaster Management Authority (OSDMA), fi eld level offi cers, Cyclone Shelter Management and Maintenance Committees (CSMMCs), the National Disaster Management Authority (NDMA), the Odisha Disaster Rapid Action Force (ODRAF), National Disaster Response Force (NDRF), Central Reserve Police Force (CRPF), Odisha State Armed Police (OSAP) and the Indian Air Force (IAF).
3. Around one million people were evacuated to nearby cyclone/fl ood shelters and to other identifi ed safe buildings. This was one of the largest evacuation sever done in recorded history of Disaster Management in India. In addition, the state government opened 4,197 free kitchens centers from October 11 onwards. 185 medical teams were mobilized and 338 medical relief centers were opened. The cyclone caused extensive devastation uprooting vast number of trees, damaging roads, public buildings, houses and disrupting telecommunications and power lines. Due to the effective pre-positioning of men, machinery and materials and the able coordination among State, National and Local agencies, the restoration of connectivity was carried out in an impressive manner.
4. The World Bank and the Asian Development Bank received a request from the Department of Economic Affairs (DEA), Government of India (GoI) to support the efforts of the GoO for reconstruction and preparedness, and lay the groundwork for a recovery framework. The Rapid Damage and Needs Assessment team visited the State between November 26 and December 3, 2013, to jointly discuss with the GoO for a multi-sectoral needs assessment after Cyclone Phailin.
Methodology
5. The report provides an account of physical damages with a sector–wise reporting
and assessment of post cyclone recovery needs. The assessment is based primarily on
the data collected and reported by the GoO till December 02, 2013. The methodology is
explained in Chapter 2.
6. The joint team undertook fi eld visits in some areas of the affected districts to witness the damages and understand the data collection methodology of the state government.
The sectors that were covered in the Rapid Damage and Needs Assessment (RDNA) included: Housing; Public Building; Roads; Urban and Rural Infrastructure; Agriculture and Livestock; Livelihood (Fisheries, MSME, Handicraft& Handloom); Energy/Power;
and Forest and Plantations.
7. It is to be noted that the data on damages varies in scope and coverage as individual sectors refl ect either data from the most affected districts and/or the whole state based on the availability of data.
Overview of Recovery Assessment
8. The human casualties were relatively low as compared with the Super Cyclone of October 1999, but the impact on the lives of coastal residents was still massive. In the Ganjam District of Odisha alone, about 90,000 houses were partially or fully damaged along the coastal areas. About 1,292,967 hectares of agriculture, horticulture and perennial crops have sustained more than a 50% loss due to the cyclonic storm and fl oods. The cyclone and fl oods affected 44,806 fi shermen households, and 1,564 artisans.
9. The overview of the Damage and Needs Assessment is provided in Table 1 Table 1: Preliminary Estimation of Reconstruction Cost
Sectors Cost (INR million) Cost (US$ million)
Housing 29,600 480
Public Buildings 6,620 110
Roads 7000 110
Urban and Rural Infrastructure 4700 80
Agriculture, Horticulture, Irrigation and Livestock 26,500 430
Livelihood (Fisheries, MSME and others) 3,960 65
Energy/ Power 10,480 170
Forest and Plantations 160 3
Total 89,020 1,450
Note: (i) The values have been rounded off so the totals may not match; (ii) Currency conversion rate 1 US$
=INR 62.
10. The RDNA estimates the total damages and loss caused by Cyclone Phailin at about INR 89,020 million (equivalent US$ 1,450 million). The bulk of the reconstruction costs are in Housing (33%), Agriculture and Livestock (30%). Chapter 3 provides a detailed sector-wise description of the damage and needs assessment.
11. Recovery Needs: Chapter 4 of this report discusses several factors that need to
be taken into consideration to inform the design of a comprehensive reconstruction and
recovery strategy which would assist the State to ‘build back better’. Below are a few key fi ndings that further informs the GoO’s recovery and reconstruction strategy:
• Housing (both Pucca and Kutcha) has incurred severe damages due to the disaster.
An appropriate housing reconstruction policy will need to be prepared and adopted to clearly identify criteria for eligibility, required relocation, and an approach for reconstruction.
• In urban areas, upgrading informal settlements with access roads which connect to city roads and adequate storm water drainage system are essential for both evacuation and safety of the community.
• Energy infrastructure is vulnerable to high velocity winds during a cyclonic event and future resilience can be improved by using underground cabling as part of the reconstruction plan of both the Power and Telecommunication networks.
• The assessment highlights a signifi cant social impact – particularly for those whose livelihood depends on agriculture and fi sheries. Recovery efforts need to focus on those communities.
• Together with the WB, additional areas have been identifi ed in Chapter 5 to enhance
the disaster risk management operations in Odisha, which includes: investing in
risk mitigating infrastructure (i.e., resilient housing, additional cyclone shelters,
strengthening embankments and power infrastructure), planned urban infrastructure,
risk knowledge management and improving forest resources.
1. Introduction
1.1 Vulnerability to Natural Disasters
1. The State of Odisha is vulnerable to multiple natural hazards. Due to its sub- tropical littoral location, the state is prone to various hydro-meteorological hazards such as tropical cyclones, storm surges and tsunamis. The state has a 480 km long coastline with a signifi cantly high population density in the coastal areas as compared to the interior regions
2. Odisha’s population stands at 41 million as per the 2011 census and a large portion of this population are located on the plains of its river systems. The rivers in these areas contain heavy alluvial deposits of silt that substantially reduces the carrying capacity resulting in frequent fl oods that at times is compounded by breach of embankments.
2. India’s east coast is one of the six most cyclone prone areas in the world. Although the coastline of Odisha is only about 17% of the Indian east coast, it has been affected by nearly 35% of all cyclonic and severe cyclonic storms that have crossed the east coast and associated storm surges that have often inundated large tracts of coastal districts
3. On an average, about fi ve to six tropical cyclones form in the Bay of Bengal every year, of which two to three are within the mild to severe range. Taking together the storms and severe storms, coastal Odisha is about twice as vulnerable as compared to the other eastern states.
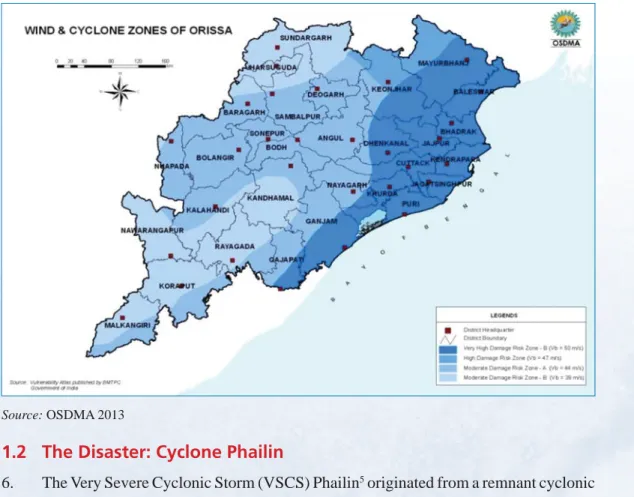
The Figure 1 shows the cyclone zones for the state of Odisha.
3. The State has two cyclone seasons, the fi rst during the pre-monsoon period (April – May) and the second during the post-monsoon period (September - November). In October 1999 the cyclone that hit Odisha was classifi ed as a ‘Super Cyclone’ due to its severity and left the state virtually paralyzed due to the destruction to its infrastructure and communication systems. The cyclone severely affected around 18 million people in 14 districts and left about 10,000 people dead.
4. After the 1999 super cyclone, the state government has taken measures like the installation of modern communication systems, construction of cyclone shelters, and other improved infrastructure including pucca
4houses for the poor in the cyclone prone areas to reduce the physical vulnerability of the coastal districts to cyclonic winds and tidal surges.
However, with the increase in population in the coastal areas, and depletion of mangroves and shelter belts, the state continues to be vulnerable to cyclones.
5. In addition, while a large part of the state comes under Earthquake Risk Zone-II (Low Damage Risk Zone), the Brahmani Mahanadi graben and their deltaic areas come
2
As per 2011 census the Population density is 269 persons per sq. km. While in 2001, the population density was 236 persons per sq. km and the population density in costal Districts was 410 per sq km.
3
State Disaster Management Plan, Odisha, August 2013, GoO, OSDMA
4
Houses made with Reinforced Cement Concrete (RCC) structure with RCC roofs or with brick/laterite
masonry with RCC roofs.
under Earthquake Risk Zone-III (Moderate Damage Risk Zone) and this covers 43 out of the 103 Urban Local Bodies in the state. Furthermore, the state is also vulnerable to fl ash fl oods and landslides.
1.2 The Disaster: Cyclone Phailin
6. The Very Severe Cyclonic Storm (VSCS) Phailin
5originated from a remnant cyclonic circulation from the South China Sea. The cyclonic circulation lay as a low pressure area over the Tenasserim coast on October 6, 2013. It subsequently moved over to the north Andaman Sea as a well-marked low pressure area on October 7. It concentrated into a depression over the same region on October 8 moving west-northwest wards, and then intensifi ed into a deep depression on the morning of October 9 and further into a cyclonic storm (CS), ‘Phailin’ in the evening of the same day. Moving northwest wards, it further intensifi ed into a severe cyclonic storm (SCS) in the morning of October 10 and into a VSCS in the forenoon of the same day over east central Bay of Bengal.
7. The VSCS Phailin crossed Odisha and the adjoining north Andhra Pradesh coast near Gopalpur (Odisha) around 2230 hours IST on October 12, 2013 with a sustained maximum surface wind speed of 200-210 kmph gusting up to 220 kmph. It caused very heavy rainfall over Odisha leading to fl oods and strong gale winds causing large scale structural damage and storm surges triggering widespread coastal inundation over Odisha.
5 Very Severe Cyclonic Storm, PHAILIN over the Bay of Bengal (08-14 October 2013) : A Report by India Meteorological Department
Figure 1: Wind and Cyclone Zones of Odisha
Source: OSDMA 2013
The maximum rainfall occurred over the northeast sector of the system centre at the time of landfall. A maximum 24 hour cumulative rainfall of 38 cm has been reported over Banki in Cuttack district of Odisha. Based on the post-cyclone survey report, a maximum storm surge of 3.5 meters above the astronomical tide has been estimated in the low lying areas of Ganjam district of Odisha in association with the cyclone and the in-land inundation of saline water extended upto about one kilometer from the coast.
Figure 2: Tracking of Cyclone ‘Phailin’
68. The damages caused by the cyclone were due to the very high wind velocity, torrential rains and subsequent fl ooding that affected eighteen out of the thirty districts in Odisha.
The cyclone left 44 people dead, damaged 256,633 homes and affected 13 million lives.
Though the human casualties were relatively low as compared with the Super Cyclone of October 1999, about 1,292,967 hectares of agriculture, horticulture and perennial crops have sustained more than a 50% loss due to the cyclonic storm and fl oods. The cyclone and fl oods affected 44,806 fi shermen households, and 1,564 artisan households.
9. The Ganjam district was the most affected. The cumulative amount of rainfall during this spell was as high as 241.1 mm in the district and about 2,812 villages have been affected. Public and private properties, agricultural crops and horticultural plantations
6
IMD Forecast tracking (in red) as issued on October 9, 2013, with observed tracking (in black) of VSCS Phailin during October 8-14, 2013.
Source: IMD
have all suffered severe damage. All surface communication systems, telecommunication, power supply and water supply lines were totally disrupted
7.
10. Following the cyclone, due to heavy rainfall, Baitarani, Budhabalanga, Rusikulya, Subarnarekha and Jalaka rivers witnessed fl oods/ fl ash fl oods affecting the downstream areas of mainly Mayurbhanj, Balasore, Bhadrak, Keonjhar, Jajpur and Ganjam districts.
1.3 State Government Response
11. The GoO was proactive and well prepared to deal with the impending cyclone. In addition to the updates from IMD, the path, intensity and magnitude of the cyclone were continuously tracked at OSDMA and a range of preparatory activities were launched to face the cyclone with a zero casualty approach.
12. Prior to landfall, the OSDMA conducted mock drills at all the cyclone shelters and also checked and replaced equipment’s available at many of these shelters. Cyclone and Flood Shelter Management and Maintenance Committees were activated in order to facilitate the evacuation of vulnerable populations. All 14 cyclone prone districts were provided with satellite phones for communication in case of failure in telecommunication lines. In addition, the state government ensured that 4,197 free kitchen centers were opened from October 11 onwards that covered more than 2 million affected people. In addition 185 medical teams and 338 medical relief centers were also opened. As the event was unfolding during the Indian festive season of ‘Dussehra’ all government employee holidays were cancelled and all fi eld offi ces were kept open. About 30 nodal NGOs were also engaged in various vulnerable blocks of the coastal and fl ood prone districts.
13. To ensure zero casualties, the GoO ordered all people living in low lying areas and kutcha houses or tin roof houses within 0-10 km of the coastline to be evacuated to nearby cyclone shelters or other identifi ed safe buildings. Similar steps were undertaken to shift the livestock to safer places. Over 1 million people were evacuated within 36 hours preceding the landfall of Cyclone Phailin, which is one of the largest emergency evacuations carried out in a record timeframe. These efforts were made in close collaboration with the Odisha Disaster Rapid Action Force (ODRAF), National Disaster Response Force (NDRF), Central Reserve Police Force (CRPF), Odisha State Armed Police (OSAP) and the Indian Air Force (IAF).
14. Cyclone Phailin and the fl oods that followed after heavy rainfall caused extensive devastation in the affected districts, uprooting vast number of trees, damaging roads, public buildings and disrupting telecommunications and power. Due to the effective prepositioning of men, machinery and materials, and the able coordination among State, National and Local agencies, the restoration of connectivity was carried out in an impressive manner.
Major roads were cleared within 24 hours. About 5.7 MT of dry food were airdropped by IAF helicopters to inaccessible areas. Over 0.5 million families were provided with temporary shelter and elaborate arrangements were made for safe drinking water and power supply. Medical teams and sanitation kits were also deployed to all affected areas.
7
Very Severe Cyclonic Storm, PHAILIN over the Bay of Bengal (08-14 October 2013) : A Report by India
Meteorological Department
2. Process and Methodology of the Assessment
1. This RDNA report is a joint collaborative effort of the GoO, the WB and the ADB in response to a request from the Government of India (GoI). The objective of the exercise is to undertake a rapid assessment of the damage and needs after Cyclone Phailin and the subsequent fl oods, and lay the groundwork for a recovery and reconstruction framework with assistance from the WB and ADB.
2.1 Assessment Process
2. A Joint team led by the DEA to support the State Government of Odisha, with representation from NDMA, the WB and ADB, visited Odisha on November 13, 2013.
Subsequently, a request from GoI was received on November 18, 2013 by the WB and ADB to fi eld a post-cyclone damage and needs assessment mission in Odisha. The joint mission team in partnership with GoO visited the state between November 26 and December 03, 2013, in order to produce a rapid multi-sectoral assessment of the damages and needs. The fi eld visits were confi ned to three majorly affected districts of Ganjam, Khordha and Puri.
3. The RDNA team was briefed by the GoO on November 26, 2013 where the scope of the assessment was agreed upon with the GoO. A wrap up session was held on December 03, where the mission team shared the assessment fi ndings with the GoO. The mission team then debriefed the DEA in New Delhi. During the assessment mission, meetings were held with the Chief Secretary, Additional Chief Secretary, Finance; Additional Chief Secretary (Revenue) & the Managing Director, OSDMA; Development Commissioner;
Secretaries and senior offi cials of line departments and the District Magistrates of the three most affected districts – Ganjam, Puri and Khordha. Table 2 shows the schedule of activities.
Table 2: Assessment Time Frame
Time Period Activity
November 13 DEA led mission to support GoO
November 18 Request received from DEA for Post-Cyclone Rapid Damage and Needs Assessment
November 26 Kick-off meeting with the GoO
November 27-29 Sector-wise data collection and fi eld visits with line agencies November 30 -
December 03 Preparation of draft assessment report and fi lling up gaps December 03 Wrap-up presentation of report to GoO
December 05-09 Report fi nalization
December 10 Final report sharing
4. Data collection and aggregation templates for damage and needs assessment were distributed to the sector teams who customized these templates to the specifi c context and as per data availability. The team conducted detailed interviews with sectoral counterparts from the respective line departments of the three most affected districts to understand their data collection methodologies and to fi ll any gaps that may exist.
Sector teams also conducted fi eld visits to understand the extent and type of damages. This report primarily relies on the data collected by the district offi cials of GoO and collated at the state level. A sector-by-sector analysis of the damage was undertaken, utilizing specifi c templates for information recording and gathering in order to ensure consistency of information. A currency conversion rate of US$ 1= INR 62 has been used.
5. A stakeholder consultation was organized by OSDMA on December 02 with NGOs, UN agencies, academic institutions and government offi cials to discuss probable assistance and inform early recovery plans.
2.2 Assessment Scope
6. This assessment covers the damage caused by the cyclone of October 12 and the associated fl oods that occurred during October 21 to 26. While heavy rainfall and fl ooding affected almost all districts within the state, the heavy winds from the cyclone most directly affected three districts which sustained the bulk of the damages, namely Ganjam, Khordha and Puri. The following sectors are covered in the assessment: i) Housing; ii) Public Buildings; iii) Roads; iv) Urban and Rural Infrastructure; v) Agriculture and Livestock; vi) Livelihood (Fisheries, MSME, Handicraft and Handloom); vii) Energy/Power; and viii) Forest and Plantations.
2.3 Assessment Methodology
7. The main focus of this assessment report is to estimate the physical damages and the corresponding needs for recovery including the loss of livelihoods. It provides a preliminary estimate of the extent of damages and total cost of corresponding recovery and reconstruction needs. The reconstruction needs are computed and expressed as the fi nancing requirement for restoring damages with a “build back smarter” factor for quality improvements and risk mitigation, where possible.
8. Teams visited the three most severely affected districts during November 27 to 29,
2013. The RDNA team’s estimation of the damages neither supersedes nor disregards the
assessments of damage and needs made by other entities. It presents a consolidated view, on the basis of relevant information received and the expertise of a multi-institutional and interdisciplinary assessment team.
2.4 Limitations and Caveats
9. The assessment is intended to quantify the consequences of the disaster, and to provide a fi rst attempt at identifying immediate and longer term recovery needs. The team’s analysis is based on discussions with the state government, short fi eld visits and relies primarily on the assessments carried out by the GoO and data available at the time of the mission. It must be noted that the data on damages may vary in scope as the various sectors refl ect either data from the most affected districts and /or the whole state, as per data availability.
10. The fi nal recovery needs would be contingent upon future policy decisions by GoO that may include aspects of overall vulnerability reduction and increasing resilience of the communities.
11. The draft report was discussed and presented to GoO on December 03, 2013.
3. Damage and Needs Assessment
1. This chapter provides a sector-wise damage and needs assessment.
3.1 Housing
2. Cyclone Phailin that crossed coastal Odisha on November 12, 2013 caused major damages to coastal infrastructure, particularly to kutcha and semi-pucca houses due to high speed winds and associated rainfall. The State of Odisha has about 83% of its population in rural areas and the predominant building typologies in the disaster affected areas include (i) kutcha structures (i.e. semi-permanent houses of wattle and daub
8construction with thatched roofs or asbestos sheets); and (ii) pucca structures (i.e. houses made with Reinforced Cement Concrete (RCC) structure with RCC roofs or with brick/laterite masonry with RCC roofs).
3. Fully and severely damaged structures are those where both the walls and roofs are damaged and are not habitable while partially damaged structures are those where either a small portion of the roof or the wall is damaged and can be repaired.
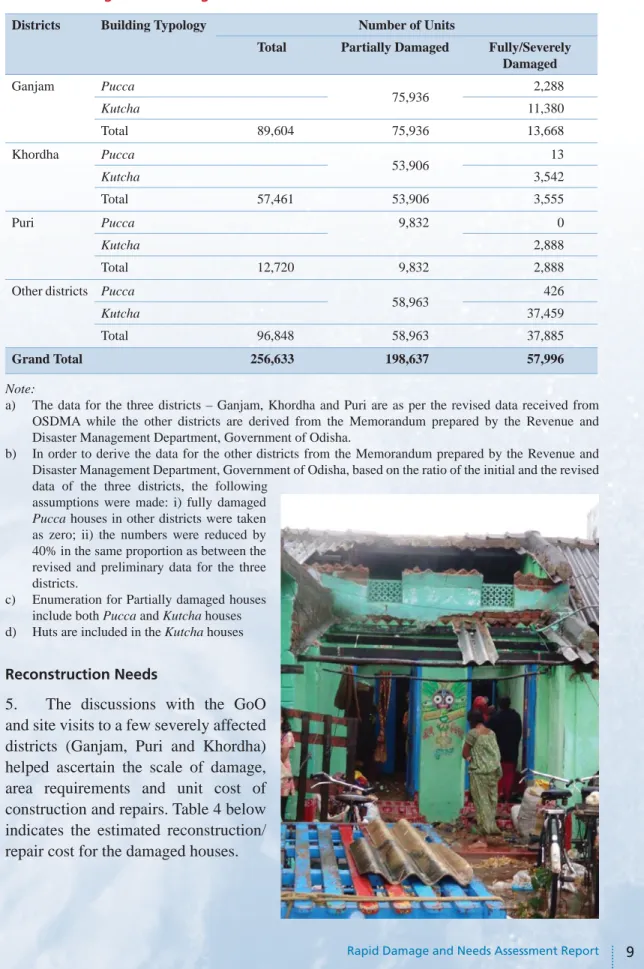
4. Based on the information provided by the GoO about 256,600 units were damaged in the rural areas. In addition there were losses of personal and productive assets. Those however have not been quantifi ed due to a lack of relevant available data at the time of this report. A snapshot of the damages is given in the following Table 3.
8
Wattle and daub is a composite building material used for making walls, in which a woven lattice of wooden strips
called wattle is daubed with a sticky material usually made of some combination of wet soil, clay, sand, animal
dung and straw. “The Building Conservation Directory, 2001”
Table 3: Damages to Housing
Districts Building Typology Number of Units
Total Partially Damaged Fully/Severely Damaged
Ganjam Pucca
75,936 2,288
Kutcha 11,380
Total 89,604 75,936 13,668
Khordha Pucca
53,906 13
Kutcha 3,542
Total 57,461 53,906 3,555
Puri Pucca 9,832 0
Kutcha 2,888
Total 12,720 9,832 2,888
Other districts Pucca
58,963 426
Kutcha 37,459
Total 96,848 58,963 37,885
Grand Total 256,633 198,637 57,996
Note:
a) The data for the three districts – Ganjam, Khordha and Puri are as per the revised data received from OSDMA while the other districts are derived from the Memorandum prepared by the Revenue and Disaster Management Department, Government of Odisha.
b) In order to derive the data for the other districts from the Memorandum prepared by the Revenue and Disaster Management Department, Government of Odisha, based on the ratio of the initial and the revised data of the three districts, the following
assumptions were made: i) fully damaged Pucca houses in other districts were taken as zero; ii) the numbers were reduced by 40% in the same proportion as between the revised and preliminary data for the three districts.
c) Enumeration for Partially damaged houses include both Pucca and Kutcha houses d) Huts are included in the Kutcha houses Reconstruction Needs
5. The discussions with the GoO and site visits to a few severely affected districts (Ganjam, Puri and Khordha) helped ascertain the scale of damage, area requirements and unit cost of construction and repairs. Table 4 below indicates the estimated reconstruction/
repair cost for the damaged houses.
Table 4: Reconstruction Cost for Damaged Houses
Districts No. of Units INR Million US$ Million
Ganjam 89,604 6,864.48 110.72
Khordha 57,461 3,151.64 50.83
Puri 12,720 1,201.92 19.39
Other districts 96,848 12,966.32 209.13
Total 256,633 24,184.36 390.07
Note:
a) Unit cost of reconstruction is taken as INR. 0.28 million (about US$ 4,500).
b) Cost estimate for partially damaged houses have been calculated taking the weighted average of construction cost of Pucca and Kutcha houses with following assumptions; i) Construction cost of Kutcha houses are taken as INR 70,000 and the repair cost for partially damaged Kutcha houses as 50% of the cost; ii) Construction cost of Pucca houses are calculated as INR 280,000 and the repair cost for partially damaged Pucca houses as 20% of the cost; iii) The weighted average is taken by taking 75% of the houses as Kutcha and 25% as Pucca resulting in an average repair cost of INR 40,000.
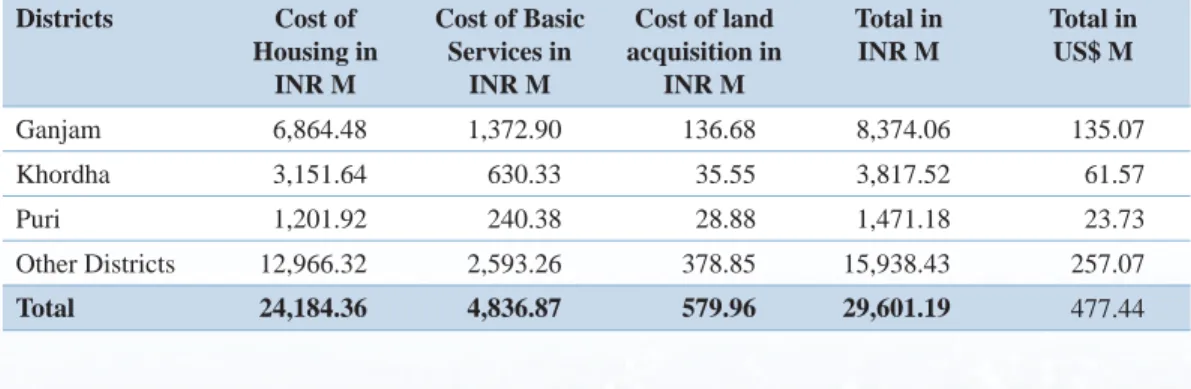
6. The total cost for providing basic services and relocation has also been worked out and amounts to INR 5,417 million (US$ 87 million) provided as per Table 5 below:
Table 5: Cost for Providing Basic Services and Land Acquisition Districts Cost of
Housing in INR M
Cost of Basic Services in
INR M
Land in Acres
Cost of land acquisition
in INR M
Total in INR M
Total in US$ M
Ganjam 6,864.48 1,372.90 114 136.68 1,509.58 24.35
Khordha 3,151.64 630.33 30 35.55 665.88 10.74
Puri 1,201.92 240.38 24 28.88 269.26 4.34
Other districts 12,966.32 2,593.26 316 378.85 2,972.11 47.94
Total 24,184.36 4,836.87 484 579.96 5,416.83 87.37
Note:
(a) The cost of basic services is taken @ 20% of the reconstruction cost.
(b) The number of houses in need of relocation is taken as 50% of the total numbers of houses fully/severely for both Pucca and Kutcha houses.
(c) It is assumed that a maximum of 60 units of houses can be built in 1 acre of land including the basic services.
(d) The cost of land is assumed @ INR 1,200,000 per acre.
7. The total cost for
reconstruction of houses including
providing basic services and
relocation has been worked out
and amounts to INR 29,601 million
(US$ 477 million) provided in
Table 6 below:
Table 6: Cost of Reconstruction, Providing Basic Services and Land Acquisition Districts Cost of
Housing in INR M
Cost of Basic Services in
INR M
Cost of land acquisition in
INR M
Total in INR M
Total in US$ M
Ganjam 6,864.48 1,372.90 136.68 8,374.06 135.07
Khordha 3,151.64 630.33 35.55 3,817.52 61.57
Puri 1,201.92 240.38 28.88 1,471.18 23.73
Other Districts 12,966.32 2,593.26 378.85 15,938.43 257.07
Total 24,184.36 4,836.87 579.96 29,601.19 477.44
3.2 Public Buildings
8. This section outlines the damages to public buildings (including residential buildings) in education, health, and government service sectors. The extent of the damages to buildings varies, with relatively more severe impacts in the districts of Ganjam and Puri. The main type of damage is to asbestos sheet roofs, followed by windows, doors, and cracked walls and boundary walls. The damages have led to the disruption of the routine functioning of these facilities. It is important to note the key role played by public buildings during the disaster given that many were used as evacuation shelters during the cyclone which also led to damages to equipment (furniture, teaching and learning material in schools).
9. The information was provided by Rural Works (Rural Development Department), Sarva Shiksha Abhiyan (Department of School and Mass Education), District Rural Development Agency (Panchayati Raj Department), Urban Local Bodies (Department of Housing and Urban Development), and OSDMA. The public buildings covered were from the departments of Higher Education, Health, Animal & Health Veterinary, Rural Development, Revenue, School and Mass Education, Panchayati Raj, Housing and Urban Development, Industries, Agriculture, Finance, Home, Law, Commerce and Transport, Tourism, Co-operation, State Archaeology, and others. Whenever information was not available, the data was calculated on the bases of the overall damage percentage that affected each district as per GoO’s Memorandum.
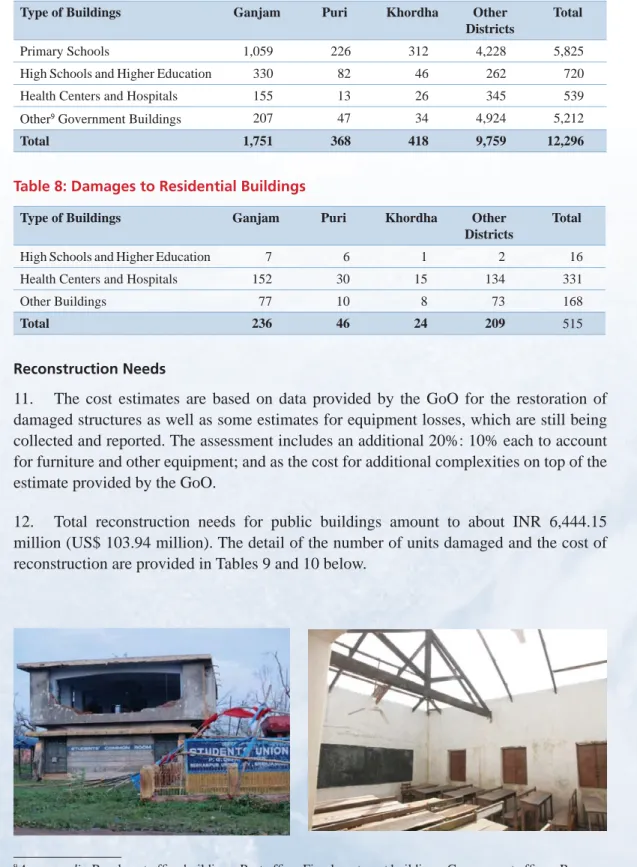
10. As per the information obtained a total of about 12,811 public buildings were damaged, of which 12,296 correspond to non-residential and 515 to residential buildings respectively, with primary schools being the most affected.
The damages to public buildings
are given in Tables 7 and 8
below.
Table 7: Damages to Non-Residential Buildings
Type of Buildings Ganjam Puri Khordha Other
Districts
Total
Primary Schools 1,059 226 312 4,228 5,825
High Schools and Higher Education 330 82 46 262 720
Health Centers and Hospitals 155 13 26 345 539
Other
9Government Buildings 207 47 34 4,924 5,212
Total 1,751 368 418 9,759 12,296
Table 8: Damages to Residential Buildings
Type of Buildings Ganjam Puri Khordha Other
Districts
Total
High Schools and Higher Education 7 6 1 2 16
Health Centers and Hospitals 152 30 15 134 331
Other Buildings 77 10 8 73 168
Total 236 46 24 209 515
Reconstruction Needs
11. The cost estimates are based on data provided by the GoO for the restoration of damaged structures as well as some estimates for equipment losses, which are still being collected and reported. The assessment includes an additional 20%: 10% each to account for furniture and other equipment; and as the cost for additional complexities on top of the estimate provided by the GoO.
12. Total reconstruction needs for public buildings amount to about INR 6,444.15 million (US$ 103.94 million). The detail of the number of units damaged and the cost of reconstruction are provided in Tables 9 and 10 below.
9
Anganwadis, Panchayat offi ce buildings, Post offi ce, Fire department buildings, Government offi ces; Revenue
Inspectors Offi ce, Work sheds, storage sheds, Gram Panchayat Offi ce, Block offi ce, Public parks, Town halls,
Bus stand, Marriage halls, Markets, Public toilets others
Table 9: Estimated cost for Non-Residential Building
Districts Primary
Schools
High Schools and Higher
Education
Health Centers
and Hospitals
Others Total
Ganjam Numbers 1,059 330 155 207 1,751
INR million 450.62 300.25 64.82 123.82 939.51
US$ million 7.27 4.84 1.05 2.00 15.16
Puri Numbers 226 82 13 47 368
INR million 96.17 74.61 5.44 28.11 204.33
US$ million 1.55 1.20 0.09 0.45 3.29
Khordha Numbers 312 46 26 34 418
INR million 110.63 34.88 10.87 16.95 173.33
US$ million 1.78 0.56 0.18 0.27 2.79
Other Districts Numbers 4,228 262 345 4,924 9,759
INR million 1,799.06 238.27 144.28 2,945.37 5,126.98
US$ million 29.02 3.84 2.33 47.51 82.70
Total Numbers 5,825 720 539 5,212 12,296
INR million 2,456.48 648.01 225.41 3,117.25 6,444.15
US$ million 39.62 10.45 3.65 50.23 103.94
Table 10: Estimated Cost for Residential Buildings
Districts High Schools
and Higher Education
Health Centers and
Hospitals
Others Total
Ganjam Numbers 7 152 77 236
INR million 1.94 51.24 27.18 80.36
US$ million 0.03 0.83 0.44 1.30
Puri Numbers 6 30 10 46
INR million 1.66 10.11 3.53 15.30
US$ million 0.03 0.16 0.06 0.25
Khordha Numbers 1 15 8 24
INR million 0.19 5.14 2.73 8.06
US$ million 0.00 0.08 0.04 0.12
Other Districts Numbers 2 134 73 209
INR million 0.43 45.28 25.86 71.57
US$ million 0.01 0.73 0.42 1.15
Total Numbers 16 331 168 515
INR million 4.22 111.77 59.30 175.29
US$ million 0.07 1.80 0.96 2.82
3.3 Damage to Heritage Monuments
13. Odisha has a rich cultural heritage with 218 monuments protected by the State Archaeological Department and 78 monuments and sites protected by Archaeological Survey of India
10. Apart from these, large numbers of monuments (more than 3,000) are unprotected and were found in a dilapidated condition. The coastal areas of the State are also dotted with large numbers of standing monuments in a poor state of preservation.
Table 11: Damage to Heritage Monuments
11S. No. Monuments Districts Block Nature of Damage 1 Jagannath Temple,
Pentha
Khordha Rajnagar Crack developed on the connecting structure of the old kitchen room and temple which is not conserved so far
2 Bhabakundaleswar Temple,
Manikpatna
Puri Krushnaprasad There is no structural damage, but branches of the banyan tree has been broken which has fallen on the scaffolding structure
3 British Cemetery Ganjam Ganjam 30 feet length of existing compound wall is fully damaged which has not been conserved so far 4 Bateswar Temple,
Kantiagarh
Ganjam Kantiagarh Sand deposited on the excavated work site about 162.00 cum
5 Ganjam Fort Ganjam Ganjam 15 feet length of existing dilapidated brick masonry wall of the ruined palace is fully damaged which has not been conserved so far and 111 feet length of the wall of the ruined palace is partially disturbed from its original position due to velocity of cyclone Phailin and the rains.
Reconstruction Needs
14. In the case of heritage monuments the estimates as provided by the report of the Nodal Offi cer Culture, Integrated Coastal Zone Management Project (ICZMP) has been used. The estimates consider basic repair and restoration and are very preliminary. The exact details of restoration/preservation works is still being worked out and would require more technical assessment.
Table 12: Estimated Cost for Heritage Monuments
S. No Monuments INR US$
1 Jagannath Temple, Pentha 10,000 161
2 Bhabakundaleswar Temple, Manikpatna 20,000 323
3 British Cemetry 50,000 806
4 Bateswar Temple, Kantiagarh 20,000 323
5 Ganjam Fort 400,000 6,452
Total 500,000 8,065
10
Archaeological Survey of India.
11
Cyclone damage report of the Monuments of 12-10-2013 and 13-10-2013 under ICZMP, Odisha, Bhubaneswar
was prepared by Nodal Offi cer Culture, Integrated Coastal Zone Management Project (ICZMP).
3.4 Roads
15. The major effect of the cyclone and fl oods on the roads was damage to the embankments, road shoulders and the pavement caused by rain cuts and inundation.
Another immediate effect was road blockage due to the falling of trees caused by high wind speeds. The Departments of Works, Rural Development, Panchayati Raj and Housing and Urban Development took immediate steps for cutting the fallen trees and clearing the
roads to restore connectivity. JCB’s and other heavy earth moving equipment were used to clear the roads. The Police, ODRAF, NDRF, and Fire Service units along with other inter-departments coordinated the clearing and most of the roads up to the Block level were cleared within 2 days.
16. The extent of damage and reconstruction needs is based on the Cyclone Damage Report (CDR) and Flood Damage Report (FDR) prepared by the Roads & Buildings department and a consolidated summary of district-wise damage provided by the Rural Works department. The disaggregated damage assessment and reconstruction needs by type of roads such as State Highways (SH), Major District Roads (MDR), Other District Roads (ODR), and village/rural roads (including PMGSY) has not been presented due to lack of complete data at the time of this report. The State government estimates are preliminary in nature and would require additional fi eld surveys and investigations for a realistic and engineering assessment. Moreover, while the reconstruction needs mentioned below is essentially to restore the road network to a pre-disaster condition, additional fi nancing for ‘building back smarter’ would be necessary to build a disaster-resistant road network in the State.
Table 13: Damages to Roads
Districts Roads & Buildings Department Rural Works Department Roads
(Km)
No. of Breaches
No. of CD Roads (Km)
No. of Breaches
No. of CD
Ganjam 321.40 77 94 2,450 112 106
Khordha 116.74 2 81 211 14 3
Puri 46.88 9 24 600 5 6
Other Districts 1,451.34 88 573 4,838 169 135
Total 1,936.36 176 772 8,099 300 250
Table 14: Estimated Cost for Reconstruction
Districts Roads and Buildings
Department
Rural Works Department
Total (INR M)
Ganjam 326.99 837.70 1,164.69
Khordha 45.40 451.60 497.00
Puri 123.00 352.00 475.00
Other Districts 2,009.78 2,861.40 4,871.18
State Total (INR M) 2,505.17 4,502.70 7,007.87
State Total (USD M) 40.41 72.62 113.03
17. As Odisha is susceptible to frequent cyclones, the restoration works need to incorporate disaster resilient design features such as raising embankments, wherever necessary, and incorporation of adequate protection and river training work. This is particularly important as roads and bridges also serve as a lifeline to the villages and communities during cyclones and disasters.
3.5 Urban and Rural Infrastructure (Water Supply, Roads, Drains and Sewerage)
18. Odisha is one of the least urbanized states in India. As per the 2011 census 6.99 million people, or 17% of the total state population, live in urban areas. The last decade has however seen a growth of almost 25% in terms of the urban population, higher than the national average.
There are 103 Urban Local Bodies (ULBs) including 3 Municipal Corporations of Bhubaneswar, Cuttack
and Berhampur, 37 Municipalities, 63 Notifi ed Area Councils and 2 census towns. Almost 55% of the urban population lives in the capital Bhubaneswar and the two cities of Cuttack and Berhampur. Many of the cities and towns in Odisha are popular tourist destinations because of the large number of temples. They are also hubs of educational institutions.
Recovery Needs
19. The Urban water supply has been affected in Berhampur town located in Ganjam
district. After emergency interventions, the drinking water supply has been restored but
the replacement of the pumping/gravity mains of 23 km length is required as medium and long-term interventions. The urban water supply in the other six affected towns in the three districts has been brought to normal supply levels after interventions by respective government organizations.
20. Besides damaging the water supply network, the fl oods have also washed away or destroyed about 245 km of urban roads (in 7 ULBs in the three districts) and 66.6 km of roadside drains. Damage has occurred to other categories of roads on account of the bituminous top and metal layer getting washed off and disturbance to the top crust of Water Bound Macadam (WBM) Roads. Concrete roads have seen less damage than others. Roads have also been damaged due to the uprooting of nearby trees causing disturbance to the road base and drain walls, etc. However, the impact of the damages to urban roads and road side drains are not signifi cant and have not disrupted the regular traffi c. The district-wise break up of damages is given in the Table 15 below:
Table 15: Summary of Damage to Urban infrastructure Districts/affected
towns
Roads (km)
Drains (km)
Street Lights (Nos)
Water Supply Sources (Nos)
Water Supply
Pipes (km)
Sanitation/
Solid Waste (Nos)
Ganjam 82.90 57.20 250 3 32.50 0
Berhampur 69.65 53.30 0 1 23.00 0
Chetrapur 6.12 2.50 250 1 7.00 0
Ganjam 7.13 1.40 0 1 2.50 0
Puri 95.20 3.60 0 2 0 0
Puri Municipality 78.60 3.60 0 1 0 0
Konark NAC 16.60 0 0 1 0 0
Khordha 67.00 5.80 0 2 0 0
Balugaon 50.00 2.80 0 1 0 0
Banpur 17.00 3.00 0 1 0 0
Others Districts 0 0 0 37 0 0
Total 245.10 66.60 250 44 32.50 0
Note: Based on data received from Ganjam, Puri and Khordha as on December 2, 2013
Reconstruction Needs
21. While estimating the need for the rehabilitation of the water supply component of individual towns, the following basic service standards have been considered, keeping the network coverage the same. While estimating the need for road reconstruction, most of the ULBs have proposed concrete roads to avoid future damage from rains and fl ooding.
Culverts have been damaged in some areas, the replacement cost of which is estimated to
be INR 3.4 million or about US$ 55,000.
Table 16: Summary of Preliminary Estimation of Damage to Urban Infrastructure Districts Water Supply Urban Roads and Drains Sewerage/
Sanitation/ Street Lighting
Total No. of
Affected Towns
Reconstruction cost (INR M)
Reconstruction Costs No. of
Affected Towns
Damage (INR M)
Road Drains No of Schemes
Damage (INR M)
INR M US$ M
Ganjam 3 404.27 3 520.68 484.25 1 6.6 1,415.80 22.84
Berhampur 1 237.8 1 487.55 463.75 0 0
Chetrapur 1 96.4 1 15.30 15.9 0 6.6
Ganjam 1 70.07 1 17.83 4.60 0 0
Puri 2 4.05 2 274.47 32.4 0 0 310.92 5.01
Puri Municipality
1 3.76 1 232.97 32.4 0 0
Konark NAC 1 0.29 1 41.50 0 0 0
Khordha 2 0.64 2 170.00 22.40 0 0 193.04 3.11
Balugaon 1 0.28 1 127.50 12.40 0 0
Banpur 1 0.36 1 42.50 10.00 0 0
Others Districts
37 18.19 0 0 0 0 0 18.19 0.29
Total 44 427.15 7 965.15 539.05 1 6.6 1,937.95 31.25
Assumptions: *Per capita water supply need assumed as 70 lpcd for ULB upto population of 10,000; 100 lpcd for population between 10,000 to 50,000 and 135 lpcd for population above 50,000.
**Cost for 6 meter wide concrete road is INR 7000/m and for 3 meter wide concrete road is INR 2500/m.
3.5.1 Rural Water Supply and Sanitation
22. Ensuring safe drinking water is a major challenge in Odisha as the coastal areas are subjected to frequent cyclones and fl oods due to heavy rains,and ground water quality is affected by the increase of salinity, fl uoride and iron contamination. In the state 35 million people are living in rural habitations and are being provided drinking water, fully or partially by the Rural Water Supply Department under the Ministry of Rural Development. 20% of the habitations are covered by piped water supply systems and 50% by hand pumps/bore wells.
23. The recent Phailin cyclone followed by heavy rains causing fl oods have severely
affected the existing rural infrastructure crippling access to basic services, particularly
water and sanitation in 18,374 habitations located in 18 districts. A total of 3,040 piped
water supply systems and 162,170 tube/bore wells were damaged. Providing safe drinking
water still remains a major challenge in some of the affected areas which can be addressed
if the long-term interventions are initiated.
Table 17: District-wise status and impact of damaged Rural Water Supply Schemes Districts Total no.
of existing schemes
Estimated cost of damages
INR M
No. of damaged schemes Affected habitation/population/
Households
Fully Partially Total Habitation Population Household
Ganjam 971 2,000 648 323 971 1,060 500,000 120,000
Puri 243 213 235 8 243 3,222 700,369 133,493
Khordha 350 204 122 228 350 4,507 1,103,000 228,000
Other Districts
1,476 343 506 970 1,476 6,040 1,409,500 262,200
Total 3,040 2,760 1,511 1,529 3,040 14,829 3,712,869 743,693
24. Rural drinking water systems around the Chilika lagoon, comprising of revenue villages from three districts, Ganjam, Puri and Khordha,were the worst effected. Around 2,500 RWSS and 140,000 tube-wells were damaged/submerged due to the consequent fl oods. The quality of groundwater is the major concern due to the rise in fl uoride and salinity levels to 3.64 mg/l and 2500 mg/l respectively.
25. The Rural Water Supply Department restored water supply in the groundwater affected rural areas after the cyclone, but the quality of water being supplied is a major concern. As a risk mitigation measure, four multi-village Rural Water Supply Schemes are proposed to serve around 279 villages in Ganjam and Puri.
Table 18: Reconstruction Cost for Rural Water Supply and Sanitation Districts Multi-village
Rural Water Supply System
Sanitation Hand Pumps Total (Water Supply and
Sanitation) INR M US$ M INR M US$ M INR M US$M INR M US$ M
Ganjam 1,000.00 16.13 0 0 0 0 1,000.00 16.13
Puri 1,762.50 28.43 0 0 0 0 1,762.50 28.43
Khordha 0 0 0 0 0 0 0 0
Other districts 0 0 0 0 0 0 0 0
Total 2,762.50 44.56 0 0 0 0 2,762.50 44.56
3.6 Agriculture and Livestock
26. In Odisha the agriculture and animal husbandry sectors contribute about 15% of
the State Gross Domestic Product. More than 70% of the state population is dependent
on these sectors. Of the total geographical area of 15.57 million hectares (mha), the total
cultivated area is about 6.2 million ha (40%) and about 35% of the cultivated land is
irrigated. The majority of farmers are small and marginal having limited purchasing power
and low literacy. Paddy and pulses are major crops covering 50% and 25% of the cultivated
area respectively and the rest of the cultivated area is covered by other crops i.e. cereals
(6%), oil seeds (10%), fi bers (1.5%), sugarcane (0.5%) and others (7%). Odisha generally
has a surplus of rice and cereals and is defi cient in pulses and oil seeds.
27. The very severe cyclonic storm “Phailin”
on October 12, followed by torrential rains caused severe crop damage due to the submergence of crop fi elds. Reservoirs for different irrigation projects also released excess water at the same time to accommodate incoming fl oods that led to the prolonged submergence of the
affected areas. The districts of Ganjam, Puri, Khordha, Gajapati, Balasore and Mayurbhanj were badly affected. Crops were also affected in Nayagarh, Cuttack, Jajpur, Kendrapada, Jagatsinghpur and Bhadrak districts to a signifi cant extent.
Damage Assessment
28. As per the assessment completed by the Department of Agriculture, the total crop area affected by the cyclone and fl oods in the State was estimated at 1.3 mha out of a total area of 6.11 mha under the kharif crop, of which 0.78 mha has sustained more than 50% loss. The damage to the agriculture sector is mainly due to loss of standing crops from prolonged submergence and damage to agriculture infrastructure. In the three most severely affected districts of Ganjam, Puri and Khordha, the total crop area affected was reported to be 0.59 mha.
Table 19: Agriculture Lands Affected Districts Total Crop
Coverage Area (ha)
Total Affected Crop Area
(ha)
Total Area where Crop Loss is more than 50% (ha) Rain fed Irrigated Perennial Total
Ganjam 408,541 376,026 92,546 142,935 8,029 243,510
Puri 160,712 141,271 47,290 46,030 890 94,210
Khordha 123,518 75,301 39,025 17,244 175 56,444
Other Districts 3,567,281 700,369 333,615 52,807 2,403 388,825
Total 4,260,052 1,292,967 512,476 259,016 11,497 782,989
Source: Department of Agriculture.
Recovery Needs
29. Based on the reports,total damages in direct losses in the three most affected districts
were estimated at INR 10,215.48 million (US$ 164.77 million). According to estimates,
the main damage is due to prolonged submergence of land, which lasted upto 10 days in
Ganjam. While detailed assessments are in progress, the state government has initiated provisions for relief to the affected farmers.
Table 20: District wise Estimated Loss to Agriculture Sector
Districts Estimated Loss to Crop Loss to Infrastructure Total
INR M US$ M INR M US$ M INR M US$ M
Ganjam 6,680.29 107.75 52.5 0.85 6,732.79 108.59
Puri 2,345.06 37.82 0 0.00 2,345.06 37.82
Khordha 1,137.63 18.35 0 0.00 1,137.63 18.35
Other Districts 7,622.55 122.94 0 0.00 7,622.55 122.94
Total 17,785.53 286.86 52.5 0.85 17,838.03 287.71
3.6.1 Horticulture
30. The agro-climatic diversity in the state is suitable for growing a variety of horticultural crops:(i) perennial fruit crops like mango, litchi, guava, oranges and limes; (ii) annual fruit crops like banana, pineapple and papaya; (iii) spices like ginger, turmeric and chilli; and (iv) a variety of roots and tubers and a wide range of vegetables. In Ganjam district the major horticultural crops grown are cashew, mango, coconut, banana, kewda
12, fl oriculture, spices, and vegetable crops like tomato, cole (or stem and cabbage) crops, brinjal, greens, okra, cucumber, and different type of gourds.
Table 21: Horticulture Crop Production Details 2010-11
S.No. Type of Crop Area
(1000 Ha)
Production (1000 MT)
Remarks
1 Coconut 51.0 190.0
2 Dry fruit 149.0 91.0 Cashew nut
3 Fresh Fruit 320.7 2,048.3 Mango, Guava, Citrus, Litchi,
Sapota, Banana, Papaya, Pineapple, Pomegranate, others
4 Vegetables 553.8 7,790.1
5 Spices 124.0 174.7
6 Floricultural crops 7.4 3.7 and 5,911
lakh cut fl ower
Rose, Gladiaoli, Tube rose and Marigold
Total 1,205.9
Source: Indian Horticulture Database 2011, National Horticulture Board.
Damage Assessment
31. The disaster has caused widespread devastation to this sector; fruit and vegetable cultivations have been severely affected. An estimated area of about 43,400 ha under horticulture has been affected.
12