The economic effects of Erasmus+ on the Slovenian economy
Jan Kluge Alexander Schnabl
Study commissioned by Center RS za mobilnost in evropske programe izobraževanja in usposabljanja (CMEPIUS)
Authors
Jan Kluge, Alexander Schnabl Title
The economic effects of Erasmus+ on the Slovenian economy Contact
T +43 1 59991-225 E kluge@ihs.ac.at
Institut für Höhere Studien – Institute for Advanced Studies (IHS) Josefstädter Straße 39, A-1080 Vienna
T +43 1 59991-0 F +43 1 59991-555 www.ihs.ac.at ZVR: 066207973
To the best of our ability and belief, all information contained in this publication is accurate and reliable. Nonetheless, all content is provided without any guarantee. The IHS is not liable for the content or contributions of this report.
Executive Summary
Erasmus+ promotes the cross-country mobility of learners and staff in various fields of education and training. The programme has also gained attraction in Slovenia.
Thousands of mostly young people took part, either as an “incoming” to Slovenia or an
“outgoing”, in 2018. Even though the main aims of Erasmus+ are not economic ones, the moving of people around Europe leads to financial flows between countries that trigger economic and fiscal effects.
The Institute of Advanced Studies (IHS) in Vienna – commissioned by the Slovenian program agency CMEPIUS – has conducted a study to estimate the effects of Erasmus+
on the Slovenian economy, in particular on gross value added (GVA), employment and fiscal revenues. The results can be summarised as follows:
8,747 incoming participants have spent time in Slovenia during 2018. Most of them were students in higher education, followed by learners in vocational training. Their main destination was Ljubljana. Half of all incomings came from Spain, Germany, France, Croatia, Poland, Czech Republic and Italy.
The incomings in 2018 spent 11.4 million Euros on consumption during their stay in Slovenia (plus travel costs). The overall GVA effect resulting from that amounts to almost 15.7 million Euros. However, as a variety of goods and services must be imported from other countries, the domestic effect for Slovenia is only 9.7 million Euros.
Erasmus+ works in both directions. In 2018, there were 7,153 participants who left Slovenia for a certain period. This resulted in an expenditure gap for Slovenia of about 5.7 million Euros. This reduction must be considered for the computation of economic effects. The corrected GVA effect for Slovenia reduces to 5.8 million Euros.
For the final effects, we also consider organisational support payments that are given to Slovenian education facilities in order to manage their outgoing mobilities. This support added up to 1.7 million Euros. Taking this into account, the domestic GVA effect settles at 7.8 million Euros.
The GVA of 7.8 million Euros that is attached to Erasmus+ supports 194 jobs in Slovenia; 47 of them directly in the education sector. The fiscal effects add up to 3.1 million Euros in taxes and social insurance contributions.
The sectors that benefit most from Erasmus+ are education services, the sectors that are concerned with short- and long-term accommodation of incomings as well as the transport and trade sectors.
Table of Contents
Executive Summary ... 3
1 Background ... 5
2 Method ... 6
3 Erasmus+ in Slovenia ... 7
3.1 Incomings ... 7
3.1.1 General observations ... 7
3.1.2 Expenditure structure of incoming participants ... 10
3.2 Outgoings ... 12
3.2.1 General observations ... 12
3.2.2 Expenditure structure of outgoing participants ... 13
3.3 Other aspects of Erasmus+ to consider ... 14
4 Results ... 15
4.1 Effects of Incomings ... 15
4.2 Effects of Incomings minus Outgoings ... 16
4.3 Effects of Incomings minus Outgoings plus organisational support ... 16
4.4 Most benefiting industries ... 17
4.5 Higher and non-higher education ... 18
4.6 Brief comparison to the Austrian study ... 19
5 Conclusion ... 20
6 Lists ... 21
6.1 List of Figures ... 21
6.2 List of Tables ... 21
6.3 Bibliography ... 22
7 Appendix ... 23
1 Background
Despite the everlasting scepticism about the European Union (EU), the Erasmus+
program has always been a popular piece of infrastructure as it creates truly positive European experiences, especially for younger people no matter where they live in the EU. Consequently, the commission has pushed Erasmus from a mere student exchange program to Erasmus+ as an integrative concept including all kinds of education, training, youth and sports initiatives. It covers not only EU member states but also a wide range of partner countries all over the world. Given its major impact on society and its iconic embodiment of the European idea, the budget seems rather reasonable:
The EU has planned an amount of 16.5 billion Euros for the whole period 2014-2020, but aims at increasing the financial effort dramatically for the period till 2027.1
The main aims of Erasmus+ are socio-economic ones, as it fosters education and training activities. In doing so, the program provides valuable support for the aim of the free and efficient movement of labour within the EU.
Besides its main aims, however, Erasmus+ generates economic side effects as it channels money from the EU budget into the pockets of participants and back to the member states who welcome them. They spend the grant (and most likely additional money out of their own savings) during their stay in a guest country in which they are seen as “incomings”, but at the same time do not consume much in their home countries where they are seen as “outgoings”. This shifting of people between countries in the EU triggers measurable effects on all kinds of economic activities.
This study – commissioned by the Slovenian program agency CMEPIUS and conducted by the Institute for Advanced Studies (IHS) in Vienna, Austria – is supposed to estimate such economic and also fiscal effects for the Slovenian economy. The IHS conducted a study of this kind before for the Austrian agency OeAD (see KLUGE ET AL. (2018)). By means of an input-output analysis, it concluded that the mobilities requested in 2014 triggered a (net) value added effect of 12.4 million Euros (incoming effect corrected for the outgoing effect); this supported a total of nearly 200 jobs in Austria.
The study at hand uses the Austrian study as a blueprint and aims at replicating it for Slovenia. The following section will explain the methodology; the subsequent sections will display the data and assumptions needed for computation. Section 4 will show and interpret the results before the last section will draw a conclusion.
__________________________________________________
1 http://europa.eu/rapid/press-release_IP-18-3948_en.htm
2 Method
In order to compute the economic effects of Erasmus+ on the Slovenian economy, we make use of input-output analysis. The method is based on the work by LEONTIEF
(1936), who thought of an economy as a system of sectors that absorb and render flows of goods and services. His central concept was that a primary demand will induce further demands for intermediate inputs. These intermediate inputs are purchased domestically or from abroad and, in turn, generate a cascade of further intermediate input purchases along the entire value added chain.
Input-output analysis allows the computation of direct, indirect and induced gross value added (GVA), employment and fiscal effects caused by a demand for particular goods or services. Direct effects are generated by expenditures in a particular sector of the economy, e. g. when some investment project in industry x is to be evaluated. The expenditures that are relevant for the study at hand, however, are not conducted by a particular sector or company, but are consumption expenses that flow from Erasmus+
incomings to a variety of different sectors (e. g. retailers, real estate companies or transport services). Hence, there are no direct effects by definition. The additional demand in many sectors will lead them to hire more employees and to purchase more intermediate products. In turn, their suppliers will have to employ more people and to increase their intermediate consumption etc. These effects are called indirect. In order to meet the additional demand, sectors across the value added chain will have to make additional investments; the new employees will spend their income for consumption.
These kinds of effects are called (investment- resp. consumption-) induced.
This type of analysis requires detailed input-output tables that show the linkages between the sectors of an economy. Such tables are part of the national accounts and provided by the STATISTICAL OFFICE OF THE REPUBLIC OF SLOVENIA (2018A). They also provide information on which goods and services are produced domestically and which are purchased on foreign markets. Hence, we can distinguish the share of expenditures that stays in Slovenia and the one that, at some point, flows abroad in exchange for imported (intermediate) goods and services.
We will use input-output analysis in order to quantify the economic effects of Erasmus+ in Slovenia and will report GVA, employment and fiscal effects as well as the most benefiting sectors according to the NACE classification.2
__________________________________________________
2 NACE = Nomenclature statistique des activités économiques dans la Communauté européenne.
3 Erasmus+ in Slovenia
Slovenia joined Erasmus in 1999; hence, it was a partner country in the Erasmus program even before it joined the EU in 2004. Since then, participation rates have gone up massively, both incoming as well as outgoing. Both kinds of mobilities are important for the study at hand: Students and staff who are on incoming mobilities spend money in Slovenia for accommodation, food, transport or study-related items, while outgoing participants take their money abroad. Hence, it is of major importance for the computation of economic and fiscal effects to have knowledge about how Erasmus+ in Slovenia looks like: How many participants come to or leave Slovenia in a given year?
How much do they spend and on what?
The answers to these questions can be interpreted as the “input” for our input-output- analysis and will be outlined in the following chapter. Some of the required inputs are based on official statistics based on the data set provided to us by CMEPIUS or public data provided by the STATISTICAL OFFICE OF THE REPUBLIC OF SLOVENIA; others must necessarily follow reasonable assumptions. In order to lend credibility to the results of this study, especially these assumptions will be described as precisely as possible.
While Erasmus+ generally includes many types of activities, the scope of this study is restricted to Key Actions 1 (i. e. “Mobility of Individuals”) and 2 (i. e. “Cooperation for Innovation and Exchange of Good Practices”), which cover the vast majority of mobilities. The smaller Key Action 3 “Support for Policy Reform”, excellence initiatives like Jean Monnet activities and the sports action are not included in this study.
In accordance with CMEPIUS, we have defined the year 2018 as our relevant observation period. We consider each day that international participants spent in Slovenia in 2018 (as well as the days participants from Slovenia spent abroad during the same period).
3.1 Incomings
3.1.1 General observations
No less than 8,747 Erasmus+ participants spent time in Slovenia during the course of the year 2018.3 We can roughly classify them into learners and staff in four areas:
__________________________________________________
3 Including all participants who spent at least one day in Slovenia in 2018. Some of them might have started their stay in 2017, some may have returned not before 2019. We will only count the days between January and December 2018.
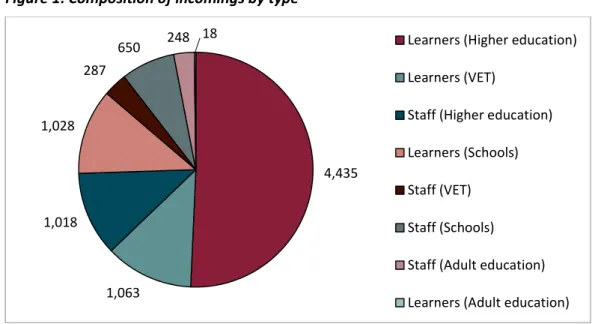
Schooling, vocational education and training (abbr.: VET), higher education and adult education. Figure 1 shows the respective incoming numbers for those eight types of mobilities. About half of them were students (learners in higher education), followed by the three groups VET learners, pupils and higher education staff. Hence, the higher education sector is affected the most by Erasmus+ (very likely due to historical reasons); adult education and training plays only a minor role. The respective incomings differ strongly in terms of how they come to Slovenia: Most students, lecturers and VET learners come individually under Key Action 1. The (mostly underage) pupils, however, come in groups together with their teachers under Key Action 2 in order to take part in pre-organised exchange programs.
Figure 1: Composition of incomings by type
Source: IHS, CMEPIUS.
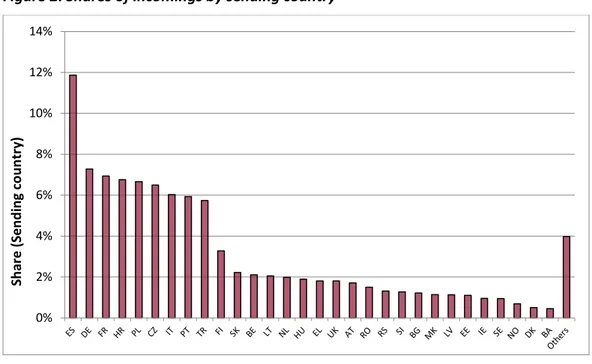
Figure 2 displays where most participants came from. Obviously, Slovenia is very popular with Spaniards; about 12 % of all incomings in 2018 came from Spanish education facilities. Also Eastern European facilities sent many participants; Croatia, Poland and the Czech Republic accounted for 7 % each. Almost 6 % came from Turkey, a non-EU but program country of Erasmus+. Also, a few of the partner countries sent considerable numbers of participants to Slovenia, e. g. the Republic of Serbia (1.3 %) and (the formerly called) Macedonia (1.1 %).
Half of the Erasmus+ incomings to Slovenia went to the statistical region of Osrednjeslovenska (mostly to Ljubljana), another quarter went to Podravska region (mostly to Maribor). The rest is distributed all over the country. While higher education mobilities are necessarily linked to larger university cities, all other kinds of Erasmus+
incomings might choose more rural locations, as companies (e. g. for VET learners) or schools (e. g. for pupils) are available all over Slovenia.
4,435
1,063 1,018
1,028 287
650 248 18 Learners (Higher education)
Learners (VET)
Staff (Higher education) Learners (Schools) Staff (VET) Staff (Schools)
Staff (Adult education) Learners (Adult education)
Figure 2: Shares of incomings by sending country
Source: IHS, CMEPIUS.
The lengths of stay (measured only within 2018) differed massively. They ranged from a single day to a whole year. The average length of stay was 52 days; all together, the Erasmus+ incomings spent 1,251 person-years in Slovenia. Figure 3 shows that the types of participants differed severely in terms of durations.
Figure 3: Average length of stay in Slovenia (by groups)
Source: IHS, CMEPIUS. Note: The dots mark the respective means; the lines depict the span between the 5 % and the 95 % percentile. The durations have not been truncated here to the year 2018 as this would yield a distorted picture. For the economic computations, however, any overlaps between 2017/18 and 2018/19 have been excluded.
0%
2%
4%
6%
8%
10%
12%
14%
Share (Sending country)
0 50 100 150 200 250 300
Learners (Higher education)
Learners (VET)
Staff (Higher education)
Learners (Schools)
Staff (VET) Staff (Schools)
Staff (Adult education)
Learners (Adult education)
Days
We find that only students (learners at universities) execute mobilities of longer durations. Most of them stay for a whole semester or even longer; on average five months. The minimum stay for students (required by the Erasmus+ regulations) is usually two months. All other participants stay much shorter in their guest country.
While most VET learners stay up to several months, basically none of the remaining participants (including all teaching staff) spent more than a few days in Slovenia.
3.1.2 Expenditure structure of incoming participants
It seems straightforward that incoming participants who stay longer in Slovenia will differ strongly from those who spend just a few days. The former will have some kind of housing arrangement in Slovenia; many of them might quit lease contracts in their home country, buy insurance contracts in Slovenia or even bring their children. Short- term incomings, in contrast, might only spend a few nights in a hotel, eat mainly in restaurants and, hence, be very close to the expenditure behaviour of tourists.
Furthermore, there might be differences between types of incomings as their financial means and preferences differ considerably, e. g. between pupils and professors.
The observation made in the last section, that only university and VET learners stay for longer periods during their incoming mobilities (we define longer as more than 30 days)4, massively simplifies our reasoning concerning their expenditures. Students and VET learners can be seen as pretty similar in terms of age, financial endowments and consumer preferences. We, therefore, assume that they follow the expenditure behaviour captured in the EUROSTUDENT VI Database5 which collects a wide range of information on the socio-economic situation of students in Europe. According to this source, students in Slovenia who do not live with their parents and who are not domestic but international students spend on average € 515.10 per month. This is slightly less than what domestic students spend (€ 543.20) and comprises mostly living costs and a smaller share of study-related costs.
Table 1 shows what these individuals spend their money on. Not surprisingly, students spend most of their money on accommodation, food and social or leisure activities.
International students pay significantly more for accommodation as they might live in more expensive short-term lease arrangements but seem otherwise slightly more parsimonious.
__________________________________________________
4 This cut-off point seems somewhat arbitrary, but the results are not too sensitive to this choice. Incomings whose stay exceeds a few days usually stay for several months. The cut-off successfully distinguishes between the two groups.
5http://database.eurostudent.eu/. The database is fed by national higher education research units. In the case of Slovenia that is the Ministry of Education, Science and Sport and the Slovenian Student Union.
Table 1: Monthly expenditures of students in Slovenia
Types of students
Item international domestic
Living costs
Accommodation 185.00 € 164.60 €
Food 109.90 € 113.40 €
Tranportation 32.30 € 53.50 €
Communication 18.10 € 27.70 €
Health (e.g. medical insurance) 11.00 € 13.50 €
Childcare 15.30 € 17.90 €
Debt payments (except mortgage) 5.00 € 14.30 €
Social and leisure activities 39.30 € 44.30 €
Other regular living costs 53.10 € 52.70 €
Study-related costs
Fees 32.50 € 29.30 €
Learning materials 10.50 € 9.10 €
Other regular study-related costs 3.10 € 2.90 €
∑ 515.10 € 543.20 €
Source: EUROSTUDENT VI, F.74 - F.100. Note: These numbers include amounts that are “paid by others”. The survey was conducted between April and June 2016.
In this study, we will basically apply this expenditure structure of international students to the Erasmus+ incomings. This approach leaves certainly room for criticism because the EUROSTUDENT figures include students from all over the world while Erasmus+
incomings are mostly from Europe and might, therefore, be expected to be slightly better financially endowed. On the other hand, many of the incoming participants are from Eastern European countries with lower income than Slovenia (see Figure 2), so they would be expected to spend rather less than the average European incoming or domestic Slovenian student. Consequently (and in the absence of a more reasonable data source), we will stick to EUROSTUDENT and take this expenditure structure as given.
However, we assume that Erasmus+ incomings will not have to make debt payments to Slovenian banks. Also, they are usually exempt from any study-related fees in their guest country. The remaining items, however, will have to be consumed in Slovenia.
The categories “social and leisure activities”, “other regular living costs” and “other regular study-related costs” will be assumed to follow the general final demand pattern in Slovenia which we take from the official input-output tables (see STATISTICAL
OFFICE OF THE REPUBLIC OF SLOVENIA (2018A)).
These assumptions are expected to be reasonable for both university and VET learners who stay for longer than 30 days. As they are the only groups who stay for such long periods, we can refrain from dealing with other types of incomings who would have very different expenditure structures (e. g. pupils, teachers or professors).
However, as far as the shorter stays (up to 30 days) are concerned, they can apply to all eight groups of incomings. As mentioned above, these short stays will be characterized by expenditure structures that equal those of tourists, pretty much irrespective of the kind of participant (students, teachers etc). Their amount of money spent per day will be much higher due to the more expensive accommodation. We make use of official statistics about tourism in Slovenia and assume that incomings who stay up to 30 days spend on average € 98.73 per day (see STATISTICAL OFFICE OF THE REPUBLIC OF SLOVENIA
(2018B);6 two thirds account for accommodation and food, the rest will be assumed to follow the general consumption behaviour in Slovenia (as before, see STATISTICAL OFFICE OF THE REPUBLIC OF SLOVENIA (2018A)).
Given these considerations, we assume that Erasmus+ incomings brought 11.4 million Euros to Slovenia in 2018. Two thirds applied to the expenditures conducted by those who stayed for more than one month.
3.2 Outgoings
3.2.1 General observations
While incoming participants spend money while they are in their guest country and thereby trigger economic and fiscal effects, those Erasmus+ participants who leave the country for a particular length of time take their money abroad and thereby reduce the overall Erasmus+ effects for Slovenia. Hence, it is important to make similar considerations for the outgoings like in Section 3.1.
The official CMEPIUS data set shows, that 7,153 individuals spent at least one day outside Slovenia in 2018. Their composition is pretty similar to the incomings to Slovenia; we, therefore, refrain from showing the same figures again. A few differences, however, catch the eye: The share of students among the outgoings is slightly smaller; the one of VET learners is higher. The latter stay abroad for shorter periods than VET learners in Slovenia; outgoing students stay a few days longer than
__________________________________________________
6 We use this figure, even though it includes travelers who stay in campsites. This might not apply to Erasmus+
incomings; however, we believe that a focus on hotel tourists only (who spend about € 116 per day) would overestimate the financial endowments of a typical Erasmus+ incoming.
incoming students. The sympathy for Spain is mutual; most outgoings from Slovenia go to Spanish facilities.
3.2.2 Expenditure structure of outgoing participants
The reasoning concerning the expenditure structure of outgoings is now completely different than before. In Section 3.1.2 we were interested in how much money incomings spend in their guest country (and on what). However, when it comes to outgoings, we do not need to know what they spend during their stay in Spain, Germany etc.; the only thing we need to know is what expenditures they no longer execute in their home country while they are away. Obviously, participants will only consume food, clothing, toiletries etc. where they reside at the moment. Other expenses, like debt payments or housing rents, will continue to be due in their home countries, even while they are away.
Again, we can distinguish between long-term mobilities, that apply only to students and VET learners, and short-term stays that apply to everyone. The starting point for our considerations about the long-term mobilities is what domestic students in Slovenia spend their money on. We take this information from EUROSTUDENT and showed it already in the right column of Table 1 on page 11. We can then make reasonable assumptions about how these items change when students go abroad: If the stay lasts shorter than two months, we assume that fixed housing costs (but not costs for electricity, water etc.) will continue to be paid in Slovenia.7 Also, child care expenses, costs for communication contracts, debt payments, study-related fees and parts of the transportation costs (even though no Slovenian public transportation will be used during the absence, e. g. due to monthly tickets) will stay in Slovenia. Hence, the main items that fall away are variable housing costs, food as well as social and leisure activities. We expect the same phenomenon for non-student outgoings, but at a higher level since staff has higher living standards than students. We use the final demand pattern in Slovenia (according to the STATISTICAL OFFICE OF THE REPUBLIC OF
SLOVENIA (2018A)) and make the respective short-term adjustments mentioned above.
If the stay lasts longer than two months (this can only apply to students), we assume that only debt payments and study-related fees must be paid in Slovenia. The remaining items are not domestically consumed during long-term outgoing mobilities.
__________________________________________________
7 Again, this cut-off point is arbitrary. However, the results are not very sensitive. Only 0.4 % of all non-student outgoings stay for more than two months. Contrarily, only 0.3 % of all student outgoings stay shorter than two months (due to the minimum durations in Erasmus+). Basically, we assume that all students stay long-term and all others stay short-term.
All in all, we assume that outgoing Erasmus+ participants in 2018 left an expenditure gap of about 5.7 million Euros in Slovenia. The magnitude of this decrease is considerably smaller than the amount additionally spent by incomings during the same period (= 11.4 million Euros, see Section 3.1.2). The reason is that the number of incomings was higher and that outgoings (especially when they stay only for a couple of days) do not cut back on all of their spending positions.
3.3 Other aspects of Erasmus+ to consider
This study focuses on the mobility of learners or staff between Slovenia and other countries. Each of these incoming or outgoing mobilities requires a sending and a receiving facility (e. g. schools, universities etc.). Especially the sending facility will face a certain amount of organisational effort that is partly reimbursed by the Erasmus+
program. For example, universities receive an “organisational support” of 350 Euros per outgoing student. They use this money, e. g., to staff their international offices that provide support for learners who are interested in planning an outgoing mobility.
We focus here only on the organisational support granted under Key Action 1 as only they are closely connected to the implementation of individual mobilities. As most Key Action 1 mobilities are carried out by students or VET learners, is it not surprising that most organisational support in 2018 was paid to higher education facilities (≈ 969,000 Euros ) and vocational schools (≈ 551,000 Euros). About 197,000 Euros went to schools and adult education facilities. Hence, 1.7 million Euros flow to the Slovenian educational sector per year due to the Erasmus+ program. They trigger economic and fiscal effects – just as the expenditures of Erasmus+ incomings – and will, therefore, be included in our computations in Section 4.
Finally, as Erasmus+ moves people all across Europe, it seems straightforward that transport costs are involved. Some participants receive travel grants, others do not. As we have not included any travel costs in the considerations above, we need to add them to the overall expenditures. Unfortunately, we have no information about the means of transportation by which participants travel to (or from) Slovenia; we will, therefore, model the transportation costs following a rather simplistic approach: We assume that every mobility to or from Slovenia is connected to an overall (round-trip) expenditure of 200 Euros; half of this shall be assumed to go to the Slovenian transport sector (50 % to air and 50 % to land transport). Hence, the 15,900 individuals who took part in Erasmus+ (with Slovenia either as guest or home country) spent an additional 1.59 million Euros to the Slovenian transport sector in 2018.
4 Results
The results are presented in the following chapters. The presentation starts with the economic effects of incoming Erasmus+ participants in Section 4.1. These figures must be corrected for the outgoing effects; these results will be presented in Section 4.2. We will take care of the organisational support paid to Slovenian education facilities in Section 4.3. The most benefiting industries will be presented in Section 4.4. Finally, the results section ends with a brief comparison of our findings to the above-mentioned Austrian study.
4.1 Effects of Incomings
The incoming results (including travel expenses) are presented in Table 2. The expenditures of international Erasmus+ participants in Slovenia trigger an annual overall GVA effect of 15.7 million Euros. A considerable part of this effect will, however, flow to other countries via imports of goods and services. The domestic GVA effect for Slovenia amounts to 9.7 million Euros. By definition, the direct effects are (as already mentioned in Section 2) zero. The consumption expenditures of Erasmus+
incomings in a variety of industries trigger indirect effects along the value chain of 10.8 million Euros (of which 7.5 million Euros are domestic). Higher incomes and investments in the Slovenian economy due to the consumption effects of Erasmus+
incomings lead to induced effects of 4.9 million Euros (of which 2.1 million Euros are domestic).
Table 2: Economic effects of Erasmus+ incomings
…of which
overall direct indirect induced Gross value added (GVA) (in mill. €) 15.69 0 10.75 4.94
Slovenia 9.67 0 7.54 2.13
Other countries 6.01 0 3.21 2.80
Employment effect
(= jobs per year in Slovenia) 198 0 156 43
Fiscal returns (in mill. €) 4.04 0 3.09 0.95
Taxes and dues 2.86 0 2.18 0.68
Social insurance 1.18 0 0.91 0.27
Source: IHS, 2019.
The Slovenian employment effect amounts to 198 jobs. Hence, almost 200 domestic jobs (and an undetermined amount of jobs abroad) are supported by the consumption
expenditures of Erasmus+ incomings. The annual fiscal returns amount to about 4.0 million Euros. Most of it goes to the Slovenian state via taxes and dues; about 1.2 million Euros are social insurance contributions.
4.2 Effects of Incomings minus Outgoings
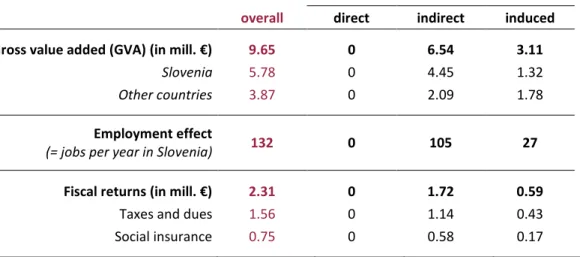
The figures presented in the last section are only hypothetical as they do not include the fact that there are also outgoings who spend their money abroad and are no longer available for domestic consumption in Slovenia. This will lower the results (even though the outgoings’ travel expenses will partly flow to Slovenian companies). The corrected numbers are shown in Table 3. The domestic GVA effect is now 5.8 million Euros which supports 132 jobs in Slovenia. The fiscal returns have decreased to 2.3 million Euros.
Table 3: Economic effects of Erasmus+ incomings minus outgoings
…of which
overall direct indirect induced
Gross value added (GVA) (in mill. €) 9.65 0 6.54 3.11
Slovenia 5.78 0 4.45 1.32
Other countries 3.87 0 2.09 1.78
Employment effect
(= jobs per year in Slovenia) 132 0 105 27
Fiscal returns (in mill. €) 2.31 0 1.72 0.59
Taxes and dues 1.56 0 1.14 0.43
Social insurance 0.75 0 0.58 0.17
Source: IHS, 2019.
4.3 Effects of Incomings minus Outgoings plus organisational support
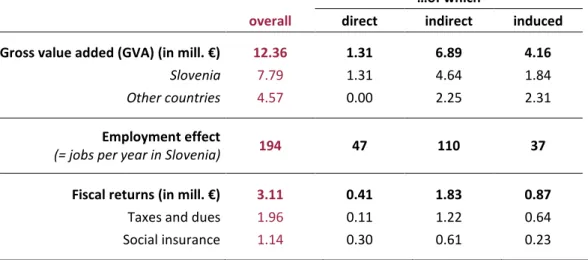
The last sections covered incomings and outgoings as well as their respective travel expenses. The final issue to consider is the organisational support paid to Slovenian education facilities. Their inclusion will now complete the picture and make the results increase again. The final results are presented in Table 4.
The annual domestic GVA effect for Slovenia settles at 7.8 million Euros. While the major effect remains indirect as it is triggered by consumption in various sectors of the economy, the organisational support now leads also to direct effects as this money is spent in a particular sector (here: the sector “Education services”). The employment
effects return almost to the numbers in Table 2: About 194 Slovenian jobs are supported through Erasmus+, 47 of them directly through the organisational support payments. The overall fiscal returns amount to 3.1 million Euros; 2.0 million Euros flow into the public budget, 1.1 million Euros are for social insurance.
Table 4: Economic effects of Erasmus+ incomings minus outgoings plus organisational support
…of which
overall direct indirect induced Gross value added (GVA) (in mill. €) 12.36 1.31 6.89 4.16
Slovenia 7.79 1.31 4.64 1.84
Other countries 4.57 0.00 2.25 2.31
Employment effect
(= jobs per year in Slovenia) 194 47 110 37
Fiscal returns (in mill. €) 3.11 0.41 1.83 0.87
Taxes and dues 1.96 0.11 1.22 0.64
Social insurance 1.14 0.30 0.61 0.23
Source: IHS, 2019.
4.4 Most benefiting industries
The ten sectors of the economy that benefit the most from Erasmus+ in Slovenia are presented in Table 5.
Is does not come as a surprise that “Education services” (NACE Code 85) is at the top of the table. This sector benefits mainly from the organisational support that goes to, e. g., universities. “Accommodation and food services” (NACE Code 55-56) benefits from those incomings who stay shorter periods; “Real estate services” (NACE Code 68) capitalise on those who stay in Slovenia for a longer time. It is a common observation that the latter generates a large amount of GVA using only very little employment.
Land transport services and the sectors concerned with retail and wholesale trade services benefit from the incomings’ consumption and travel expenditures.
It is worth noting that no sector will suffer from negative effects. Some are almost uninvolved, like e. g. fishing or water transport services. Negative effects, however, would only be likely in this setting if the number of outgoings would considerably exceed the number of incomings.
Table 5: Most affected industries (by NACE classification) Rank
(GVA) Rank
(Jobs) NACE Code GVA
(mill. €)
Jobs (p.a.)
1. 1. Education services 1.47 53
2. 2. Accommodation and food services 1.07 44
3. 20. Real estate services 1.07 2
4. 3. Land transport services and transport services via
pipelines 0.39 11
5. 4. Retail trade services, except of motor vehicles and
motorcycles 0.37 10
6. 5. Wholesale trade services, except of motor vehicles
and motorcycles 0.31 7
7. 18. Electricity, gas, steam and air conditioning 0.22 2
8. 37. Financial services, except insurance and pension
funding 0.21 1
9. 7. Employment services 0.18 4
10. 12. Legal and accounting services; services of head
offices; management consulting services 0.18 3
Remaining sectors 2.32 57
Overall 7.79 194
Source: IHS, 2019.
4.5 Higher and non-higher education
As Erasmus used to be a programme addressing higher education only, it seems interesting to see the role that the mobilities of students and professors play for the overall economic effects.8 The respective tables are provided in the Appendix (see Table 6 and Table 8 for higher education; Table 7 and Table 9 for non-higher education).
__________________________________________________
8 “Higher education” is defined here as key actions 103, 107 and 203.
At first glance, it seems surprising that higher education accounts for less than half of the overall effects, even though about 62 % of all incomings to Slovenia9 are in higher education (see Figure 1 on page 8). The reason is that higher education mobilities are mostly those by university students who stay abroad for longer periods. But the balance for short-term (i. e. mostly non-higher education) mobilities is usually more favourable for a country: Incomings spend large amounts per day due to expensive short-term accommodation, but the outgoings still pay e. g. their housing in Slovenia.
Long-term incomings, however, who are mostly from higher education, pay much less per day during their stay in Slovenia while long-term outgoings spend almost nothing at home. Accordingly, higher-education would make up for a much larger share of the economic effects if only incomings would be considered.
4.6 Brief comparison to the Austrian study
Even though this study cannot be directly compared to the one that was conducted for Erasmus+ in Austria, some conclusions can be drawn.
The overall gross value added effect for Austria was 12.4 million Euros (see KLUGE ET AL. (2018)). Is seems surprising that – even though the Slovenian population is less than a quarter of the Austrian – the GVA effect of 7.8 million Euros is far larger than one might have expected. There are basically three explanations for this effect: First, the observation periods differ. While the Austrian study included the mobilities requested in 2014, we use here the mobility days during the course of 2018. As the numbers of mobilities have been increasing in most member states during the last years, the Austrian results would most likely be higher when a more recent observation period could be applied. The second explanation is that the balance of incomings and outgoings in Slovenia was considerably higher than in Austria in recent years. The number of outgoings from Slovenia has even slightly decreased while the number of incomings kept rising. While this might not be good news from an education or human development perspective, it nonetheless gives higher economic effects as more money flows into the country. The third explanation is that the difference in expenditures between incomings and outgoings is rather small in Slovenia; potential outgoings (i. e.
domestic students) spend only 6 % more per month than incomings (i. e. international students). Outgoings from Austria (i. e. domestic students in Austria), however, spent about 14 % more per month than incomings (i. e. international students in Austria).
Hence, an outgoing is more “painful” for the Austrian than it is for the Slovenian
__________________________________________________
9 And almost 60 % of all outgoings from Slovenia.
economy. Together with the fact that Austria has almost as many outgoings than incomings, this depresses the Austrian results. Slovenia benefits from a large positive balance and the fact that incomings spent almost as much in Slovenia as domestic students.
5 Conclusion
Erasmus+ has become one of the most remarkable programs in the EU. It moves young people across the continent and grants them enduring European experiences. In doing so, however, it also moves money between countries as Erasmus+ participants use their grants (and probably additional funds) to pay for housing, food, transport etc. in their respective guest country. The study at hand – provided by the Institute for Advanced Studies in Vienna, Austria – aims at estimating the economic effects of Erasmus+ for Slovenia.
We find a gross value added (GVA) effect of about 7.8 million Euros for Slovenia in 2018. The overall effect is even larger, but a considerable part of it flows abroad due to imports. Erasmus+ supports 194 jobs in Slovenia. About 47 of them are generated in the education sector itself; the rest is distributed over the whole value added chain.
Public authorities collect about 3.1 million Euros in taxes and social insurance contributions due to Erasmus+. Naturally, the educational sector benefits most from the programme, but also sectors that are concerned with the (short- or long-term) accommodation of participants cash in on Erasmus+.
In conclusion, this study shows that there are economic benefits for Slovenia from Erasmus+. However, this is only a myopic perspective. Many different effects can be thought of when it comes to the long-run: Participants from Slovenia who went abroad, might return with higher human capital and therefore have a positive impact on the Slovenian economy. Or today’s incomings to Slovenia might want to permanently relocate to their former guest country after finishing their education or training. Both effects might also work in the opposite direction. Such long-run effects cannot be considered here but are at the core of Erasmus+. They are, therefore, covered by a number of monitoring programs accompanying Erasmus+.
6 Lists
6.1 List of Figures
Figure 1: Composition of incomings by type ... 8 Figure 2: Shares of incomings by sending country ... 9 Figure 3: Average length of stay in Slovenia (by groups) ... 9
6.2 List of Tables
Table 1: Monthly expenditures of students in Slovenia ... 11 Table 2: Economic effects of Erasmus+ incomings ... 15 Table 3: Economic effects of Erasmus+ incomings minus outgoings... 16 Table 4: Economic effects of Erasmus+ incomings minus outgoings
plus organisational support ... 17 Table 5: Most affected industries (by NACE classification) ... 18 Table 6: Economic effects (for higher education; i.e. key actions 103, 107 and 203) ... 23 Table 7: Economic effects (for non-higher education; i.e. all mobilities other than under key actions 103, 107 and 203) ... 23 Table 8: Most affected industries by NACE classification (higher education) ... 24 Table 9: Most affected industries by NACE classification (non-higher education) ... 25
6.3 Bibliography
KLUGE, J., LAPPÖHN, S., SCHNABL, A. AND ZENZ, H. (2018): Die Effekte der Erasmus+
Incomings auf die österreichische Volkswirtschaft.
LEONTIEF, W. W. (1936): Quantitative Input and Output Relations in the Economic Systems of the United States. In: The Review of Economics and Statistics 18 (3), pp. 105-125.
STATISTICAL OFFICE OF THE REPUBLIC OF SLOVENIA (2018A):Input-output tables, supply and use tables (ESA 2010).
https://pxweb.stat.si/pxweb/Database/Economy/03_national_accounts/15_input_out put_eng/05_03750_input_output_eng_ESR2010/05_03750_input_output_eng_ESR20 10.asp
STATISTICAL OFFICE OF THE REPUBLIC OF SLOVENIA (2018B): Structure of average daily expenditures per foreign tourist in the main season by type of accommodation.
https://pxweb.stat.si/pxweb/Database/Economy/21_hotels_tourism/10_foreign_touri sts/20_21767_foreign_average_expend/20_21767_foreign_average_expend.asp
7 Appendix
Table 6: Economic effects (for higher education; i.e. key actions 103, 107 and 203)
…of which
overall direct indirect induced Gross value added (GVA) (in mill. €) 5.96 0.74 3.23 1.99
Slovenia 3.83 0.74 2.23 0.86
Other countries 2.20 0.00 1.06 1.15
Employment effect
(= jobs per year in Slovenia) 87 26 43 18
Fiscal returns (in mill. €) 1.38 0.23 0.80 0.35
Taxes and dues 0.85 0.06 0.55 0.24
Social insurance 0.53 0.17 0.25 0.11
Source: IHS, 2019. Table includes incomings, outgoings, travel expenses and organisational support.
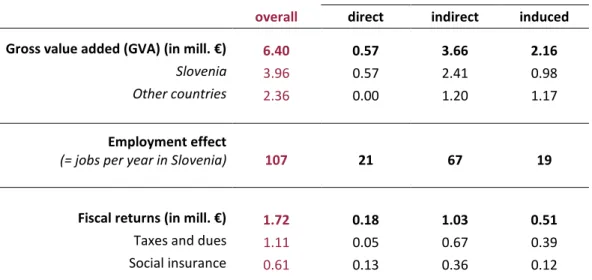
Table 7: Economic effects (for non-higher education; i.e. all mobilities other than under key actions 103, 107 and 203)
…of which
overall direct indirect induced Gross value added (GVA) (in mill. €) 6.40 0.57 3.66 2.16
Slovenia 3.96 0.57 2.41 0.98
Other countries 2.36 0.00 1.20 1.17
Employment effect
(= jobs per year in Slovenia) 107 21 67 19
Fiscal returns (in mill. €) 1.72 0.18 1.03 0.51
Taxes and dues 1.11 0.05 0.67 0.39
Social insurance 0.61 0.13 0.36 0.12
Source: IHS, 2019. Table includes incomings, outgoings, travel expenses and organisational support.
Table 8: Most affected industries by NACE classification (higher education) Rank
(GVA) Rank
(Jobs) NACE Code GVA
(mill. €)
Jobs (p.a.)
1. 1. Education services 0.84 30
2. 14. Real estate services 0.72 1
3. 2. Accommodation and food services 0.37 15
4. 3. Land transport services and transport services via
pipelines 0.26 7
5. 18. Electricity, gas, steam and air conditioning 0.12 1
6. 5. Wholesale trade services, except of motor vehicles
and motorcycles 0.10 2
7. 36.
Financial services, except insurance and pension
funding 0.10 0
8. 12. Legal and accounting services; services of head
offices; management consulting services 0.09 2
9. 15.
Warehousing and support services for
transportation 0.08 1
10. 4. Constructions and construction works 0.08 2
Remaining sectors 1.06 26
Overall 3.83 88
Source: IHS, 2019.
Table 9: Most affected industries by NACE classification (non-higher education) Rank
(GVA) Rank
(Jobs) NACE Code GVA
(mill. €)
Jobs (p.a.)
1. 1. Accommodation and food services 0.70 29
2. 2. Education services 0.63 23
3. 23. Real estate services 0.35 1
4. 3. Retail trade services, except of motor vehicles and
motorcycles 0.29 9
5. 4. Wholesale trade services, except of motor vehicles
and motorcycles 0.21 5
6. 5. Land transport services and transport services via
pipelines 0.13 4
7. 6. Employment services 0.12 3
8. 33. Financial services, except insurance and pension
funding 0.11 0
9. 19. Electricity, gas, steam and air conditioning 0.10 1
10. 11. Legal and accounting services; services of head
offices; management consulting services 0.09 2
Remaining sectors 1.23 30
Overall 3.96 106
Source: IHS, 2019.