RESEARCH ARTICLE
Genetic diversity of calcareous grassland
plant species depends on historical landscape configuration
Christoph Reisch1*, Sonja Schmidkonz1, Katrin Meier1, Quirin Schöpplein1, Carina Meyer1, Christian Hums1, Christina Putz1 and Christoph Schmid2
Abstract
Background: Habitat fragmentation is considered to be a main reason for decreasing genetic diversity of plant spe- cies. However, the results of many fragmentation studies are inconsistent. This may be due to the influence of habitat conditions, having an indirect effect on genetic variation via reproduction. Consequently we took a comparative approach to analyse the impact of habitat fragmentation and habitat conditions on the genetic diversity of calcare- ous grassland species in this study. We selected five typical grassland species (Primula veris, Dianthus carthusianorum, Medicago falcata, Polygala comosa and Salvia pratensis) occurring in 18 fragments of calcareous grasslands in south eastern Germany. We sampled 1286 individuals in 87 populations and analysed genetic diversity using amplified frag- ment length polymorphisms. Additionally, we collected data concerning habitat fragmentation (historical and present landscape structure) and habitat conditions (vegetation structure, soil conditions) of the selected study sites. The whole data set was analysed using Bayesian multiple regressions.
Results: Our investigation indicated a habitat loss of nearly 80% and increasing isolation between grasslands since 1830. Bayesian analysis revealed a significant impact of the historical landscape structure, whereas habitat conditions played no important role for the present-day genetic variation of the studied plant species.
Conclusions: Our study indicates that the historical landscape structure may be more important for genetic diversity than present habitat conditions. Populations persisting in abandoned grassland fragments may contribute signifi- cantly to the species’ variability even under deteriorating habitat conditions. Therefore, these populations should be included in approaches to preserve the genetic variation of calcareous grassland species.
Keywords: AFLP, Dry grasslands, Habitat fragmentation, Genetic diversity, Grazing, Land use, Litter, Soil analysis
© The Author(s) 2017. This article is distributed under the terms of the Creative Commons Attribution 4.0 International License (http://creativecommons.org/licenses/by/4.0/), which permits unrestricted use, distribution, and reproduction in any medium, provided you give appropriate credit to the original author(s) and the source, provide a link to the Creative Commons license, and indicate if changes were made. The Creative Commons Public Domain Dedication waiver (http://creativecommons.org/
publicdomain/zero/1.0/) applies to the data made available in this article, unless otherwise stated.
Background
Calcareous grasslands are important hotspots of plant species diversity in central Europe. They contain many rare and endangered plant species and are of strong conservation interest [1–3]. However, due to land use changes, calcareous grasslands declined significantly in Europe during the last 150 years [4]. Agricultural inten- sification, increased fertilization and afforestation caused a drastic loss of grasslands. In some regions, up to 90% of
the grasslands disappeared [5]. Today calcareous grass- lands are thus often highly fragmented, with the area of the grassland patches continuously decreasing while their spatial isolation increases [6]. This process of habitat fragmentation is a general threat to biodiversity, reducing species richness within small and isolated habitat patches [7].However, fragmentation has not only an impact on biodiversity at the species level, but also on the genetic diversity, due to geographic isolation of smaller popula- tions [8]. In particular formerly widespread species are more susceptible to the effects of fragmentation than naturally rare and isolated species [9]. Genetic variation
Open Access
*Correspondence: christoph.reisch@biologie.uni-regensburg.de
1 Institute of Plant Sciences, University of Regensburg, 93040 Regensburg, Germany
Full list of author information is available at the end of the article
is directly related to population size [10] and often decreases during the process of fragmentation. Moreo- ver, the exchange of pollen and seeds between popula- tions is impeded by fragmentation, which decreases gene flow [11] and increases genetic drift. This results in a loss of genetic diversity and may lead to reduced generative [12] and vegetative performance [13]. As a consequence, there is an increase in the susceptibility to pathogens and herbivores in the short term [14] and the probability of extinction in the long term [8]. Finally, the loss of genetic diversity may explain the observed loss of species diver- sity in numerous studies analysing fragmentation effects [6].However, the results of many studies dealing with the impact of fragmentation on genetic diversity are incon- sistent. Some of these studies support the assumptions derived from the theory of island biogeography [15], whereas others do not [16]. This dilemma has recently been illustrated by a review of 259 fragmentation studies, which concluded that the broad generalisations on the effects of fragmentation are problematic [17].
One of the most important challenges of fragmentation studies is that habitat conditions may differ between rem- nant grassland patches [17]. Many calcareous grasslands have been abandoned because sheep grazing is no longer economical [1, 2]. In the absence of grazing, habitat con- ditions continuously deteriorate and typical open short- grass conditions get lost [18]. This process is enhanced by the spill-over of fertiliser from adjacent agricultural areas [18]. Absence of grazing and increased nitrogen deposition change the vegetation structure of calcareous grasslands [19], resulting in a decrease in species rich- ness [20] and shifts in species composition [21]. Due to the lack of biomass removal and increasing productiv- ity litter accumulates while gaps of open soil, which are indispensable for the germination of many dry grassland species, become rare [22]. Furthermore, litter acts as a trap, further reducing the number of germinating seeds [23]. Particularly for species which require light to ger- minate, ground shadowing caused by increasing vegeta- tion height, dominance of grasses and litter accumulation leads to the regression those of species [24]. Therefore, successful reproduction is impeded when habitat condi- tions deteriorate, which may subsequently affect genetic diversity. This process is intensified by the loss of suitable dispersal vectors, such as migrating sheep, which also reduces the exchange of seeds [2] and subsequently, the immigration of genetically deviant individuals.
Hence, genetic diversity may be affected by the interfer- ing effects of both fragmentation and habitat conditions, which might explain the inconsistent results of many fragmentation studies. Moreover, due to different bio- logical traits, patterns of genetic variation differ between
plant species [25] and these may react completely differ- ent to fragmentation, again explaining unclear results of many genetic fragmentation surveys.
In this study, we analysed the impact of fragmentation on genetic diversity of several calcareous grassland spe- cies in a comparative approach, including both habitat fragmentation and habitat conditions. We used the same analytical approach for all species and applied Bayesian multiple regressions, which enables a detailed interpre- tation of the data, while being more flexibly adaptable to the data structure than traditional frequentist meth- ods. More specifically we ask the following questions: (i) has fragmentation of calcareous grasslands a significant impact on genetic diversity of plant populations? (ii) is historical landscape configuration more important for genetic diversity than present landscape configuration?
(ii) is genetic diversity of grassland plant populations affected by habitat conditions?
Methods
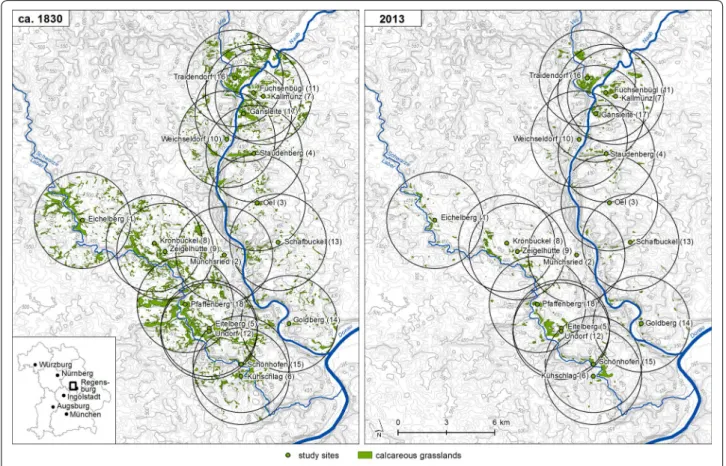
Study sites, habitat fragmentation and habitat conditions For our study, we randomly selected 18 remnant calcare- ous grasslands in the valleys of the rivers Naab and Laber on the Franconian Alb in south eastern Germany near Regensburg (Fig. 1). Within the study region, calcareous grasslands have been subjected to fragmentation due to afforestation, intensification and abandonment since the nineteenth century. The study sites and all other calcare- ous grasslands occurring within a radius of 3 km around these sites were vectorised using a Geographic Informa- tion System (Arc Info 10.0, Esri) based upon corrected aerial photos (orthophotos) from August to October 2013 to study the effects of this fragmentation process. Vector- ised data was used to calculate the current area (HA2013) and perimeter (P) of each grassland fragment as well as the distance (D2013) to the nearest calcareous grassland within the 3 km radius. The shape of the study sites was characterised by the ratio of habitat area to perimeter (HA/P2013), which was small for narrow and elongated grasslands and large for round and compact grasslands.
Using historical cadastral maps, which were available from local land surveying offices, we determined the area of the study sites (HA1830) and the distance (D1830) to the nearest calcareous grassland within the 3 km radius in 1830. The maps include a detailed legend, which allows the identification of calcareous grasslands. We compared the area covered by calcareous grasslands in 1830 and 2013 and calculated the habitat loss (HL) within the 3 km radius around each of our study sites as a percentage of the grassland area lost since 1830. Additionally, con- nectivity of each fragment to all other fragments within the 3 km radius in 2013 and 1830 was calculated accord- ing to Hanski [26] as Si=
j�=iexp
−αdij
Aj where Si is
the connectivity of the patch i, dij is the distance between patches i and j, and Aj is the area of the patch j [27].
Based upon the historical maps, grasslands were clas- sified for further analyses as historically old, when they were already grassland in 1830, and historically young grasslands, when they originated after 1830.
The selected grasslands date back at least to the period of the Roman Empire [28] and have been grazed fre- quently until the 1960s, as have most other grasslands in central Europe [4]. Today they are abandoned or infre- quently grazed. However, detailed information about the grazing history since the 1960s is not available. In 2014, we established ten study plots with the size of 2 × 2 m at each of the selected grasslands to analyse the impact of the habitat conditions on genetic diversity of our study species. In each plot we determined the vegeta- tion height (VH) as well as the cover of grass (CG), litter (CL) and bare soil (BS). Furthermore, we took five soil samples at each study site with a core sampler, which were then pooled, in order to analyse the nutrient con- tent of the soil. Pooled samples were dried in a heating cabinet at 50 °C for several days, cleaned by sieving with
2 mm mesh size and then stored at 4 °C until they were subjected to a soil chemical analysis following the pro- cedures described by Bassler et al. [29]. We determined the phosphorous (P) and potassium (K) content, as well as the carbon to nitrogen ratio (C/N) as described previ- ously [30].
Study species and genetic variation
For our study we selected five typical and widespread calcareous grassland species (Primula veris L., Dianthus carthusianorum L., Medicago falcata (L.) Arc., Polygala comosa Schkuhr and Salvia pratensis L.), frequently occurring in calcareous grasslands in south eastern Ger- many. In the field we assessed population size (NI) by counting the number of present individuals (Table 1) at each site. For the analysis of genetic variation with a few exceptions (at three sites P. comosa could not be sampled), leaf material of 15 individuals per population and species was collected (Table 5). In total 1286 indi- viduals from 87 populations were analysed. Leaf material was placed in plastic bags in the field and stored in a lab freezer at −20 °C until molecular analysis.
Fig. 1 Geographic location of the 18 selected study sites (labelled dots) in the valleys of Naab and Laber on the Franconian Alb in south eastern Germany near Regensburg and all other calcareous grasslands (grey areas) within a radius of 3 km around the study sites in 1830 and 2013
Genomic DNA was isolated from dry leaf material using the CTAB-based method [31] as described before [32]. Concentrations of the DNA extracts were measured photometrically. DNA solutions were diluted with water to 7.8 ng/μL and used for the analysis of Amplified Frag- ment Length Polymorphisms (AFLPs), which were con- ducted concordant with the protocol from Beckmann Coulter as described previously [33, 34].
DNA adapters were prepared by adding equal volumes of both single strands of EcoRI (4 µM) and MseI (40 µM) adaptors (MWG Biotech), following a 5 min heating at 95 °C with a final 10 min step at 25 °C. DNA restriction and adapter ligation were performed in one step by add- ing a 3.6 μL mixture per reaction containing 2.5 U EcoRI (MBI Fermentas), 2.5 U MseI (MWG Biotech), 0.1 μM EcoRI and 1 μM MseI adapter pair, 0.5 U T4 Ligase with 0.1× of its corresponding buffer (MBI Fermentas), 0.05 M NaCl and 0.5 μg BSA (New England BioLabs) to 6.4 μL of genomic DNA in a concentration of 7.8 ng/
μL. Following an incubation at 37 °C for 2 h with a final enzyme denaturation step at 70 °C for 15 min, the restric- tion-ligation products were diluted tenfold with 1×
TE buffer for DNA (20 mM Tris–HCl, pH 8.0; 0.1 mM EDTA, pH 8.0).
For preselective DNA amplification, 1 μL diluted DNA restriction-ligation product, 0.25 µM preselective EcoRI and MseI primers (MWG Biotech) were added to an AFLP Core Mix (PeqLab, Germany) containing 1x Buffer
S, 0.4 mM dNTPs and 1.25 U/µL Taq-Polymerase. In a 5 μL reaction volume PCR was performed on at 94 °C for 2 min then 30 cycles of 20 s denaturation at 94 °C, 30 s annealing at 56 °C and 2 min elongation at 72 °C, a final 2 min 72 °C and 30 min 60 °C step for complete extension ending with a final cool down to 4 °C. After PCR, prod- ucts were diluted 20 fold with 1× TE buffer for DNA.
After an extensive screening of 30 primer combi- nations, three primer combinations per species were chosen for a subsequent selective PCR reaction. For detection, EcoRI primers labelled with different fluores- cent dyes (Beckman Coulter) were used (Table 2). Selec- tive PCR was carried out in a total reaction volume of 5 μL containing an AFLP Core Mix (1× Buffer S, 0.4 mM dNTP’s, 1.25 U/µL Taq-Polymerase, PeqLab, Germany), 0.05 μM selective EcoRI (Proligo, France), 0.25 μM MseI (MWG Biotech) primers and 0.75 μL diluted preselecive Table 1 Size of the studied populations
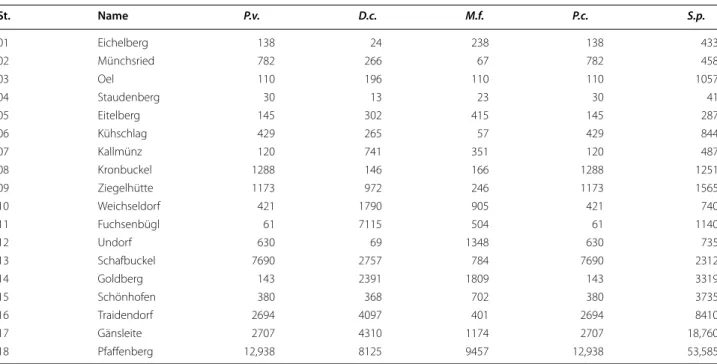
Population size of Primula veris (P.v.), Dianthus carthusianorum (D.c.), Medicago falcata (M.f.), Polygala comosa (P.c.) and Salvia pratensis (S.p.) at the study sites determined as the number of occurring individuals
St. Name P.v. D.c. M.f. P.c. S.p.
01 Eichelberg 138 24 238 138 433
02 Münchsried 782 266 67 782 458
03 Oel 110 196 110 110 1057
04 Staudenberg 30 13 23 30 41
05 Eitelberg 145 302 415 145 287
06 Kühschlag 429 265 57 429 844
07 Kallmünz 120 741 351 120 487
08 Kronbuckel 1288 146 166 1288 1251
09 Ziegelhütte 1173 972 246 1173 1565
10 Weichseldorf 421 1790 905 421 740
11 Fuchsenbügl 61 7115 504 61 1140
12 Undorf 630 69 1348 630 735
13 Schafbuckel 7690 2757 784 7690 2312
14 Goldberg 143 2391 1809 143 3319
15 Schönhofen 380 368 702 380 3735
16 Traidendorf 2694 4097 401 2694 8410
17 Gänsleite 2707 4310 1174 2707 18,760
18 Pfaffenberg 12,938 8125 9457 12,938 53,585
Table 2 Selective primer pairs used for AFLP analysis of the study species
Species D2 D3 D4
Primula veris CAA-AAC CAA-ACG CAG-ACA
Dianthus carthusianorum CTC-AGC CAA-AAG CTG-ACT
Medicago falcata CAC-ACC CTA-ACG CTT-ACA
Polygala comosa CAA-AAC CAT-ACG CTA-ACA
Salvia pratensis CTT-AGC CTA-AGG CTT-ACA
amplification product. For detection, EcoRI primers labelled with different fluorescent dyes (D2, D3, D4) were used. PCR parameters used were treated 2 min at 94 °C, 10 cycles 20 s denaturation at 94 °C, annealing 30 s at 66 °C and 2 min elongation at 72 °C, where anneal- ing temperature was reduced every subsequent step by 1 °C, additional 25 cycles of 20 s denaturation at 94 °C, 30 s annealing at 56 °C and 2 min elongation at 72 °C completed by a following 30 min step at 60 °C and a cool down to 4 °C.
Selective PCR products were diluted with 1× TE0.1 buffer for AFLP and pooled. After pooling 5 μL of each selective PCR product of a given sample and adding them to a mixture of 2 μL sodium acetate (3 M, pH 5.2), 2 μL Na2EDTA (100 mM, pH 8) and 1 μL glycogen (20 mg/mL;
Roche), DNA was precipitated in a 1.5 mL tube by adding 60 μL of 96% ethanol (−20 °C) and an immediate shaking.
DNA was pelleted by 20 min centrifugation at 14,000g at 4 °C, the supernatant was poured off and the pellet was washed once by adding 200 μL 70% ethanol (−20 °C) and centrifugation at the latter conditions and was subse- quently vacuum dried in a concentrator [33, 34].
After redissolving the pelleted DNA in a mixture of 24.8 μL Sample Loading Solution (SLS, Beckman Coul- ter) and 0.2 μL CEQ Size Standard 400 (Beckman Coul- ter), selective PCR products were separated by capillary gel electrophoresis on an automated sequencer (GeXP, Beckmann Coulter). Results were examined using the GeXP software (Beckman Coulter) and analysed using the software Bionumerics 4.6 (Applied Maths, Kortrijk, Belgium). From the computed gels, only those fragments that showed intense and articulate bands were taken into account for further analyses. Samples yielding no clear banding pattern or obviously representing PCR artefacts were repeated. Finally, 19 individuals were excluded from the analysis due to the lack of a clear banding pat- tern. Reproducibility of molecular analyses was inves- tigated with 10% of all analysed samples by means of estimating the genotyping error rate [35], which was 3.8%.
From the AFLP bands, a binary (0/1) matrix was cre- ated for each species. Based upon this matrix, we cal- culated the genetic diversity of each population as Nei’s Gene Diversity [36] using the program AFLP SURV [37].
Bayesian multiple regressions
The impact of habitat fragmentation and habitat con- ditions on diversity was analysed using a robust hier- archical Bayesian multiple regression approach with regression parameters for the species level (not shown) and an overarching set of hyperparameters for the species-independent estimation of regression param- eters. Predictor variables were grassland fragmentation
parameters (fragment area, area/perimeter ratio as well as distance to the nearest calcareous grassland and habitat connectivity) and habitat condition parameters (vegetation height, cover of grass, litter and bare soil, contents of P, K and C/N ratio). This approach is equiva- lent, though not identical, to a linear mixed model with random slopes and random intercepts using species as a random effect. The overarching hyperparameters ensure a transfer of information between the species’ parameters that shrinks outliers on species-level towards the main trend. The hyperparameters themselves are therefore suitable to depict the species-independent trends in the data.
There was no credible influence of habitat age detect- able by the model and, hence, impeded accurate parame- ter estimation of the remaining parameters. Accordingly, habitat age as a parameter hampered model interpreta- tion, and therefore was excluded from the final analysis.
All predictor variables were checked for strong correla- tions (Pearson’s correlation coefficient >0.8; observed maximum 0.7) to check for multicollinearity. Addition- ally, multicollinearity can be recognised in Bayesian models by extremely broad posterior distributions of correlated parameters. However, this was not the case in the presented analysis. Model stability was verified by re-running the analysis with and without the most strongly correlated predictors. Accordingly, habitat age as a parameter hampered model interpretation and was, therefore, excluded from the final analysis.
A Bayesian approach was chosen for being flexibly adjustable to the situation at hand, e.g. it can be easily modified to reduce false positives in parameter estima- tion or improved to accommodate outliers in the data. In the situation at hand, the applied model could easily be tailored to reflect the hierarchical structure of our data (Additional file 1). Furthermore, results from Bayesian models have a higher informative value than classical NHST methods as they provide full probability distribu- tions on the estimated parameters. Modelling and inter- pretation were carried out using the software packages R 3.2.1 [38] and JAGS 3.2.0 for Markov Chain Monte Carlo (MCMC) sampling [39] as well as utility functions pro- vided by Kruschke [40]. Errors were modelled as being t-distributed in order to accommodate outliers and con- duct a robust regression. Regression parameters were regularised using mildly informed, double-exponential prior distributions with location parameter set to 0 and a fixed precision parameter set to 0.1, thereby reducing chances for false positive regression parameters. These settings, known as the Bayesian Lasso [41] avoid overfit- ting in complex models and reduce the overestimation of effects that can happen in AIC-based model selection procedures.
Sampling was carried out with four MCMC chains with 300,000 steps in total with thinning set to every 10th step, a burn-in period of 2000 steps and 1000 steps for adap- tion. All parameters were checked for chain convergence.
Autocorrelation in the MCMC chains was assessed as the effective sample size (ESS) aiming at a lower limit of 10 k for the relevant parameters. Highest density intervals (HDIs) were computed for the regression coefficients to check if coefficients were credibly non-zero. The predic- tors’ relative influences were assessed using standardised regression coefficients. A graph was produced by fixing all but the predictors of credible influence to their mean, resulting in a two dimensional scatter plot.
Results
Habitat fragmentation and habitat conditions
Our results indicated a strong decline of calcareous grasslands within the study region. The mean size of the selected grasslands patches decreased from 115,045 m2 in 1830–14,881 m2 in 2013 (Table 3). In contrast, the mean distance to the nearest grassland increased from 110 m in 1830–210 m in 2013. Confirming this observation, mean connectivity among grasslands decreased from 74.81 in 1830–27.90 in 2013. Mean loss of calcareous grasslands within the 3 km radius around each of our study sites was 78.62%.
Habitat conditions strongly differed between study sites. Vegetation height ranged from 0.51 to 1.18 m with an average of 0.93 m (Table 4). Large differences could also be observed for the cover of grass, which varied between 48.0 and 90.0% with a mean of 76.5%. The cover of litter ranged from 7.7 to 38.0% with a mean of 20.4%, whereas the proportion of bare soil was minimum 0%
and maximum 5.5% with an average value of 0.7%.
The content of phosphorous also varied between sites and ranged from 8.04 to 53.76 mg/kg soil with a mean of 26.47 mg/kg soil (Table 4). Similarly, the content of potas- sium varied between 101.22 and 319.02 mg/kg soil. On average we observed a potassium content of 211.06 mg/
kg soil. Finally, we determined the carbon to nitrogen ratio, which ranged from 10.9 to 42.0 with a mean of 19.6 (Table 4).
Genetic variation and hierarchical Bayesian multiple regression
AFLP analysis resulted in 120 fragments for Primula veris, 148 fragments for Dianthus carthusianorum, 285 fragments for Medicago falcata, 166 fragments for Polyg- ala comosa and 192 fragments for Salvia pratensis. The proportion of polymorphic bands per species was 88.3%
(P. veris), 97.4% (D. carthusianorum), 97.8% (M. fal- cata), 98.7% (P. comosa) and 94.3% (S. pratensis). Genetic Table 3 Habitat fragmentation data
Area of the selected study sites in m2 in 1830 and 2013 (HA1830 and HA2013), the area/perimeter ratio (HA/P) in 2013, the distance to the nearest calcareous grassland in meter (D1830 and D2013) and the connectivity of the grasslands (CO1839 and CO2013) within a radius of 3 km in 1830 and 2013, and the loss of calcareous grasslands within this radius since 1830 in % (HL)
St. Name HA2013 HA1830 HA/P D2013 D1830 CO1830 CO2013 HL
01 Eichelberg 445 715,410 2.41 58 129 100.90 8.35 83.01
02 Münchsried 631 0 3.95 980 133 23.89 2.34 79.12
03 Oel 763 6725 3.44 391 81 9.76 1.96 61.88
04 Staudenberg 1020 0 5.31 97 70 37.16 11.65 67.04
05 Eitelberg 1399 0 8.56 117 97 130.80 44.65 84.25
06 Kühschlag 1440 3308 8.25 340 98 62.28 26.52 82.43
07 Kallmünz 1546 11,072 6.67 175 168 82.16 48.29 83.75
08 Kronbuckel 1695 1176 4.79 382 62 59.55 13.94 80.55
09 Ziegelhütte 2495 0 4.69 41 24 70.72 15.55 78.33
10 Weichseldorf 5659 37,519 12.26 290 273 43.21 9.24 71.19
11 Fuchsenbügl 6211 13,243 11.22 60 15 101.79 66.19 83.21
12 Undorf 8009 0 20.89 91 59 132.94 50.75 84.49
13 Schafbuckel 12,033 17,338 17.12 150 192 13.19 3.60 77.90
14 Goldberg 22,160 0 12.31 32 121 21.15 7.19 66.83
15 Schönhofen 21,894 58,015 23.84 211 251 78.99 32.96 81.99
16 Traidendorf 24,405 134,710 15.02 58 44 97.91 71.44 84.95
17 Gänsleite 64,984 440,768 23.17 222 63 97.09 48.36 78.88
18 Pfaffenberg 91,067 631,523 24.87 87 94 183.16 38.90 85.32
Mean 14,881 115,045 11.60 210 110 74.81 27.90 78.62
SE ±5828 ±53,938 ±1.79 ±53 ±17 ±11.01 ±5.38 ±1.67
diversity varied between species and populations. Mean genetic diversity of populations (Table 5) was highest in M. falcata (0.29), followed by S. pratensis (0.26), P.
comosa (0.25) and D. carthusianorum (0.23). The lowest level of genetic diversity was observed in P. veris (0.18).
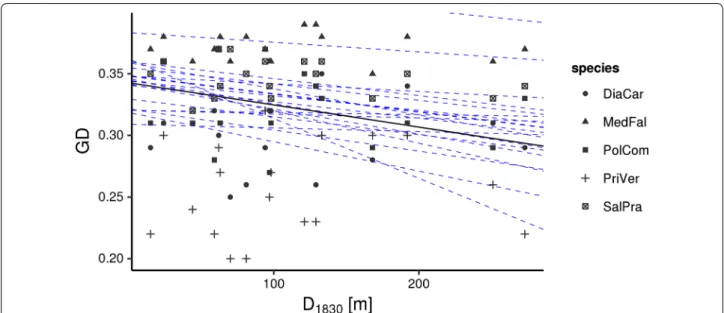
Considering each species separately and all species together in the hierarchical Bayesian multiple regres- sions, we observed a credible impact of the distance to the nearest calcareous grassland in 1830 on the genetic variation within populations of the studied grassland species (Fig. 2, Tables 6, 7). The distance to the nearest calcareous grassland in 1830 was negatively correlated to the genetic variation within populations. This means that high levels of genetic variation have been detected at study sites which were closely located to other fragments in 1830. However, habitat area, today’s distance to the nearest calcareous grassland, habitat shape, habitat con- ditions and population size had no impact on the genetic diversity of the species.
Discussion
Impact of habitat fragmentation on genetic diversity In our study, we observed an impact of the historical landscape configuration on the genetic diversity of the study species, since it depended on the distance to the nearest calcareous grassland in 1830 in the hier- archical Bayesian regressions. During the process of
fragmentation the area of the habitat patches usually decreases [8]. Consequently, the size of plant popula- tions occurring in remnant calcareous grasslands also declines, which results in a decline in genetic diversity [10]. In our study, we also observed a strong reduc- tion of the habitat size. The contemporary area of the study sites was on average only 10% of the area in 1830. However, we observed no significant relation- ship between genetic diversity of the five study spe- cies and population size. Neither the current habitat area, nor the actual number of individuals per grass- land fragment had an impact on genetic diversity.
Similar findings have been reported in other fragmen- tation studies [12, 42]. Lag effects, a delayed reaction of genetic diversity on the reduction of population size [43], which is comparable to the extinction debt reported for species diversity [44, 45], could be a rea- son for the observed lack of a relationship between genetic diversity and population size [46]. In this case, genetic diversity should then be related to the histori- cal area of the study sites. However, our study provided no evidence for such a relationship, which means that genetic diversity may generally be determined by fac- tors other than habitat area or population size. Sto- chastic gene flow and long term survival under highly fragmented conditions are often considered as reasons for this observation [9, 47]. It has also been stated that Table 4 Habitat condition data
Habitat conditions of the selected study sites, described by the height of the vegetation in meter (VH), the cover of litter in % (CL), the cover of grass in % (CG), the proportion of bare soil in % (BS) as well as the content of phosphorous in mg/kg soil (P), potassium in mg/kg soil (K) and the ratio of carbon and nitrogen (C/N)
St. Name VH CG CL BS P K C/N
01 Eichelberg 1.18 92.8 23.0 0.0 14.70 369.53 18.3
02 Münchsried 0.95 62.5 19.0 0.3 15.66 101.22 13.7
03 Oel 0.94 90.0 24.0 0.0 36.48 232.81 15.6
04 Staudenberg 1.54 67.0 29.0 0.0 53.76 272.77 16.0
05 Eitelberg 1.08 88.2 16.6 0.0 14.18 130.26 22.6
06 Kühschlag 0.91 87.0 30.5 0.3 26.63 192.97 42.0
07 Kallmünz 0.77 82.5 15.0 5.5 12.70 195.62 17.6
08 Kronbuckel 1.13 88.8 10.3 0.4 23.85 220.63 16.6
09 Ziegelhütte 0.93 84.5 17.5 0.8 37.63 169.02 21.8
10 Weichseldorf 0.51 63.0 14.5 0.8 16.25 135.42 20.1
11 Fuchsenbügl 1.15 74.5 19.0 0.1 31.92 249.64 19.0
12 Undorf 1.13 90.3 25.5 0.1 41.19 173.90 37.4
13 Schafbuckel 1.01 78.0 07.7 0.0 37.90 240.98 18.1
14 Goldberg 1.13 62.0 29.0 0.2 37.57 127.73 19.9
15 Schönhofen 0.43 73.0 20.5 0.2 37.63 247.30 17.6
16 Traidendorf 0.31 48.0 38.0 1.5 09.62 319.02 13.9
17 Gänsleite 0.98 66.0 17.0 1.8 20.67 294.17 10.9
18 Pfaffenberg 0.65 78.0 10.4 0.5 08.04 126.00 11.1
Mean 0.93 76.5 20.4 0.7 26.47 211.06 19.6
SE ±0.1 ±3.0 ±1.9 ±0.3 ±3.11 ±17.52 ±1.9
Fig. 2 Relationship between genetic diversity (GD) and distance to the nearest calcareous grassland in 1830 (D1830) on 18 selected calcareous grasslands in south eastern Germany displayed as two dimensional scatter plot based upon the results of the hierarchical Bayesian multiple regres- sion. Dashed lines represent twenty randomly chosen steps from the MCMC chains and are added to depict the variability in the posterior distribu- tion of the regression parameters. Note that while intercepts vary considerably due to different levels of gene diversity in the analysed species, slopes are uniformly negative
Table 5 Genetic diversity of the study species
Nei’s Gene Diversity of Primula veris (P.v.), Dianthus carthusianorum (D.c.), Medicago falcata (M.f.), Polygala comosa (P.c.) and Salvia pratensis (S.p.) and the respective sample sizes
St. Name P.v. n D.c. n M.f. n P.c. n S.p. n
01 Eichelberg 0.23 13 0.26 15 0.39 15 0.34 15 0.35 13
02 Münchsried 0.30 14 0.35 15 0.38 15 0.33 15 0.36 15
03 Oel 0.20 15 0.26 15 0.38 15 – – 0.35 15
04 Staudenberg 0.20 15 0.25 15 0.36 15 – – 0.37 14
05 Eitelberg 0.25 15 0.32 15 0.36 15 0.27 15 0.34 15
06 Kühschlag 0.27 15 0.32 15 0.36 15 0.31 15 0.33 15
07 Kallmünz 0.30 15 0.28 15 0.35 15 0.29 15 0.33 15
08 Kronbuckel 0.29 12 0.30 15 0.37 15 – – 0.37 15
09 Ziegelhütte 0.30 15 0.31 15 0.38 15 0.36 11 0.36 15
10 Weichseldorf 0.22 15 0.29 15 0.37 15 0.33 15 0.34 15
11 Fuchsenbügl 0.22 15 0.29 15 0.37 15 0.31 15 0.35 15
12 Undorf 0.22 15 0.32 15 0.37 15 0.28 15 0.33 15
13 Schafbuckel 0.30 15 0.34 15 0.38 15 0.31 14 0.35 15
14 Goldberg 0.23 15 0.35 15 0.39 15 0.35 15 0.36 15
15 Schönhofen 0.26 15 0.31 15 0.36 15 0.29 15 0.33 15
16 Traidendorf 0.24 15 0.31 15 0.36 15 0.31 15 0.32 15
17 Gänsleite 0.27 15 0.31 15 0.38 15 0.31 15 0.34 15
18 Pfaffenberg 0.32 12 0.29 13 0.37 15 0.37 15 0.36 15
Mean/total 0.18 261 0.23 268 0.29 270 0.25 220 0.26 267
SE ±0.01 ±0.01 ±0 ±0.01 ±0.00
the absence of this relationship may occur when the habitat area rapidly changes relative to the generation time of the study species [15]. Indeed, the calcareous grasslands in this study were formerly widely distrib- uted and may have exhibited more or less erratic gene flow due to grazing. In combination with the long term Table 6 Bayesian multiple regressions for each of the ana-
lysed plant species
GVwithin RC ESS Lower HDI limit Upper HDI limit
Primula veris
Intercept −1.24 170.597 −1.44 −1.04
HA1830 0.16 12.534 −0.28 0.58
HA2013 −0.14 17.675 −0.62 0.31
HA/P 0.14 17.476 −0.29 0.58
D1830 −0.28 22.780 −0.53 −0.04
D2013 0.02 114.451 −0.14 0.25
CO1830 −0.08 11.826 −0.50 0.32 CO2013 −0.20 11.931 −0.63 0.22 P −0.07 27.770 −0.40 0.19
K −0.17 12.490 −0.43 0.12
C/N 0.09 35.921 −0.14 0.34
VH −0.13 49.200 −0.43 0.08 CG −0.11 35.207 −0.36 0.20 CL −0.25 50.816 −0.59 −0.02
BS 0.16 57.745 −0.05 0.43
NI 0.26 104.064 −0.13 0.99
Dianthus carthusianorum
Intercept −0.31 233.219 −0.50 −0.12
HA1830 0.05 13.246 −0.38 0.52
HA2013 −0.20 18.615 −0.69 0.26
HA/P 0.31 19.995 −0.11 0.81
D1830 −0.27 23.119 −0.52 −0.03
D2013 0.00 119.211 −0.17 0.20
CO1830 −0.14 12.332 −0.54 0.28 CO2013 −0.18 12.178 −0.62 0.27 P −0.07 29.190 −0.38 0.21 K −0.18 13.066 −0.48 0.09
C/N 0.12 38.994 −0.10 0.40
VH −0.09 53.816 −0.31 0.12
CG −0.19 36.515 −0.48 0.08
CL −0.14 50.200 −0.37 0.10
BS 0.01 43.275 −0.19 0.20
NI 0.02 87.303 −0.73 0.51
Medicago falcata
Intercept 1.06 209.393 0.85 1.28
HA1830 0.26 12.321 −0.18 0.69
HA2013 −0.18 17.310 −0.66 0.27
HA/P 0.18 16.981 −0.23 0.60
D1830 −0.28 21.349 −0.51 −0.04
D2013 −0.03 114.837 −0.21 0.13 CO1830 −0.10 11.349 −0.51 0.29 CO2013 −0.19 11.427 −0.63 0.21 P −0.02 25.143 −0.29 0.26 K −0.13 13.169 −0.39 0.17
C/N 0.06 36.149 −0.16 0.29
VH −0.07 55.816 −0.27 0.13 CG −0.12 33.158 −0.36 0.12 CL −0.13 49.603 −0.34 0.09
Table 6 continued
GVwithin RC ESS Lower HDI limit Upper HDI limit
BS 0.01 42.573 −0.17 0.20
NI 0.01 131.943 −0.91 0.55
Polygala comosa
Intercept −0.02 99.030 −0.49 0.35
HA1830 0.30 13.267 −0.14 0.80
HA2013 −0.08 18.712 −0.53 0.42
HA/P 0.05 18.994 −0.45 0.48
D1830 −0.29 22.677 −0.55 −0.06
D2013 −0.06 120.552 −0.25 0.11 CO1830 −0.10 11.951 −0.53 0.30 CO2013 −0.28 12.171 −0.72 0.15 P −0.02 29.128 −0.31 0.31 K −0.14 12.706 −0.45 0.13
C/N 0.04 42.379 −0.19 0.28
VH −0.12 45.828 −0.38 0.09 CG −0.16 34.579 −0.45 0.10 CL −0.14 56.817 −0.36 0.10
BS 0.02 46.885 −0.18 0.20
NI 0.04 90.504 −1.45 1.05
Salvia pratensis
Intercept 0.55 171.962 0.34 0.76
HA1830 0.20 12.550 −0.24 0.62
HA2013 −0.20 20.218 −0.75 0.33
HA/P 0.12 17.543 −0.34 0.51
D1830 −0.29 22.443 −0.52 −0.05 D2013 −0.03 111.415 −0.20 0.13 CO1830 −0.10 11.783 −0.50 0.31 CO2013 −0.19 11.411 −0.63 0.21
P 0.02 27.334 −0.27 0.31
K −0.13 12.997 −0.40 0.15
C/N 0.03 40.560 −0.20 0.26
VH −0.04 63.303 −0.24 0.20 CG −0.14 32.465 −0.37 0.11 CL −0.16 49.189 −0.38 0.05
BS 0.01 44.441 −0.17 0.20
NI 0.02 90.645 −0.18 0.24
Results of the Bayesian multiple regressions on genetic variation within populations (GVwithin) calculated on species-dependent level. Modal values of marginal distributions of each standardised regression coefficient are given together with the effective sample size (ESS) of all parameters. A 90% highest density interval (HDI) was computed for each model parameter. The distance to the next calcareous grassland in 1830 (D1830) exhibits a credible impact on the genetic variation of the selected species (in italic letters) as its HDI excludes zero (RC standardised regression coefficient)
persistence of the grassland species [48] these factors may be the most likely explanation for the lack of rela- tionship between habitat area or population size and genetic diversity in this study.
Aside from decreasing habitat area, isolation of cal- careous grasslands is also an important consequence of habitat fragmentation [7, 8]. The continuous process of increasing isolation affects genetic variation both between and within populations since gene flow by seeds and pollen declines with increasing isolation [8]. As gene flow decreases, the effects of genetic drift and inbreeding are intensified [49]. This results in an increased level of genetic variation between populations and a progressive loss of genetic variation within populations [50].
Gene flow by pollen is normally restricted to the near- est vicinity of plant populations to distances of less than 1 km [51, 52]. However, rare pollination events may also allow gene flow over larger distances [53]. There- fore, gene flow among fragmented calcareous grasslands at a larger scale is mainly caused by endo- and ecto- zoochorous seed dispersal, especially from migration of sheep flocks [2]. It has been shown, that the genetic structure of plant populations depends on present
landscape connectivity [54] and that genetic variation between populations is affected by geographic distance between populations [8]. Moreover, it has also been demonstrated that genetic diversity may depend on habitat age both in natural [55] and semi-natural [56]
habitats. In contrast to previous studies, which reported higher levels of genetic diversity in populations from his- torically older habitat fragments of forests [57] or calcar- eous grasslands [58], we observed no impact of habitat age on genetic diversity in our analysis.
Surprisingly, neither historical nor present habitat connectivity had an impact on genetic diversity in our study. This may be traced back to the fact that the cal- culated connectivity reflects the spatial structure, but not the real gene flow, which may be strongly affected by the migration of sheep flocks [46]. However, we observed a relationship between genetic diversity of the grassland species and the distance to the nearest grassland patch in 1830. Therefore, the historical landscape configuration is more important for the genetic diversity of calcare- ous grassland species than the present landscape struc- ture. The effect of historical landscape configuration on species diversity has so far been demonstrated in several studies [59, 60], whereas the impact on genetic diversity has scarcely been shown [27]. However, it has recently been reported that the genetic diversity of the grass- land species Succisa pratensis depends on the historical landscape structure of the habitat [15], which supports the results of our study. Moreover, it has been shown that the genetic diversity of Dianthus carthusianorum depends on patch connectivity by shepherding [61] and that population disconnection can create a genetic bot- tleneck, even in the absence of a demographic collapse [62], which underlines the importance of historical gene flow for the level of current genetic diversity.
Impact of habitat conditions on genetic variation
The results of our analyses indicated no impact of habitat conditions on genetic diversity of the studied calcareous grassland species. It has been demonstrated that, along- side habitat fragmentation, changes in habitat conditions have a strong impact on the species richness and com- position of remnant calcareous grasslands fragments [18, 21]. Lack of grazing and the accumulation of soil nutri- ents lead to the loss of the typical open short-grass veg- etation structure, allowing for the existence of many less competitive herbs. Under the conditions of abandonment and due to increased levels of nutrients, grasses such as Brachypodium pinnatum become increasingly dominant [19] and litter accumulates [63]. As a consequence, spe- cies requiring light for germination decline due to the effects of ground shadowing [24]. For the calcareous grasslands studied here, it has been demonstrated, that Table 7 Hierarchical Bayesian multiple regression
Results of the hierarchical Bayesian multiple regression on genetic variation within populations (GVwithin) calculated on species-independent level. Modal values of marginal distributions of each standardised regression coefficient are given together with the effective sample size (ESS) of all parameters. A 95%
highest density interval (HDI) was computed for each model parameter. The distance to the next calcareous grassland in 1830 (D1830) exhibits a credible impact on the genetic variation of all species at the selected study sites (in italic letters) as HDI <0 (RC standardised regression coefficient)
GVwithin RC ESS Lower HDI limit Upper HDI limit
Intercept 0.01 300.000 −1.47 1.46
HA1830 0.20 13.665 −0.34 0.75
HA2013 −0.16 18.771 −0.74 0.40
HA/P 0.15 20.222 −0.39 0.70
D1830 −0.29 22.242 −0.57 <0.00
D2013 −0.02 130.088 −0.23 0.20 CO1830 −0.09 11.912 −0.60 0.37 CO2013 −0.21 11.813 −0.73 0.30 P −0.03 29.774 −0.38 0.31 K −0.15 12.880 −0.48 0.19
C/N 0.07 40.678 −0.20 0.36
VH −0.10 58.448 −0.37 0.17 CG −0.15 36.036 −0.46 0.17 CL −0.16 62.511 −0.46 0.12
BS 0.04 59.163 −0.21 0.31
NI 0.02 164.573 −0.96 0.87
Variance param-
eter 0.44 35.412 0.24 0.58
Normality param-
eter 4.45 7044 1.00 82.89
species diversity strongly depends on vegetation height and litter cover. Lack of grazing is therefore the most important reason for the declining species diversity of the grasslands, whereas fragmentation aspects play no significant role.
In contrast to the impact of land use on species diver- sity, the relationship between land use and genetic diver- sity is much less clear. However, it has already been demonstrated, that seedling recruitment and establish- ment in grasslands are positively affected by grazing and the removal of litter [64]. Schleuning et al. [65] even stated that the grassland species Trifolium montanum is more threatened by the effects of habitat degradation in the short term, than by the effects of fragmentation.
Since genetic diversity depends explicitly on the degree of sexual reproduction [66], it appears possible that habi- tat conditions may also have an effect on genetic diver- sity. For the grassland species Dianthus seguieri, it has recently been shown that increased vegetation height and coverage as well as a high proportion of graminoids due to land use abandonment reduce genetic diversity and seed set [67]. As previously reported, land use by graz- ing generally has a positive impact on genetic diversity [68] since it reduces the cover of litter, and therefore may stimulate sexual reproduction.
However, in this study genetic diversity depended nei- ther on vegetation structure, nor on soil nutrient levels.
One reason for this observation may lie in the life span of the investigated plant species. It has already been reported that the frequency of plant species in remnant calcareous grasslands depends mainly on their persis- tence [48]. All species included in this study are long- lived perennials [69] and since the process of habitat deterioration due to abandonment goes back only about 50 years, many individuals we analysed may have been established before litter accumulation reached a critical level. This means that impaired habitat conditions may not yet have resulted in decreased levels of genetic diver- sity. Another reason for the lack of relationship between habitat conditions and genetic diversity could be the per- sistence of seeds in the soil seed bank, which may have contributed to the regeneration of the populations and to the maintenance of genetic diversity within the studied populations [70].
Conclusions
The results of our study provide evidence that the genetic diversity of calcareous grassland plant species depends on historical landscape configuration, rather than on the present population size or habitat conditions. In practice, efforts to preserve calcareous grasslands mainly con- centrate on large fragments exhibiting the typical open- shortgrass habitat conditions and high species diversity.
However, a comprehensive conservation approach should also consider the genetic diversity of calcareous grassland plant species. From our results it can be concluded that populations in smaller grassland fragments may, depend- ing on historical landscape configuration, substantially contribute to the genetic variation of the plant species even under conditions of habitat deterioration. Prefer- ably, these populations should therefore be included in strategies to preserve calcareous grasslands as the local biodiversity hotspots they are.
Authors’ contributions
CR conceived and designed the study. SS, KM, QS, CM, CH and CP collected data. CS conducted the statistical analyses, CS and CR wrote the manuscript.
All authors read and approved the final manuscript.
Author details
1 Institute of Plant Sciences, University of Regensburg, 93040 Regensburg, Ger- many. 2 German Research Center for Environmental Health, Research Group Comparative Microbiome Analysis, Ingolstädter Landstr. 1, 85764 Neuherberg, Germany.
Acknowledgements
Special thanks go to Christine Kammel, Annika Sezi and Mathias Rass for molecular analyses, to Petra Schitko for technical assistance in the lab, to Sabine Fischer for her help with GIS, to Günther Kolb for technical assistance during soil analyses, to Ellen Pagel, Jose Valdez and Sharon Wirth for improving the language and to Peter Poschlod for his generous support.
Competing interests
The authors declare that they have no competing interests.
Availability of data and materials
The datasets supporting the conclusions of this article are included within the article. AFLP raw data are available from the corresponding author upon reasonable request.
Publisher’s Note
Springer Nature remains neutral with regard to jurisdictional claims in pub- lished maps and institutional affiliations.
Received: 9 November 2016 Accepted: 18 April 2017
References
1. Wallis De Vries MF, Poschlod P, Willems JH. Challenges for the conserva- tion of calcareous grasslands in northwestern Europe: integrating the requirements of flora and fauna. Biol Conserv. 2002;104:265–73.
2. Poschlod P, Wallis De Vries MF. The historical and socioeconomic perspec- tive of calcareous grasslands—lessons from the distant and recent past.
Biol Conserv. 2002;104(3):361–76.
3. Kajtoch Ł, Cieslak E, Varga Z, Paul W, Mazur MA, Sramkó G, Kubisz D.
Phylogeographic patterns of steppe species in Eastern Central Europe:
a review and the implications for conservation. Biodivers Conserv.
2016;25:2309–39.
4. Poschlod P. Geschichte der Kulturlandschaft. Stuttgart: Eugen Ulmer;
2015.
Additional file
Additional file 1. Text file containing the specification for the JAGS model used for the Bayesian hierarchical multiple regression. The basic model definition was adapted from Kruschke [40].