Research Collection
Working Paper
COVID-19 and the dilemma of transport policy making
Author(s):
Axhausen, Kay W.
Publication Date:
2021-01
Permanent Link:
https://doi.org/10.3929/ethz-b-000470952
Rights / License:
In Copyright - Non-Commercial Use Permitted
This page was generated automatically upon download from the ETH Zurich Research Collection. For more information please consult the Terms of use.
ETH Library
1
COVID-19 and the dilemma of transport policymaking
Kay Axhausen IVT
ETH Zurich January 2021
The challenge of COVID-19
The pandemic reached Switzerland in late February 2020, when a resident of canton Ticino tested positive
1. It has dominated the rest of 2020 with the rhythm of its numbers and the responses of the cantonal and federal governments and the reactions of the population to them. As the development of the various vaccines took place outside of Switzerland and learning about how to best treat the disease happened in the hospitals, the main visible impact of the measures and responses was the change in daily behaviour and the resulting changes in travel. The goal of the measures and reactions was to disrupt the usual network of co-presence within society and increase the diameter of the resulting social network graph in order to slow the speed of the spread of the virus. The closing of non-food stores, closing of schools and work-from-home orders are all examples that contribute to this goal.
The physical distancing and reduction of the number of households and persons at gatherings are others.
The timetable of the official response is presented on the Swiss Office of Health’s website
2. Unfortunately, there are no studies that measured the key variable (the diameter of the social network graph during 2020) directly, but there were two studies that traced a rough proxy for it – the individual travel behaviour of the Swiss population: the Intervista Mobility monitor
3and the IVT/WWZ MOBIS-COVID19 GPS panel
4. The Google Community Mobility Reports and Apple Mobility Trends Reports
5can be used where their aggregate numbers are relevant.
This paper will discuss the resulting changes to individual travel behaviour in city-regional transport and the challenges these will produce for transport policy and regional planning. It will draw in the main on the MOBIS-COVID19 panel. It will discuss the planning implications of the changes and how they can be seen to sharpen the basic dilemma of transport
policymaking, which will also be introduced. It will close with suggestions for possible actions.
1Tessin meldet ersten bestätigten Fall von Corona-Virus in der Schweiz. St. Galler Tagblatt, 25 February 2020
2 https://www.bag.admin.ch/bag/de/home/krankheiten/ausbrueche-epidemien-pandemien/aktuelle-
ausbrueche-epidemien/novel-cov/massnahmen-des-bundes.html#1570431754
3 https://www.intervista.ch/media/2020/03/Report_Mobilit%C3%A4ts-Monitoring_Covid-19.pdf
4 https://ivtmobis.ethz.ch/mobis/covid19/
5 https://www.google.com/covid19/mobility/; https://covid19.apple.com/mobility
2
Changes brought about by the pandemic in Switzerland
The MOBIS-COVID19 GPS panel (Molloy et al., 2020a; Molloy et al., 2020b) is based on the volunteer participation of MOBIS study participants who traced their travel behaviour with a smartphone-based GPS tracking app
6in the fall of 2019. With COVID-19, the study
infrastructure was repurposed to track travel behaviour changes. After an invitation in March 2020, about 1,300 of the original 3,750 participants reinstalled or continued with the GPS tracking. The original sample was drawn from the major agglomerations of the German and French-speaking parts of Switzerland, as the study implemented a virtual road pricing scheme and rural residents would have been of no interest. To account for sample attrition, the sample is re-weighted every week to match the socio-demographics of the initial
screening sample, which matched the structure of an official 2019 sample of the population well.
The app allows but does not force the participants to check whether the mode and purpose imputed by the app are correct. Based on these corrections, the study developed a new imputation based on machine learning (ML), which is applied to the data (Gao, Molloy and Axhausen, 2020) before analysis. The working status during the pandemic was queried with three short surveys during the study.
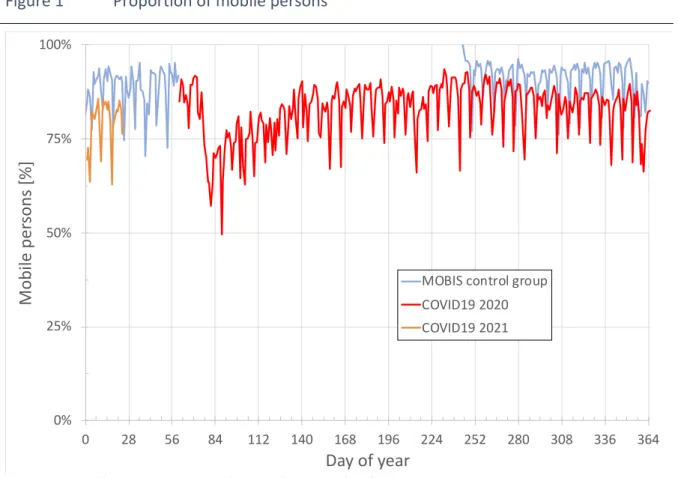
The first important change that is visible so far is the reduction in the mobile days. While before the pandemic about 95% of the sample left their home on working days, the new proportion was about 10% lower during the fall and early winter weeks. The proportion of people working from home is noticeable (see Figure 1).
6 The tracking app and the initial map matching, mode and purpose imputation and division of the traces into stages and trips are provided by motion-tag, Berlin.
3
Figure 1 Proportion of mobile persons
Data: https://ivtmobis.ethz.ch/mobis/covid19/en/ and the MOBIS study
The accelerated shift to working from home (WFH) is expected to continue as both employees and organisations benefit. The economics of smaller facilities are obvious for companies along with the higher degree of control over working hours for some of the employees, but it is unclear whether the resulting new challenges for the management and employees can be addressed in the long run: maintenance of the joint commitment to the team and organisation, the possible pressure on wages and performance; remote control of performance; performance review and promotions of remote workers; reimbursement for the working space and equipment, etc.; and from the transport point of view, the
coordination of the days away from the office, so that congestion relief is equally present on all five days of the working week. The balance of the push and pull factors will be unclear for some time. The reuse of possibly abandoned office and retail space, in particular, will
present a major challenge and opportunity for the owners and municipalities.
0%
25%
50%
75%
100%
0 28 56 84 112 140 168 196 224 252 280 308 336 364
M o b ile p e rs o n s [% ]
Day of year
MOBIS control group
COVID19 2020
COVID19 2021
4
The second major change has been the reduction in the use of public transport and an increase in cycling during good weather (see Figure 2). The cycling boom from spring to autumn in 2020 was attested not only by our GPS sample, but also by reports of massively increased bicycle sales and some of the ongoing urban cycling counts. The less urban focussed Intervista data does not show this. Cycling volumes increased hugely, from a very low base. However, the share is still only between 2% and 4%, while the drop in public transport use is worrying.
Figure 2 Change in passenger-kilometres (PKm) by mode against baseline (autumn 2019)
Data: https://ivtmobis.ethz.ch/mobis/covid19/en/
The 50 to 60% drop in PKm travelled is a major threat to the current operation of public transport in Switzerland, with its short headways, clear priority for signal control, fixed timetables and all-day and all-region service. This level of service and reliability is the basis for the large proportion of Swiss residents who own season tickets. It is also the basis for the political support for further investment and on-going subsidies. There is a danger of season tickets not being renewed and the occasional usage not being able to replace the lost revenues and commitment. It is unclear whether local and regional authorities will be willing to increase their support until population growth or a return to prior usage patterns balances the books again. The operators are currently still assuming that things will return to normal after the population is vaccinated later in 2021.
-100.0%
-50.0%
0.0%
50.0%
100.0%
150.0%
Baseline 09.03.20 23.03.20 06.04.20 20.04.20 04.05.20 18.05.20 01.06.20 15.06.20 29.06.20 13.07.20 27.07.20 10.08.20 24.08.20 07.09.20 21.09.20 05.10.20 19.10.20 02.11.20 16.11.20 30.11.20 14.12.20 28.12.20 11.01.21
% c h an ge
Week starting
Bike
Walking
Bus
Tram
Train
Car
All
5
The effect of working from home full-time or occasionally is smaller than expected in terms of kilometres travelled, even if the longer-distance commuters are more prominent among those working from home (see Figure 3). In the initial weeks, when travellers reduced their number of trips by 30–50%, they also reduced their mileage dramatically, but this reflected the closure of all stores and activity locations. This extra reduction in mileage became stronger as the year went on, indicating new destination choices for the remaining trips, but the recent lockdown reversed the trend. As locations opened again, the reduction in the number of trips was no longer as dramatic: around 10–15% for people working from home and about 5% for the other groups, increasing again in the recent lockdown.
Figure 3 Change in passenger-kilometres (PKm) by work location against baseline (Fall 2019)
Data: https://ivtmobis.ethz.ch/mobis/covid19/en/
The reductions in the number of trips and shorter trips initially reduced the mileage
dramatically, but the extra effect of working from home represented only about 25% of the travel distance. Even this difference between the work locations effectively disappeared as the summer and autumn continued. The barely reduced number of trips was in line with shorter trips, but only reduced the mileage by around 25% in total. Together with modal differences, this was mostly due to transit and reductions in train use in particular. The average door-to-door car speeds were back to baseline levels after about June.
-75%
-50%
-25%
0%
25%
02.03 30.03 27.04 25.05 22.06 20.07 17.08 14.09 12.10 09.11 07.12 04.01
% c h an ge in P K m a ga in st b as el in e
Home office
Mixed
On-site
6
The dilemma of transport policy
The dilemma of today’s transport policy is the contradictory set of aims to be pursued.
Investment in the transport systems is aimed at lowering its generalised costs and increasing social welfare by increasing productivity and therefore, as a rule, incomes. The
improvement also allows the population to maintain and build its social capital by making joint activities easier to undertake. The usual measure of this improvement in the policy discourse is “accessibility” (See Box 1). There is substantial empirical evidence that improvements in accessibility do increase productivity (See Melo, Graham, Levinson and Aarabi, 2017; Fuhrer et al., 2019). Policy makers and their voters are therefore willing to support investment in it, in principle.
Box 1 Definition of accessibility
Accessibility has multiple definitions, from simple ones to more complex weighted sums over space. Simple definitions sum all opportunities of interest, such as the number of workplaces, within a certain distance band, for example, 30 minutes. The most complex definition is the sum of all destinations from a nested mode and the destination choice model, which accounts for the ease of travel by all available modes between the origin and all destinations (Ben-Akiva and Lerman, 1985). The Hansen (1959) formulation is a simpler version of this maximum utility term. He suggests summing all of the
contributions of all reachable destination. Each destination contributes the number of opportunities weighted by the travel time between the origin and itself. The travel time is at the core of all formulations of the general costs of travel. In many cases, it is replaced by the shortest distance. The weighting function expresses the fact that further
destinations are not as useful to the travellers as closer ones. A popular and easy choice is an exponential function of travel time between the origin and location: e
-Traveltime. The is determined empirically.
The downsides are the simultaneous effects of the accessibility improvements, either the higher density of opportunities or the lower generalised costs of travel, i.e. mostly higher speeds. These improvements invite the population and companies to travel more, as travel is a normal good: its consumption increases when its price falls. The vehicle miles travelled (VMT) will increase and, for the current technology, with it the production of CO
2and all other vehicle-produced environmental externalities, such as noise, soot, microscopic particulates, etc. This is generally known as the “rebound” effect.
The higher densities of opportunities, i.e. more residents, workplaces, entertainment facilities, are generally resisted because of the crowding effects in terms of traffic and parking and because of the loss of free space. The medium-term benefits of better services enabled by the crowding are generally doubted and discounted by the voters.
Given today’s awareness and knowledge of the health and climate impacts, this becomes an issue for any investment. Although this depends on the technologies of the vehicles, in particular, their power trains, the shift to electric or H
2power trains has been slow so far.
Some of these external costs can be addressed by the infrastructure itself, for example,
7
noise can be reduced by putting the road or railway line inside tunnels, but this substantially adds to the budgets for the infrastructures themselves. These trade-offs remain difficult, especially as the increases in social welfare reduce the willingness to accept (WTA) the externalities. Wealthier societies are less willing to live in noisy and dirty environments, but not necessarily willing to pay for the tunnels needed. The social willingness to tax
themselves may not grow as fast as the personal willingness to avoid the externalities.
The conflict is further sharpened as the improvement of accessibility by car encourages car ownership (see Becker, Loder, Schmid and Axhausen, 2017). Car ownership in turn reduces the willingness to commit to the use of cleaner public transport, which will result in more VMT and its impacts. The simultaneous improvements in transit accessibilities can
counteract this effect, but only to a certain extent.
The support of sprawl by both car and transit accessibility improvements encourages further VMT. Residents of less-dense residential locations in the urban sprawl will accept longer trip distances for the benefits of better and more affordable housing. Still, they travel to core and tangential locations where they find work or meet their friends. On balance, they are better off and they defend their choices when they are challenged politically or by measures that make them more expensive or tedious. There are doubts about whether the
commuters perceive their costs fully, but no good approach has yet been found to change this.
Box 2 Dilemma of transport policy summarised
Accessibility ∼ Productivity ∼ Social welfare
Accessibility ∼ VMT ∼ CO
2emissions for current fleet technology
Social welfare ∼ 1/WTA traffic’s externalities ∼ Costs per km of infrastructure Car accessibility ∼ Car ownership ∼ 1/Commitment to transit use
Accessibility ∼ Sprawl ∼ VMT
The dilemma of the accelerated changes due to COVID-19
The dilemma discussed is sharpened by the possible longer-term impacts of the pandemic
(See Box 2 for a summary). Two impacts are crucial: the lower attractiveness of public
transport and a population shift towards less dense environments. The pandemic has
highlighted that crowding in buses and trains, never popular, is also an opportunity for the
spread of airborne diseases, such as COVID-19 or the more familiar influenza. It is no
surprise that the willingness to travel by bus or train has dropped, especially as their air
8
conditioning systems are not designed for the air turnover that would be required. Airplane A/C systems are more suitable, but also under challenge from public perception. Given the current funding, none of the operators can afford to operate in the long run under the physical distancing rules imposed for COVID-19 control.
The concern about density is also noticeable in an increasing interest in larger apartments and suburban locations. The pandemic could encourage a new wave of sprawl
7. It might help generate interest in the many houses that the baby boomer generation will vacate in the coming years. One could see this and perhaps an interest in rural areas positively, but it will be necessary to monitor the effect of this on spatial equity, as the movers might sort themselves by income and taste into problematic patterns. In any case, the interest in the urban fringe and rural areas will make the densification of the urban areas that are
necessary to meet climate goals more difficult.
The growth in WFH will reinforce this trend. It requires space at home, and ideally a quiet space for tasks such as call-centre work. Working in the office only one or two times a week instead of five potentially increases the acceptable distance for commuting. This urban sprawl and the potentially reduced usage of public transport will increase car ownership and mileage. The season ticket may no longer be attractive if the number of commutes goes down from, say, 200 to 135 per year. There is no discussion yet about the tariffs required to encourage people to pre-commit themselves to public transport under these conditions.
Overall, the pandemic highlights the conflicts inherent in the dilemma. Economists and transport planners have suggested a solution to the dilemma, but it has never been fully adopted. They suggest charging for the externalities imposed: dynamic congestion pricing by street, dynamic pricing of emissions by street, CO
2taxation, dynamic pricing of parking by location, crowding pricing in trains. The pricing would need a clear formulation of the social goal to be achieved for each of the taxes. Yes, fixing the numbers by political consensus might be “second best” from a theoretical standpoint, but the process would be transparent and open to revision: Say an average of 30 km/h for urban roads, 1000 sFr/t CO
2,35 dB night-time average noise, zero search time for parking, no standing in trains. Note the density bias of these policies, which makes positive policies for the alternatives a necessity.
Here, societies have to answer the question of how they want to travel and live in the still- dense cities needed to avoid the CO
2impacts of a sprawled environment; unless they can find ways to live and produce in a CO
2-goal-compatible way in a sprawled world.
No society has adopted these policies in full, but some cities have imposed road pricing within politically acceptable limits. They have imposed regulations and prohibitions for some of them. They have continued to invest in both roads and public transport systems in spite of the well-known difficulties of shifting car owners away from their fast and
comfortable vehicles. They have continued to improve technologies to obtain more slots with the existing infrastructure: new traffic control systems for railways and roads are examples. The hoped-for gains enabled by automatic vehicles are a further example. They subsidise and now will enforce the adoption of clean power-train technologies, as in, for example, Norway’s ban on non-electric vehicles from 2025. In summary, they have avoided
7 E.g. https://www.nytimes.com/2020/07/17/realestate/coronavirus-suburbs-real-estate.html
9
addressing the dilemma head-on, as there have been no political majorities for it. It will be
interesting to see whether the climate challenge and transport challenges accelerated by
the pandemic will create them.
10