in SW Balkans inferred from Lake Prespa sediments
I n a u g u r a l - D i s s e r t a t i o n zur
Erlangung des Doktorgrades
der Mathematisch-Naturwissenschaftlichen Fakultät der Universität zu Köln
vorgelegt von
Konstantinos Panagiotopoulos aus Athen
Köln, 2013
Prof. Dr. Helmut Brückner Vorsitzender der
Prüfungskommission: Prof. Dr. Martin Melles
Tag der mündlichen Prüfung: 3. Juli 2013
Kumulative Dissertation – Vorlage und Gliederung gemäß Anhang 4 der Promotionsordnung der Mathematisch-Natur- wissenschaflichen Fakultät der Universität zu Köln vom 2. Februar 2006 (geändert durch Artikel I Absatz 10 der Ordnung zur Änderung der Promotionsordnung von 10. Mai 2012).
For the successful completion of this PhD project I owe my appreciation to my supervisor Frank Schäbitz and my advisor Bernd Wagner. Helmut Brückner is also gratefully acknowledged for reviewing this dissertation, which was generously funded by the German Science Foundation (DFG) within the framework of the CRC 806 “Our Way to Europe”.
It was in 2006, while studying in Cologne, when I got a brief introduction to the world of paleoclimate and pollen analysis by Frank. I was instantly intrigued with the idea that these magnificent microfossils had a story to tell to those willing to dig beyond the surface. A couple of years later, Frank offered me the unique opportunity to immerse myself in this minuscule world on a project located in the Balkans and in specific at Lake Prespa. Frank, I am thankful for your trust and support during all these years.
Bernd was instrumental in conceiving and planning this project as he has been active in the region over several years. Thanks for the insightful comments, advice and witty conversations. My introduction and training in pollen identification was made possible through the unconditional support of Jutta Meurers-Balke, head of the Laboratory of Archaeobotany, and her working group at the Institute of Prehistoric Archaeology. My special thanks are due to Ingrid Kloß who generously shared with me her counting routine, enthusiasm and knowledge of European pollen grains and spores. Martin Melles is acknowledged for providing drilling equipment and laboratory facilities at the Institute of Geology and Mineralogy, Hendrik Vogel for leading the successful field campaign at Lake Prespa in October/
November 2009 and Hanna Cieszynski for help with SEM photography. Special credits go to Anne Böhm (Aufgebauer) my PhD partner in Geology with whom we shared countless hours at the lab, the office and the field. This thesis benefited greatly from our close collaboration. We are both obliged to a number of people at the Institute of Geology and Mineralogy that provided help in the lab and in the field.
In addition, I would like to thank all colleagues (and friends) from the Laboratory of Palynology (Geography), especially Jean-Pierre Francois (mi compañero de la oficina), Karsten Schittek (for the German translation of the summary), Jonathan Hense, Verena Foerster, Tsige Gebru-Kassa, Flavia Quintana, Wilfried Schulz, Michael Wille for stimulating conversations, bright ideas, and numerous extra curriculum activities. Steffi Reusch, René Kabacinski, Carina Casimir, Markus Dzakovic, Dominik Berg, Jonas Urban and Jan Wowrek, offered invaluable help in the lab. Tips on cartography and graphical design issues from Frederik von Reumont and Lutz Hermsdorf-Knauth are really appreciated. I am indebted to Iris Breuer and Werner Schuck for help with administrative and financial matters. This project profited significantly from cooperation with several researchers within and outside the CRC 806. I am particularly grateful to Melanie Leng, Thomas Litt, Andreas Hense, Norbert Kühl, Zlatko Levkov, Finn Viehberg, Andreas Andrinopoulos, Marianthi Stefouli, Elena Marinova, Thomas Giesecke, Bernhard Weninger, Valery Sitlivy, Giovanni Zanchetta, Roberto Sulpizio, Lyudmila Shumilovskikh, Benno Thoma, and to several IRTG members. The administrations of the Galičica and Pelister National Parks, the Hydrobiological Institute at Ohrid, the Greek Biotope/Wetland Center (EKBY) at Thessaloniki, and the Society for the Protection of Prespa (SPP) at Prespa are gratefully acknowledged.
I remain of course responsible for any errors.
Last but not least I would like to express my sincerest gratitude to my friends, the Müller family and my family for their unreserved support.
a.s.l. above sea level
AMS accelerator mass spectrometry
AP arboreal pollen
CRC collaborative research center
D-O Dansgaard-Oeschger
ESR electron spin resonance
GI Greenland interstadials
GMWL global meteoric water line
GS Greenland stadial
H1 Heinrich event 1
HI hydrogen index
IRD ice rafted debris
ka cal BP thousand years calibrated before present
LEL local evaporation line
LGM last glacial maximum
LZ (or L) lithozone
MIS marine isotope stage
MMWL Mediterranean meteoric water line
NAP non arboreal pollen
NGRIP north Greenland ice core project
OI oxygen index
OM organic matter
P-1(a) Prespa pollen assemblage (sub)zone 1(a) PAZ(s) pollen assemblage zone(s)
PBO Preboreal oscillation
PCA principal component analysis
S1 Sapropel 1
SEM scanning electron microscope
SST(s) sea surface temperature(s)
TC total carbon
TIC total inorganic carbon
TIDC total dissolved inorganic carbonate
TN total nitrogen
TOC total organic carbon
TS total sulfur
XRD x-ray diffraction
XRF x-ray fluorescence
YD Younger Dryas
Acknowledgements i Abbreviations ii Figures viii Tables xiii
I Introduction 1
1.1 Preface 1
1.2 Research objectives, methodology and thesis structure 3
1.3 General setting 5
1.3.1 Study area 5
1.3.2 Geology 6
1.3.3 Climate 6
1.3.4 Vegetation 7
1.3.5 Lake Prespa morphology and hydrology 10
1.4 State of research 12
1.4.1 Core lithology and correlation 12
1.5 Chronology of core Co1215 14
II Climate and environmental change in the Balkans over the last 17 ka recorded in
sediments from Lake Prespa (Albania/F.Y.R. of Macedonia/Greece) 16
2.1 Introduction 17
2.2 Regional setting 18
2.3 Material and methods 19
2.3.1 Core recovery 19
2.3.2 Analytical work 19
2.4 Results 21
2.4.1 Lithology and biogeochemistry 21
2.4.2 Pollen record 21
2.4.3 Ostracod record 22
2.4.4 Chronology 23
2.5 Discussion and interpretation 26
2.5.1 Late Glacial (17.1 - 15.7 ka cal BP) 26
2.5.2 Late Glacial to Holocene transition (15.7 - 11.5 ka cal BP) 30
2.5.3 Early Holocene (11.5 - 8.3 ka cal BP) 32
2.5.4 The “8.2 ka event” (8.3 - 7.9 ka cal BP) 34
2.5.5 Mid Holocene (7.9 - 1.9 ka cal BP) 34
2.5.6 Late Holocene (1.9 ka cal BP - present) 36
2.6 Conclusions 37
2.7 Acknowledgments 37
2.8 References 38
III Vegetation and climate history of the Lake Prespa region since the Lateglacial 43
3.1 Introduction 44
3.2 Study site 46
3.3 Materials and Methods 47
3.3.1 Chronology 47
3.3.2 Sedimentological analyses 47
3.3.3 Palaeontological analyses 47
3.4 Results 48
3.4.1 Age model 48
3.4.2 Pollen Assemblage Zones 50
3.5 Discussion 52
3.5.1 Late Pleniglacial/Oldest Dryas (P-2c; c. 17 000 – 15 000 cal BP) 52 3.5.2 Bølling/Allerød Interstadial (P-2b; c. 15 000 – 13 200 cal BP) 54
3.5.3 Younger Dryas (P-2a; c. 13 200 – 11 500 cal BP) 55
3.5.4 Early Holocene (P-1e; c. 11 500 – 8 300 cal BP) 57
3.5.5 8.2 event (P-1d; c. 8 300 cal BP – 7 900 cal BP) 58
3.5.6 Middle and Late Holocene (P-1c, P-1b, P-1a; c. 7 900 cal BP – present) 59
3.6 Conclusions 62
3.7 Acknowledgements 63
3.8 References 63
IV Understanding past climatic and hydrological variability in the Mediterranean from
Lake Prespa sediment isotope and geochemical record over the Last Glacial cycle 68
4.1 Introduction 69
4.2 General setting 69
4.3 Material and methods 70
4.3.1 Stable isotope analysis of modern waters 71
4.3.2 Stable isotope and Rock Eval analysis of organic matter 71
4.3.3 Pollen data 73
4.3.4 Stable isotope and XRD analysis of carbonates 73
4.4 Chronology 74
4.5 Results 76
4.5.1 Modern waters 76
4.5.2 Prespa core Co1215 data 76
4.6 Discussion 77
4.6.1 Modern water oxygen and hydrogen isotope composition 77
4.6.2 Modern water carbon isotope composition 78
4.6.3 Sources of organic matter in the Lake Prespa sedimentary record 78 4.6.4 Carbon isotope composition of organic matter from Lake Prespa 80 4.6.5 Oxygen and carbon isotope composition of carbonate from Lake Prespa: MIS 5-1 82 4.6.6 Comparison of δ18O between Prespa, Ohrid and other lakes in the region from 15 ka 84
4.6.6.1 Late Glacial to Holocene transition 84
4.6.6.2 Early Holocene 85
4.6.6.3 Middle Holocene humidity 86
4.6.6.4 Late Holocene 86
4.7 Conclusions 87
4.8 Acknowledgements 88
4.9 References 88
V Climate variability since MIS 5 in SW Balkans inferred from multiproxy analysis of
Lake Prespa sediments 93
5.1 Introduction 94
5.2 Physical setting 95
5.3 Material and Methods 96
5.3.1 Geochemical analyses 96
5.3.2 Palynological analyses 97
5.3.3 Chronology 98
5.4 Results 99
5.4.1 Lithology and Geochemistry 99
5.4.2 Pollen Assemblage Zones (PAZs) 99
5.5 Discussion 101
5.5.1 The Prespa paleoarchive 101
5.5.1.1 Vegetational and limnological feedbacks to climate variability at a local scale 101 5.5.1.2 Temporal and spatial development of local ecosystems 105
MIS 5 (c. 92 – 71 ka cal BP; P-10 to P-8) 105
MIS 4 (c. 71 – 57 ka cal BP; P-7 and P-6) 105
MIS 3 (c. 57 – 29 ka cal BP; P-5 and partly P-4) 106
MIS 2 (c. 29 – 14 ka cal BP; partly P-4 to P-2c) 106
MIS 1 (c. 15 ka cal BP to Present; partly P-2b to P-1) 108 5.5.1.3 Understanding ecological processes, triggers and thresholds 108
5.5.2 Comparison with regional and global records 110
5.5.2.1 Mediterranean records 110
5.5.2.2 Global records 111
5.5.3 Environmental constraints posed on hominid populations 112
5.6 Conclusions 114
5.7 Acknowledgements 115
5.8 References 115
VI Towards a theoretical framework for analyzing integrated socio-environmental systems 119
6.1 Introduction 120
6.2 The theory of resilience and adaptive cycles (according to Gunderson and
Holling) 120
6.3 Case studies 122
6.3.1 The small scale of observable human-environment interaction and its simulation in forager
studies (TW, MS - project E3) 123
6.3.2 Demographic cycles in the Central European Neolithic (RP, AZ - project D2) 126 6.3.3 Analysis of the palaeodemography of hunters and gatherers during the Late Upper
Palaeolithic in Europe (IK, AZ - project E1) 128
6.3.4 The cascade model - societal reorganization by Palaeolithic hunter-gatherers as a reaction of
climatic instability (MB, AP, GCW - project C1) 130
6.3.5 Adaptive cycles: the lake Prespa case study (FS, KP, AA, BW - project B2) 132 6.3.6 Environmental response to agricultural land use practices in relation to sediment flux and
storage in hillslope systems (MSch, TH, RD - project D3) 134
6.4 Time series, spatial scales and models 137
6.4.1 Where do we come from? 137
6.4.2 Where are we heading to? 137
6.5 Conclusion 139
6.6 Acknowledgments 141
6.7 References 141
VII Exploratory analyses and microcharcoal results 144
7.1 Microscopic Charcoal 144
7.2 Numerical analyses 144
7.2.1 Box plots 144
7.2.2 Ordination 146
7.2.3 Rarefaction 148
VIII Synthesis and Discussion 149
8.1 Watershed hydrology and sedimentation mechanisms 149
8.2 Reconstructing Prespa’s ecosystems over the last 92 ka 153
8.3 Vegetation dynamics at the Dessarate Lake region 156
8.4 Conclusions and outlook 160
References 163 Summary 167 Zusammenfassung 168 Περίληψη 169
A SEM Images 170
B Pollen and spore taxa 171
C Palynological data of Co1215 174
Chapter Contributions 175
Erklärung 177
Figure 1 Synopsis of analyses already performed on material from Lake Prespa and included in this thesis.
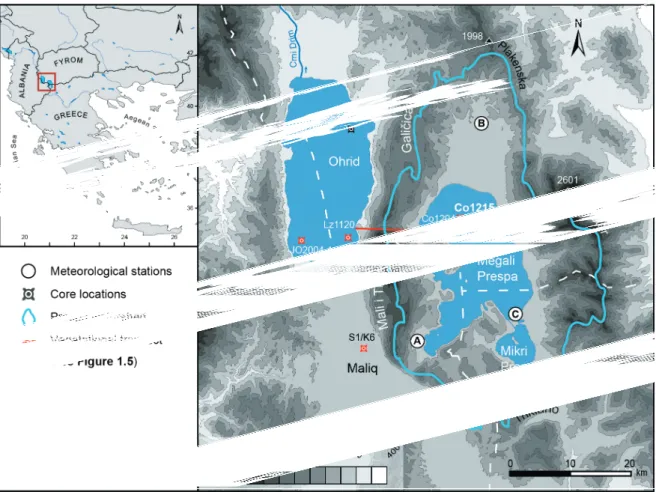
Note that for non-destructive methods sampling intervals are given in mm. 3 Figure 2 Location of study area in southwestern Balkans and topography. Locations and codes of palaeo-
records mentioned in the text: Co1215 (this study), Co1216 (Wagner et al., 2012), Co1204 (Leng et al., 2010; Wagner et al., 2010), Co1202 (Vogel et al., 2010a, b; Wagner et al., 2010), JO2004-1 (Belmecheri et al., 2009; Lézine et al., 2010), Lz1120 (Wagner et al., 2009, 2010), and S1/K6 (Denèfle et al., 2000; Bordon et al., 2009). Pollen archives are indicated in red (SRTM
Data: Jarvis et al., 2008). 5
Figure 3 Mean annual precipitation and temperature (data from WorldClim; Hijmans et al., 2005). 6 Figure 4 Ombrothermic diagrams of selected meteorological stations within the Prespa catchment (data
compiled from Strubenhoff and Hoyos, 2005). 7
Figure 5 Vegetational transect across the Galičica Mountain and schematic underground connection be- tween Lake Prespa and Lake Ohrid (SRTM Data: Jarvis et al., 2008; adapted after Matevski et al.,
2011; Popovoska and Benacci, 2007). 8
Figure 6 Typical forest ecosystems: Pinus peuce forming the treeline with Vaccinium myrtillus as dominant understory species on Pelister (a, b), Fagus sylvatica with Abies borisii-regis forming the treeline on Galičica (c), pure Fagus sylvatica stand (d), mixed thermophilous oak-dominated forests on the eastern flank of Galičica Mountain near the village of Stenje (e), Quercus cerris stand on Galičica (f). Note the rich herbaceous layer of the oak stand (f) in contrast to the beech one (d). Photos
taken during the June 2011 field campaign by the author. 9
Figure 7 Lake-level fluctuations of Lake Prespa (from Strubenhoff and Hoyos, 2005). 10 Figure 8 Simplified bathymetry of Lake Prespa (based on unpublished data from Andrinopoulos A. for
IAEA Project RER/8/008; Stefouli M., personal communication). Locations of water-level gaug- es: (a) Liqenas/Pustec, (b) Stenje, (c) Psarades. Surface currents and hydroacoustic profiles are also shown. 11 Figure 9 Panoramic view of Lake Prespa from the Galičica Mountain. Core locations and landmarks are
indicated. Core lithology and correlations (adapted after Böhm, 2012; Wagner et al., 2012). 12 Figure 10 Map of the Mediterranean region (a) showing the location of lakes Prespa, Ohrid and Maliq (gray
rectangle) on the Balkan Peninsula and palaeoenvironmental reconstruction key sites referred to in the text (black dots): MD95-2043 (Cacho et al., 1999), Lago Grande di Monticchio (Allen et al., 1999, 2002), Ioannina (Tzedakis et al., 2002; Lawson et al., 2004), Tenaghi Philippon (Kotthoff et al., 2008; Müller et al., 2011), SL148 and SL152 (Kotthoff et al., 2008, 2011), Soreq Cave (Bar-Matthews et al., 1999, 2003). (b) Detailed map of lakes Prespa, Ohrid and Maliq showing coring location Co1215 (yellow dot) at Lake Prespa with seismic profile (A-A’) across the coring location. (c) and other sites nearby (white dots) referred to in the text: Lake Prespa Co1204 (Leng et al., 2010; Wagner et al., 2010), Lake Ohrid Co1202 (Vogel et al., 2010a, 2010b; Wagner et al., 2010) and Lake Maliq (today dried up) K6 (Bordon et al., 2009). 17 Figure 11 Age-depth model for core Co1215 (320-0 cm depth) based on radiocarbon dating and teph-
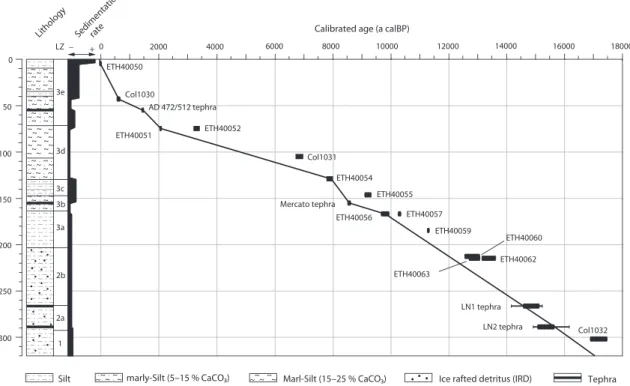
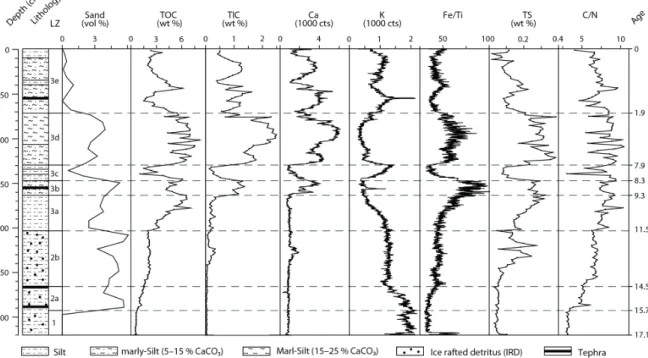
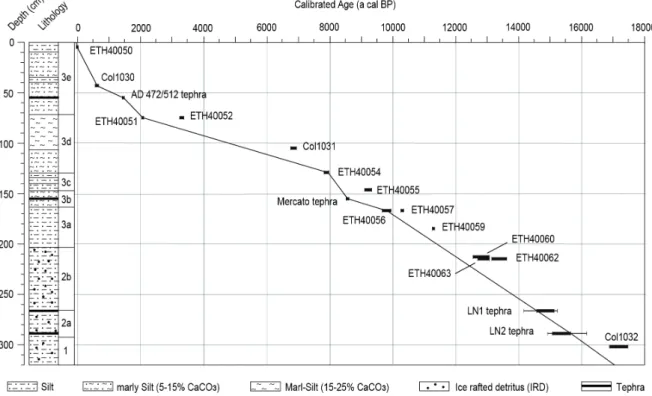
rostratigraphy. The calibrated ages of tephras LN1 and LN2 are given in 1σ (thick line) and 2σ (thin line) ranges. Reliable chronological tie points were interpolated on a linear basis. The lithol- ogy, lithozones (LZ) and the sedimentation rate are also indicated. 23 Figure 12 Lithology, lithozones (LZ), sand content (vol %), total organic carbon (TOC) and total inorganic
carbon (TIC) content (wt %), calcium (Ca) and potassium (K) intensities (103 counts), iron/tita- nium (Fe/Ti) ratio, total sulfur (TS) content (wt %), carbon/nitrogen (C/N) ratio and age (ka cal BP) of LZ of core Co1215 from Lake Prespa (320-0 cm depth). Dashed lines in the figure mark
transitions of lithozones. 27
Figure 13 Pollen zones (PZ), pollen percentages of trees, shrubs, herbs, Pinus, Abies, Quercus, mixed decidu- ous (temperate) trees, Artemisia, Chenopodiaceae, Mediterranean and anthropogenic taxa, as well as sample depths treated for ostracod analysis, total number of adult and juvenile ostracods (valves
per 5 g), adult species of members of Cytheroidea, and members of Cypridoidea, and age (ka cal BP) of LZ of core Co1215 from Lake Prespa (320-0 cm depth). Dashed lines in the figure mark
transitions of lithozones. 27
Figure 14 Lithology, lithozones (LZ), sand content (vol %), total organic carbon (TOC) and total inorganic carbon (TIC) content (wt %), potassium (K) intensities (103 counts), iron/ titanium (Fe/Ti) ra- tio, total sulfur (TS) content (wt %) and carbon/nitrogen (C/N) ratio, as well as pollen zones, pol- len percentages of trees, shrubs, other herbs, Chenopodiaceae, Artemisia, Pinus, Abies, Quercus, mixed deciduous (temperate) trees, anthropogenic taxa, Mediterranean taxa and total number of adult ostracod (valves per 5 g) of core Co1215 from Lake Prespa (17,100-0 a calBP). Dashed lines in the figure mark transitions of time intervals discussed in Section 2.5. Explanation of abbrevia- tions: LG = Late Glacial, TR = Late Glacial to Holocene Transition, B/A = Bølling/Allerød, YD =
Younger Dryas, Hol. = Holocene. 28
Figure 15 Total organic carbon (TOC) content (wt %), total inorganic carbon (TIC) content (wt %), and potassium (K) intensities (103 counts) of core Co1215 from Lake Prespa (17,100-0 a cal BP) in comparison with summer precipitation (Psummer) and winter precipitation (Pwinter) (mm) of pollen-based quantitative reconstructions from Lake Maliq (Bordon et al., 2009), δ18O values (per mill PDB) from Soreq Cave speleothems (Bar-Matthews et al., 2003), Sea surface temperatures (SST) (˚C) reconstructed from core MD95-2043 of the Alboran Sea (Cacho et al., 1999) and d18O values (per mill SMOW) of the GISP2 Greenland ice core (Grootes et al., 1993). Dashed lines in the figure mark transitions of time intervals discussed in chapter 2.5. Explanation of ab- breviations: LG = Late Glacial, TR = Late Glacial to Holocene Transition, B/A = Bølling/Allerød,
YD = Younger Dryas, Hol., H. = Holocene. 29
Figure 16 Locations of selected terrestrial pollen records and of Lake Prespa (star). Records with charcoal data are marked with a square, flora migration routes are indicated with arrows and highlands (above 1000 m a.s.l.) in gray: 1. Ohrid, 2. Maliq, 3. Nisi, 4. Kastoria, 5. Rezina, 6. Gramousti, 7.
Ioannina, 8. Trilistnika, 9. Tenaghi Philippon, 10. Eski Acigöl, 11. Van, 12. Monticchio, 13. Accesa. 44 Figure 17 Topography of Lake Prespa. Lake catchment (blue line), core location (Co1215) and vegetation
transects (black lines) are shown (SRTM Data: Jarvis et al., 2008). 45 Figure 18 Simplified altitudinal vegetation belts on a transect of the Lake Prespa catchment (SRTM Data:
Jarvis et al., 2008). 45
Figure 19 Age-depth model with lithology of core Co1215 (modified from Aufgebauer et al., 2012). Reli-
able age control points were interpolated on a linear basis. 49
Figure 20 Pollen percentage diagram of core Co1215: selected trees, shrubs and vines (Exaggeration x 10). 52 Figure 21 Pollen percentage diagram of core Co1215: selected herbs, aquatics and ferns (Exaggeration x 10). 53 Figure 22 Composite diagram of core Co1215: pollen percentages of trees, shrubs and herbs; potassium
counts; total organic carbon percentages; accumulation rates of selected pollen taxa, green algae,
fungi, micro-charcoal and terrestrial pollen. 54
Figure 23 Lake Prespa in SE Europe, situated between Albania, Macedonia and Greece. Coring location of
Co1215 is marked. 69
Figure 24 The isotopic (a: δ18O and δD; b: δ13CTDIC and δ18O) composition of present day waters from Lake Prespa and springs. The Global Meteoric Water Line (GMWL) and the Mediterranean Me- teoric Water Line (MMWL) (cf. Anovski et al. (1991) and Eftimi and Zoto (1997)) are also given on (a) with the calculated Local Evaporation Line (LEL). All but the June 2011 data are from data
compiled in Leng et al. (2010). 72
Figure 25 Multi-proxy data from Lake Prespa core Co1215. The data fall into zones which roughly equate to Marine Isotope Stages which are marked. The chronology is based on published dates given on the left hand side of the figure. (The oxygen isotope composition of carbonate was obtained from
calcite in MIS 1 and siderite in all other zones). 75
Figure 26 Lake Prespa organic matter on a van Krevelen-type discrimination plot (after Meyers and Lallier-
Vergès, 1999). 79
Figure 27 A composite pollen diagram including concentration curves of green algae (Pediastrum and Bot- ryococcus), dinocysts, aquatics (macrophytes) total pollen (including fern spores) and percentage
curve of arboreal (AP) versus non-arboreal pollen (NAP). 81
Figure 28 Comparison of oxygen isotope profiles form Lake Prespa core Co1215, to cores from Lake Ohrid and other lakes from around the Mediterranean over the Holocene where carbonate data can be compared (data in Roberts et al., 2008 and references therein). 85 Figure 29 Locations of selected records discussed and of Lake Prespa (star); archaeological sites are marked
with an open circle. Note the paleocoastline at 100 m (in brown) and possible dispersal routes of
modern humans (arrows). 94
Figure 30 Topography of Lake Prespa. Lake catchment (blue line) and core locations (Co1215, this study)
are shown (SRTM Data: Jarvis et al., 2008). 95
Figure 31 Age model of core Co1215 with lithology. Reliable age control points were interpolated on a linear basis. 98 Figure 32 Pollen percentage diagram of core Co1215: selected trees, shrubs, herbs, and aquatics. Evergreen
Quercus is presented in gray; Asteracae* does not include Artemisia; emergent (E), submerged (S) and floating (F) aquatic plants are marked. Lithology, marine isotope stages (MIS), pollen assem-
blage zones (PAZ), and CONISS are shown. (Exaggeration x10) 100
Figure 33 Selected biological, geophysical and geochemical proxies from Lake Prespa (core Co1215) plotted against age. (a) Artemisia (dashed line), AP/NAP (black), and Pinus (green) pollen percentages;
mean July insolation at 40 ˚N (W/m2; red); sapropels (S1, S3); and Y5 tephra layer, (b) Titanium (Ti) counts, (c) Atomic C/N, (d) Concentrations (x 105) of arboreal pollen (AP; black), green algae (green) and dinoflagellates (purple), (e) Concentrations (x 104) of aquatics (blue), Botryococ- cus (red) and Pediastrum (green). Note the difference in scale, (f) Total organic carbon (wt %) and siderite (s) peaks are marked, (g) Total inorganic carbon (wt %), (h) Iron/titanium (Fe/Ti). Shaded intervals correspond to carbonate peaks precipitated in Lake Prespa during the Last Glacial. 104 Figure 34 Comparison of Prespa proxies with regional and global records. (a) Ice oxygen isotopes (‰) mea-
sured in NGRIP (GICC05) with Dansgaard-Oeschger (D-O) warming events/Greenland in- terstadials (GI) numbered; Last Glacial Maximum is indicated, (b) Alkenone derived (Uk’37) sea surface temperatures (SSTs) measured in core MD01-2444 from the Atlantic Ocean, (c) Oxygen isotopes (‰) measured in speleothems from Soreq cave (Israel) and sapropel depositions (S1, S2) in the eastern Mediterranean Sea, (d) AP/NAP (black) and AP minus Pinus and Juniperus (green) pollen percentages in I-284 from Lake Ioannina (Greece), (e) AP/NAP (black) and Quer- cus (green) pollen percentages from Lago Grande di Monticchio (Italy), (f) AP/NAP (black) and Quercus (green) pollen percentages from Lake Prespa; mean July insolation at 40 ˚N (W/m2; red), (g) Calibrated radiocarbon ages from neighboring sites with modern human remains. Gray bars
correspond to Heinrich events in MD01-2444. 107
Figure 35 Adaptive cycle model (adapted from Resilience Alliance, 2011). 121 Figure 36 Spatial and temporal scales of case studies dealt within Sections 6.3.1 - 6.3.6. 123
Figure 37 Band dynamics in terms of adaptive cycle phases. 124
Figure 38 Phases of fission and fusion in longitudinal perspective. 125 Figure 39 Transformation and organization phases of a cyclical model of forager mobility. 125 Figure 40 Fore loop (r- and K-phases) and back loop (a- and U-phases) of the adaptive cycle. 126 Figure 41 The Linearbandkeramik culture as a dynamic system passing through the growth, conservation
and disturbance phases of the adaptive cycle. (a) Number of houses per pottery style phase (Zim- mermann et al., 2009, Figure 6); (b) Pottery ornamentation diversity; (c) Percentage of Bohemian adzes (Nowak, 2008); (d) Percentage of Rijckholt flint in the settlement Erkelenz-Kückhoven (Mischka, 2004); (e) Percentage of unmodified flakes (Mischka, 2004); (f) Occurrence of cem-
eteries, ditched enclosures and peregrine pottery. 127
Figure 42 Sizes of settlement areas in different European settlement regions (settlement areas - gray poly-
gons; raw material catchments - hatched polygons). The settlement regions of the Rhine-Meuse area and Central Europe comprise both around 20,000 km2, southwestern France more than 45,000 km2. The settlement region of Southwestern France comprises multiple times the number of minimal settlement areas found in Northwestern or Central Europe. 129 Figure 43 Population dynamics in terms of adaptive cycle phases. 130 Figure 44 Archaeological cascade model; the adaptive cycle was mirrored along the vertical axis to underline
the hierarchic succession of the modes of reorganization (adapted from Bradtmöller et al., 2012). 130 Figure 45 Titanium counts and non-arboreal pollen (NAP) in % of Lake Prespa. 132 Figure 46 Phase diagram of erosion and disturbed land in the catchment of Lake Prespa (Titanium counts
versus non-arboreal pollen in %). 133
Figure 47 Cumulative Probability Functions (CPF) of 14C ages. 51 overbank ages (top) and 62 slope ages (below) reflecting differential activities of overflow sedimentation and sediment flux at the hill- slope scale. Gray shaded areas mark phases where the CPF is larger than the mean probability of the corresponding CPF (modified after Hoffmann et al., 2008). 135 Figure 48 Hypothetical adaptive cycle of the coupled hillslope-land use system in terms of hillslope and soil
stability, and resilience. 136
Figure 49 Microcharcoal fragment concentrations and accumulation rates in Co1215. Notice the accentu- ated peaks in the microcharcoal accumulation rate curve (b) within intervals of increased sedimen- tation rate (c). The Holocene (yellow) and MIS 5 (green) are separated by dashed lines from the interval including MIS 4, MIS 3, MIS 2 and the Lateglacial transition (blue). 144 Figure 50 Box plots of selected palynological variables and groups in Co1215 during the Holocene, the MIS
2-4 and MIS 5. Note the different number of observations for each interval. The box contains the 25-75 percent quartiles, the median is indicated with a horizontal line within each box, while whiskers extend up to 1.5 times the inter-quartile range. Outliers are shown as circles (values out- side the whiskers within 1.5 - 3 box length) and stars (more than 3 box length). 145 Figure 51 PCA biplot showing major species (n = 37) and samples (n = 170). NAP taxa are indicated in
black, while AP taxa (trees and shrubs) in gray. 146
Figure 52 Plots of the Lake Prespa (Co1215) sample scores (n = 170) on the first and second principal component axes in stratigraphical order. The top and base of the sequence are indicated, as well as transitions between the three major intervals, which follow the color code of this chapter, the 95%
sample concentration ellipses for each interval are also marked. (b) Local pollen assemblage zones are indicated for the MIS 5 interval (n = 38). Excursions of samples belonging to P-9 and P-8a in the direction of the MIS 2-4 ellipse are indicated by dashed lines. 147 Figure 53 Plot of expected number of pollen taxa for 165 samples with 95% confidence intervals. The
dashed lines delimit the Holocene, MIS 2-4 and MIS 5 intervals. The Last Glacial Maximum is
also indicated 148
Figure 54 Lithology and geochemistry of existing composite cores from Lake Prespa to date. Correlation between cores is indicated by gray lines (modified from Böhm, 2012). 150 Figure 55 Pollen concentrations and accumulation rates, total organic carbon, sand percentages, iron/ti-
tanium ratio and sediment accumulation rates in Co1215. The gray bars delimit intervals with
peaking sedimentation rate. 151
Figure 56 The relationship between pollen and charred particle accumulation rates and sedimentation rates in Co1215. Analysis based on 169 samples (a sample within the Y–5 tephra layer was removed). 152 Figure 57 Synoptic diagram of selected proxies from Lake Prespa (Co1215). 154 Figure 58 Regional pollen assemblage zones inferred from three representative Dessarete Lakes pollen re-
cords: Co1215 (Panagiotopoulos et al., 2013), S1/K6 (Denèfle et al., 2000; Bordon et al., 2009) and Lz1120 (Wagner et al., 2009). Zonation of the Prespa pollen record was performed using cluster analysis and the resulting local PAZs are described in detail in Chapters III and V. For S1/
K6 solid lines represent the PAZ limits found in Denèfle et al.(2000), while dashed lines show
modifications after Bordon et al. (2009). Zone names were assigned following the naming scheme of Co1215 in order to facilitate comparison. The onset of the Holocene is marked in gray. The 8.2 event can be distinguished in all pollen records from the region (it is indicated with dashed lines
in Lz1120). 156
Figure 59 Simplified pollen diagrams from Lake Prespa (Co1215; Panagiotopoulos et al., 2013) and Lake Ohrid (Lz1120; Wagner et al., 2009) plotted against depth. The gray box includes the interval
documented in both cores. 158
Figure 60 Scanning electron microscope images of palynomorphs encountered in the upper 2 cm of Co1215. Samples from refrigerated material were processed using standard palynological tech- niques and stored in ethanol before mounting on a specimen pin stub. A scale of 10 μm is shown unless indicated otherwise. Gonyaulax apiculata (cf. Evitt et al., 1985; Kouli et al. 2001; a – e) and Pediastrum boryanum (f). Notice the morphological variations in parasutural development and
the occasional formation of ridges (c, d). 170
Table 1 Designated protected areas within the Prespa catchment (data from Society for the Protection of Prespa). 8 Table 2 Characteristics of the Prespa Lakes (compiled from Zacharias et al., 2002 and Matzinger et al., 2006). 10
Table 3 Cores retrieved from Lake Prespa. 13
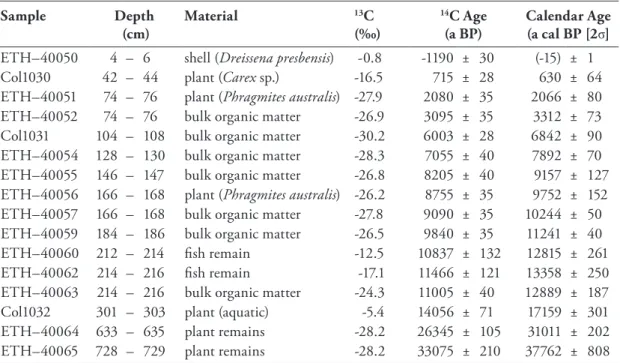
Table 4 Radiocarbon dating carried out at the AMS facilities of the Federal Institute of Technology (ETH) Zurich (Switzerland). The radiocarbon ages were converted into calendar years (a cal BP) using CALIB 6.1.0 (Stuiver et al., 2012), based on the INTCAL09 calibration curve (Reimer et al., 2009). Sample ETH–40050 was calibrated using the Levin.14c dataset (Levin and Kromer, 2004). 14 Table 5 ESR dating performed at the Geochronological Laboratory of the Institute of Geography (Uni-
versity of Cologne) and dose rate calculation of internal (shells) and external (bulk) radionuclide content were determined at the by ICP-MS analysis at the Institute of Geology and Mineralogy (University of Cologne), the VKTA Laboratory (Dresden) and the Geochronological Laboratory
(University of Cologne). 14
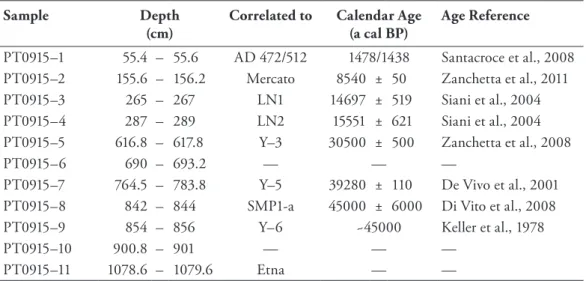
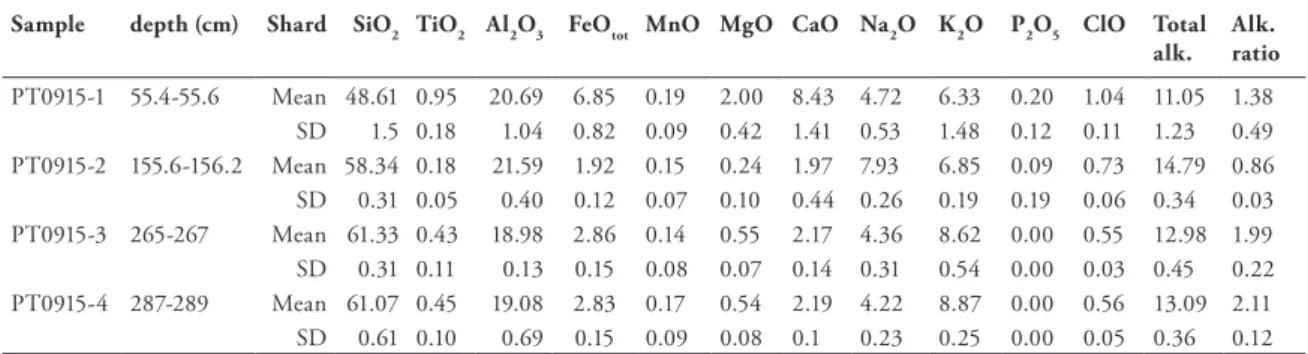
Table 6 Tephra layers identified in Co1215. Tephra identification and correlation were performed at the Institute of Geology and Mineralogy (University of Cologne) and the Earth Sciences Department
of the University of Pisa (Italy). 15
Table 7 AMS dates and δ13C from Lake Prespa core Co1215, which were measured at the ETH Labora- tory of Ion Beam Physics in Zurich, Switzerland. Depths, materials chosen as well as radiocarbon ages and calendar ages are given. The radiocarbon ages of all samples were calibrated into calendar years before present (a cal BP) using the INTCAL09 calibration curve (Reimer et al., 2009), ex- cept of sample ETH-40050, which was calibrated with the Levin.14c dataset (Levin and Kromer, 2004). 24 Table 8 Major element compositions of tephras identified in core Co1215. 25
Table 9 Geochemical data of correlated tephra layers. 25
Table 10 AMS dates and identified tephra layers in core Co1215. 49
Table 11 Synoptic description of pollen assemblage zones (PAZs). 50 Table 12 Characteristics of Lake Prespa (data from Matzinger et al., 2006a; Wilke et al., 2010). 70 Table 13 Pollen of trees, shrubs, vines and tree parasites counted in Co1215. 171
Table 14 Pollen of herbs counted in Co1215. 172
Table 15 Pollen of aquatic plants, spores of ferns and fungi, coenobia of green algae and dinocysts counted
in Co1215. 173
1.1 Preface
How can fossil pollen grains originating from a remote area of the Balkan Peninsula be relevant to pressing policy issues dealing with the biodiversity and climate change agenda? In what way does the paleoecological archive of Lake Prespa contribute to our knowledge of spatial and temporal vegetational patterns in southeastern Europe? Did the study area serve as a refugium of plant species during the Last Glacial? Which ecological and/or environmental factors controlling changes in terrestrial and aquatic ecosystems within the watershed are identified besides climate variability? Is it possible to infer the duration, nature and extent of climate oscillations from the paleovegetation record? Did regional environmental and climatic conditions facilitate or hinder the establishment of hominid populations at Prespa and its vicinity? Is it possible to trace the imprint of anthropogenic activity on the landscape and discern it from natural processes?
In order to address the issues raised above, there is a need to put the research undertaken within this dissertation into a broader perspective. To begin with, in 1988 the United Nations Environ- mental Program (UNEP) and the World Meteorological Organization (WMO) established the Intergovernmental Panel on Climate Change (IPCC), a scientific body assigned to investigate the potential environmental and socio-economic impacts of climate change and assess options for mitigation and adaptation. Hitherto, the IPCC has produced four comprehensive assessment reports and played an instrumental role in the creation of the UN Framework Convention of Climate Change (UNFCCC), which was opened for signature in June 1992 at the UN Con- ference on Environment and Development at Rio de Janeiro. The Convention on Biological Diversity (CBD) was also ready for signature during the “Rio Earth Summit” and entered into force in 1993 while the UNFCC in 1994. The ensuing Protocols (e.g. Kyoto and Nagoya) were conceived as the legal instruments for implementing the objectives laid down by the respective conventions. The overarching goal of the two conventions are to prevent human interference with the climate system (UNFCCC, 1992) and to conserve genetic, species and ecosystem di- versity (CBD, 1992).
In the latest IPCC Assessment Report (AR4) released in 2007, it is described that atmospheric concentration of greenhouse gases has grown significantly since pre-industrial times. For in- stance, carbon dioxide global atmospheric concentration has increased from about 280 ppm in 1850 to 379 ppm in 2005 exceeding by far the natural range over the last 650,000 years (i.e. 180 to 300 ppm) as determined from ice cores. In addition, the average global surface temperature has risen by 0.74 ˚C since 1899 as a result of anthropogenic activities (IPCC, 2007). A warming of about 0.2 ˚C per decade is projected for a range of emission scenarios, summing up to 1.8-4
˚C by the year 2100 if no action is taken. Even if greenhouse gas concentrations were to be stabilized, anthropogenic warming and sea level rise would continue for centuries (IPCC, 2007).
The Millennium Ecosystem Assessment (MEA, 2005) concluded that human-induced changes in ecosystems have accelerated and intensified over the last 50 years leading to unprecedented losses in global biodiversity. Changes in land use, climate, atmospheric CO2 concentrations and
eutrophication have been identified as major drivers of global biodiversity change (e.g. Sala et al., 2000; Pereira et al., 2010). At a global scale, Mediterranean and alpine ecosystems are projected to experience large biodiversity losses due to land-use and climate change respectively (Sala et al., 2000), while freshwater ecosystems are expected to experience increasing pressure due to climate change and eutrophication (Leadley et al., 2010). In Europe, abandonment of agricultural land and subsequent expansion of forests is modeled to lead to a net carbon uptake in terrestrial ecosystems between 1990 and 2100, but most likely it will be offset by increasing CO2 emissions and human-induced climate change (e.g. Zaehle et al., 2007).
The Mediterranean basin is one of the world’s biodiversity hotspots featuring high species rich- ness and an exceptional concentration of endemic species (4.3% or 13,000 of the world’s 300,000 plant species as endemics), but only an estimated 4.7% of the original extent of primary vegeta- tion remains undisturbed (Myers et al., 2000). Factors limiting the geographical range (habitat distribution) of species pose a serious threat to local populations and increase their extinction risk (e.g. Thomas et al., 2004). In the light of projected climate warming for the Mediterranean (IPCC, 2007), the occurrence of frequent droughts and changes in fire regime are estimated to affect plant species distribution in this region significantly. Niche-based models predict an excess of species loss for Mediterranean mountain regions, such as in the Balkans and the Carpathians, considering the marginal character of these habitats for many species (Thuiller et al., 2005).
Given the higher disturbance frequency (e.g. wildfires) and human-induced habitat fragmenta- tion associated with changes in land use, Mediterranean mountain plant species become more vulnerable and are expected to face increasing extinction risk (endemics in particular) due to their limited migration potential. However, the survival of species in favorable locations (i.e.
refugia) in mountain regions can not be accurately estimated considering the grid scale applied in most studies (e.g. 50 x 50 km in Thuiller et al., 2005).
Paleoecological data underscore the potential of Mediterranean mountain regions to serve as refugia for flora and fauna during preceding climate oscillations (e.g. Griffiths et al., 2004;
Médail and Diadema, 2009). Quaternary refugia preserved plant diversity over multiple glacial cycles and frequently coincide with regional biodiversity hotspots (Médail and Diadema, 2009).
Archives of past biodiversity changes have the potential to extent existing ecological datasets over millennial time scales allowing to test models and hypotheses, and to improve our understand- ing over ecological and evolutionary processes. In this regard, paleoecological input is critical in comprehending the rate and nature of biotic response to climate change. Paleoarchives record the complex interplay between abiotic and biotic factors and processes -such as species migration and extinction as well as rapid compositional turnover and resilience of ecosystems- and provide an important resource for conservation planning (e.g. Taberlet and Cheddadi, 2002; Willis et al., 2010).
1.2 Research objectives, methodology and thesis structure
This study investigates sediments retrieved from Lake Prespa by means of palynological analy- ses and forms an integral part of Project B2 within the Collaborative Research Center (CRC) 806 ‘Our Way to Europe: Culture-Environment Interaction and Human Mobility in the Late Quaternary’. The CRC 806 takes on the dispersal of modern humans from Africa into Europe applying a wide range of archaeological, ethnological and geoscientific methods (Richter et al., 2012a). In this framework, Project B2 aims at providing paleoenvironmental data in order to infer climate oscillations over the Last Glacial and the Holocene at a local and regional scale.
Considering the location of the study area on the Balkan Peninsula, the principal corridor of hu- man migration into Europe, the Lake Prespa paleoarchive offers new insights into past climate change and its potential impacts on hominid populations in the region.
The recent development of core scanning and multi-sensor logging instruments took the paleo- research community by storm overshadowing more laborious techniques, such as palynology.
Despite its undisputable time-efficiency and high-resolution output, it can prove challenging for researches to reconstruct past environmental changes without employing other methods (e.g.
Section 3.1 in Chapter III). Biological proxies offer direct insights into the biotic component and mechanisms governing the rate and nature of ecosystem change through time and space.
Understanding the complexity of biotic processes (e.g. immigration, competition and succes- sion) and the interaction between abiotic and biotic factors (e.g. nutrient cycles) is a prerequisite for reconstructing paleoenvironments and deducing paleoclimate. This thesis profited greatly from the application of a multi-proxy approach and in particular from the close cooperation with my colleagues at the Institute of Geology and in particular with my B2 Project partner, Anne Böhm (Aufgebauer). In addition to palynological analyses (performed at the Institute of Geography by the author), multiple other proxies were investigated in collaboration with other researchers and institutes (Figure 1.1), which are explicitly listed in each chapter.
x-ray fluorescence (2 mm)
CNS elemental analysis (936 samples)
grain size analysis (226 samples)
Rock Eval analysis (180 samples) stable isotope analysis
(76 samples)
palynological analyses (170 samples)
ostracod analysis (39 samples)
- pollen - spores - algae - dinocysts
- microscopic charcoal
SEM photography (1 sample)
Institute of Geology and MineralogyUK Institute of Geography
Figure 1.1: Synopsis of analyses already performed on material from Lake Prespa and included in this thesis. Note that for non-destructive methods sampling intervals are given in mm.
Three hypotheses are tested in the ensuing chapters (Chapter II-VII):
• the potential of the study area to record past changes in abiotic and biotic components of local ecosystems without significant time lags in comparison to other paleoarchives,
• the sensitivity to orbital- and suborbital-scale climate variability,
• and the refugial character of the watershed in terms of fostering mesophilous trees during the Last Glacial.
In addition, this thesis focuses on the following key themes:
• Floristic composition and representation in pollen spectra.
• Spatial vegetation patterns in the landscape through time (e.g. treeline shifts, vegetation belts, landscape openness).
• Species immigration, competition, displacement and succession.
• Occurrence of natural or anthropogenic disturbance (e.g. fire) and resilience of ecosystems.
• Parameters and mechanisms controlling aquatic, littoral and terrestrial ecosystem dynam- ics in response to climate oscillations (e.g. water pH, mixing regime, lake-level change, soil development).
• Human-environment interaction through time (e.g. agriculture, pastoralism, forest clear- ance, potential migration barriers)
Chapter II and III deal with environmental and climatic changes over the last 17,000 years (320 cm) spanning the Last Glacial termination, the Lateglacial transition and the Holocene inter- vals. In specific, Chapter II introduces the chronology, lithology, sedimentology, geochemistry, as well as summary pollen and ostracod data from a new sediment core (Co1215) recovered from Lake Prespa during the 2009 field campaign. Chapter III, presents pollen, phytoplankton, and microscopic charcoal data and discusses vegetation dynamics, fire history and human impact on the landscape. Chapter IV, presents sedimentological, geochemical, isotope, and summary paly- nological data and examines the limnological and environmental response over the last 80,000 years (1575 cm). In Chapter V, after the addition of 2 m obtained during the 2011 field campaign, are presented sedimentological, geochemical and palynological data from the longest sequence to date (1776 cm) spanning the last 92,000 years. Chapter VI, showcases several case studies originating from CRC 806 projects in an effort to bring together the principles of geoscientific, archaeological and socio-cultural anthropological research under the scope of an adaptive cycle model. Chapter VII takes on numerical analyses of the data and shows results that have not been published yet. At last, Chapter VIII synthesizes data presented in previous chapters, evaluates the findings with qualitative and quantitative means, and reconstructs environmental responses (vegetational and limnological) to past climate variability.
1.3 General setting 1.3.1 Study area
The Prespa watershed is shared between Albania, the Former Yugoslav Republic of Macedonia (FYROM) and Greece (Figure 1.2). It comprises two transboundary lakes (Megali and Mikri Prespa), separated by an alluvial isthmus, and is surrounded by mountains rising over 2,000 m.
Together with Lake Ohrid (Albania, FYROM) and the former Lake Maliq (Albania), which was drained after World War II, comprised the Dessarete Lake group (Stanković, 1960). Lake Prespa (Megali Prespa), situated at 849 m a.s.l. has no surface outflow, but is hydrologically connected with underground karst channels (Matzinger et al., 2006; Amataj et al., 2007; Figure 1.5) to Lake Ohrid located at 693 m a.s.l., which eventually drains into the Adriatic sea.
Figure 1.2: Location of study area in southwestern Balkans and topography. Locations and codes of palaeorecords mentioned in the text: Co1215 (this study), Co1216 (Wagner et al., 2012), Co1204 (Leng et al., 2010; Wagner et al., 2010), Co1202 (Vogel et al., 2010a, b; Wagner et al., 2010), JO2004-1 (Belmecheri et al., 2009; Lézine et al., 2010), Lz1120 (Wagner et al., 2009, 2010), and S1/K6 (Denèfle et al., 2000; Bordon et al., 2009). Pollen archives are indicated in red (SRTM Data: Jarvis et al., 2008).
1.3.2 Geology
The Lake Prespa region was uplifted during the Alpine orogeny, while Lake Prespa is a result of subsequent subsidence (Aliaj et al., 2001; Dumurzanov et al., 2005). Consequently, Lake Prespa is deduced to be of Pliocene origin, c. 3.5 million years (Stanković, 1960; Popovska and Bonacci, 2007). The Prespa graben is characterized by active faults running parallel to the N–S direction of the basin (Dumurzanov et al., 2005; Wagner et al., 2012). On the west and south, the Galičica and Mali i Thate mountains comprise intensively karstified triassic limestone, while carbonate rocks (limestone and dolomite) dominate the southern part of the basin as well. Pa- leozoic metamorphic and intrusive rocks (schists, gneisses, granites) outcrop in the northern and eastern part of the basin (Geological Maps of Yugoslavia, 1977; Geological Maps of Albania, 1983; Hydrogeological map of western Macedonia water district (09), 2010). The lowlands of the basin are filled by c. 50–60 m of alluvial Quaternary sediments (Dumurzanov et al., 2005).
1.3.3 Climate
The Prespa catchment lies in a transitional climatic zone where the warm and humid air from the west and south meet the cold and dry air masses from the north. Despite the close proxim- ity to the Adriatic sea, the study area does not feature a typical Mediterranean climate. The Prespa region is situated northeast of the Pindos mountain range, which is responsible along with the prevailing westerlies for the precipitation gradient occurring across the southern tip of the Balkan Peninsula (Figure 1.3 a). The present-day mean annual temperatures for mountain-
Figure 1.3: Mean annual precipitation and temperature (data from WorldClim; Hijmans et al., 2005).
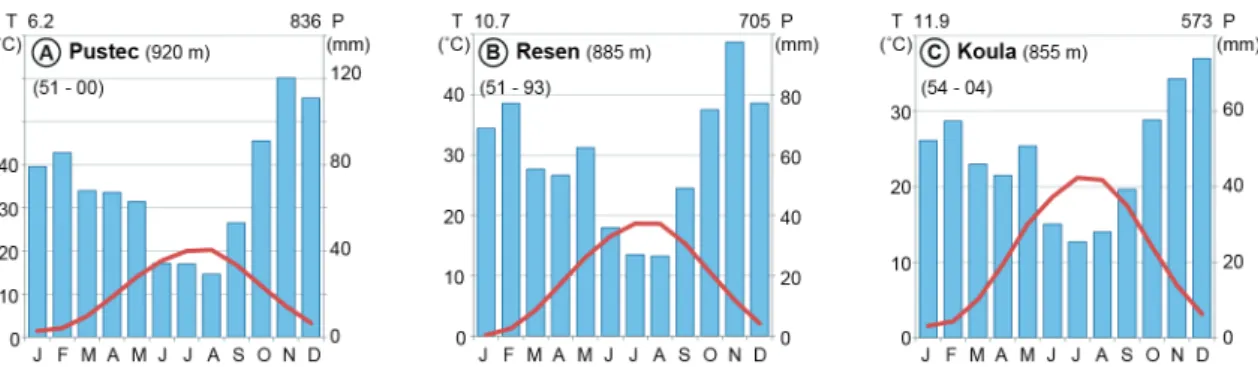
ous areas in this region are below the 10 ˚C (Figure 1.3 b). There are several meteorological stations within the catchment operating since the 1950s (Strubenhoff and Hoyos, 2005) and the ones with the longest record from each country are presented (locations are shown in Figure 1.2; Figure 1.4).
The climate of the area is transitional and can be classified as sub-Mediterranean with continental influences. Mean July and January temperatures in the lowlands are 21˚C and 1˚C respectively, with a mean annual temperature of 11˚C. Precipitation peaks in winter (when snowfalls are frequent) and drops in summer. It varies from 750 mm in the lowlands to over 1,200 mm in the mountains. Owing to the diverse topography, exposure of slopes and valleys, as well as the presence of a large water body a complex patchwork of microclimates occurs in the catchment that is also reflected in the vegetation.
1.3.4 Vegetation
The landscape heterogeneity of the Prespa watershed and its location at a transitional climate zone gave rise to an assemblage of central European, Mediterranean and Balkan endemic plants (Polunin, 1980). With an estimated total of 1,500 plant species (cf. Society for the Protection of Prespa, 2011), the study area contains approximately 6% of the 25,000 plant species encountered in the entire Mediterranean Basin (cf. Myers et al., 2000).
A considerable area of Prespa’s wetlands and adjacent mountain biotopes are protected under international treaties (Ramsar, Natura 2000) as well as national legislation (Table 1.1). In 2000, the prime ministers of the three countries established the transboundary Prespa Park and in 2010 signed an agreement committing to the conservation and sustainable development of the area.
Despite the remote character of the area and early conservation efforts, human impact on Prespa landscapes under protection is still visible today (e.g. treeline depression due to logging or graz- ing). Nevertheless, the diversity of communities and species encompassed in the aquatic, littoral and terrestrial habitats are remarkable with regard to the size of the catchment.
Figure 1.4: Ombrothermic diagrams of selected meteorological stations within the Prespa catchment (data compiled from Strubenhoff and Hoyos, 2005).
Table 1.1: Designated protected areas within the Prespa catchment (data from Society for the Protection of Prespa).
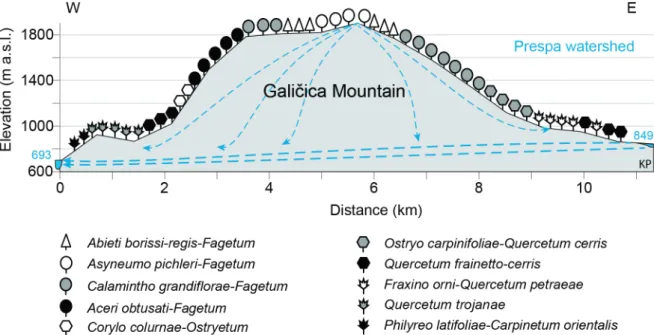
In the lowlands, extensive reed beds, sedge- and grasslands comprising Poaceae (e.g. Phragmites australis), Typhaceae, Cyperaceae, and Juncaceae dominate the littoral zone. Outside of pro- tected areas, the plains are covered with apple tree orchards in the north and bean plantations in the south. Thermophilous species such as Phillyrea latifolia, Fraxinus ornus, Pistacia terebinthus, Juniperus excelsa, J. foetidissima, Buxus semprevirens, Quercus trojana, Carpinus orientalis, Ostrya carpinifolia are encountered at lower elevations mostly on limestone hills in the east and south.
They form transitional communities (pseudomaquis) comprising evergreen and deciduous spe- cies and their distribution depends on factors such as slope exposure and soil moisture content.
Mixed deciduous oak forests (dominated by Q. cerris, Q. frainetto, Q. pubesens, Q. petraea) grow below 1,600 m a.s.l., while montane mesophilous forests (dominated by Fagus sylvatica in asso- ciation with Carpinus betulus, Corylus colurna and Acer obtusatum) below 1,800 m. Beech forests codominated by Abies borisii-regis are encountered below 1,900 m. A characteristic transitional
Country Name Protected Area (km2) Year
Albania Prespa National Park 277 1999
F.Y.R. of Macedonia Galičica National Park 250 1958
F.Y.R. of Macedonia Pelister National Park 125 1948
F.Y.R. of Macedonia Ezerani Reserve 21 1996
Greece Prespa National Park 257(327) 1974(2009)
Figure 1.5: Vegetational transect across the Galičica Mountain and schematic underground connection between Lake Prespa and Lake Ohrid (SRTM Data: Jarvis et al., 2008; adapted after Matevski et al., 2011; Popovoska and Benacci, 2007).
plant community dominating the mountainous landscape in the eastern part is the distinctive climax communities of Pinus peuce, growing up to an altitude of 2,200 m a.s.l., associated with Pteridium aquilinum or Vaccinium myrtillus (at higher elevations). Extensive subalpine and alpine meadows occur above the tree-line (Polunin, 1980; Pavlides 1997; Matevski et al., 2011).
A characteristic vegetational profile from the western part of the catchment as well as typical forest ecosystems are shown in Figure 1.5 and Figure 1.6 respectively.
F E
D C
B A
Figure 1.6: Typical forest ecosystems: Pinus peuce forming the treeline with Vaccinium myrtillus as dominant un- derstory species on Pelister (a, b), Fagus sylvatica with Abies borisii-regis forming the treeline on Galičica (c), pure Fagus sylvatica stand (d), mixed thermophilous oak-dominated forests on the eastern flank of Galičica Mountain near the village of Stenje (e), Quercus cerris stand on Galičica (f). Note the rich herbaceous layer of the oak stand (f) in contrast to the beech one (d). Photos taken during the June 2011 field campaign by the author.
1.3.5 Lake Prespa morphology and hydrology
Lake Prespa is a rather shallow lake (mean depth 14 m) in comparison with Lake Ohrid (mean depth 155 m) despite their similar size (254 km2 and 358 km2 respectively). Lake Mikri Prespa has a lake surface of only 53 km2 and a mean water depth of 4 m (Table 1.2). On the Greek side, the Prespa Lakes are connected by a canal ending at a four-sluice gate system with a total extend of 9 m, which lets excess water to overflow from Lake Mikri Prespa into Lake Prespa (Malakou, 2007; Parisopoulos et al., 2009). In addition, Lake Prespa has an underground connection with Lake Ohrid via karst channels (Matzinger et al., 2006; Amataj et al., 2007; Figure 1.5).
Table 1.2: Characteristics of the Prespa Lakes (compiled from Zacharias et al., 2002 and Matzinger et al., 2006).
Lake (Megali) Prespa Lake Mikri Prespa
Watershed (km2) 1,000 260
Lake surface (km2) 254 53
Volume (km3) 3.6 0.22
Altitude (m a.s.l.) 849 853
Depth max. (m) 55 8.4
Depth mean (m) 14 4.1
Residence time (yrs) 11 3.4
Surface temperature max. (˚C) 25 28
pH mean 8.3 8.3
Mixing mechanism monomictic dimictic
Figure 1.7: Lake-level fluctuations of Lake Prespa (from Strubenhoff and Hoyos, 2005).
In the absence of natural surface outlet, water from Lake Prespa is mostly evaporated (52%), fed through the karst aquifer (46%) to Ohrid springs, and 2% is used for irrigation (Matzinger et al., 2006). Increasing anthropogenic pressure combined with precipitation patterns and the closed nature of the watershed account for the annual lake level change and an estimated residence time of 11 years. The annual high stand occurs in late spring partly due to snowmelt and low stand in autumn and early winter months (Hollis and Stevenson, 1997).
Apart from seasonal fluctuations, lake levels have oscillated historically up to several meters (Figure 1.7). Between 1951 and 1963 the water level of Lake Prespa oscillated around a relatively high level of c. 851 m a.s.l (according to the Albanian record). In 1963 the water level reached its maximum stand of c. 853 m a.s.l. and declined till 1979 when it fell below 849 m a.s.l. Between 1979 and 1987 water levels remained above 849 m a.s.l., and between 1987 and 1994 declined steadily reaching a low of c. 846 m a.s.l. After 2000 lake levels dropped further to reach 844.5 m a.s.l. the lowest stand recorded within the period examined. An average water level drop of approximately 6 m is recorded between 1951 and 2005 (Figure 1.7).
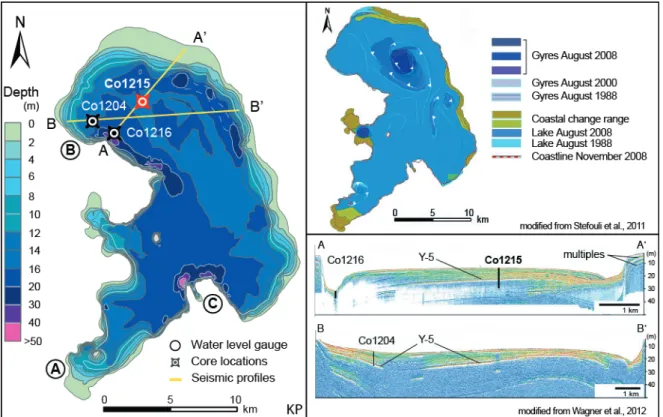
Stefouli et al. (2011) detected in Landsat images for the period 1988–2010 recurring surface circulation patterns in the form of gyre systems (Figure 1.8). Prevailing northern winds during summer months produce counter- and clockwise gyres. Wagner et al. (2012) suggested that surface currents propagating in the water column in concert with geostrophic effects led to the formation of a contourite drift (Figure 1.8).
Figure 1.8: Simplified bathymetry of Lake Prespa (based on unpublished data from Andrinopoulos A. for IAEA Project RER/8/008; Stefouli M., personal communication). Locations of water-level gauges: (a) Liqenas/Pustec, (b) Stenje, (c) Psarades. Surface currents and hydroacoustic profiles are also shown.
1.4 State of research
1.4.1 Core lithology and correlation
Core Co1215 with a composite length of 1776 cm is the longest core from Lake Prespa to date and was retrieved from the northern part of the lake in October/November 2009 and June 2011. The coring location displays relatively undisturbed sedimentation, revealed after a shallow hydroacoustic survey (Wagner et al., 2012; Figure 1.8). In addition to Co1215 (focus of this study), two shorter sediment cores have already been analyzed with means of sedimentology and geochemistry (Table 1.3).
Figure 1.9: Panoramic view of Lake Prespa from the Galičica Mountain. Core locations and landmarks are indi- cated. Core lithology and correlations (adapted after Böhm, 2012; Wagner et al., 2012).
Table 1.3: Cores retrieved from Lake Prespa.
Three lithofacies (L3, L2, L1) occur in Co1215 (described in Böhm, 2012; Damaschke et al., 2013), and have been distinguished based on color, grain-size composition and chemistry (Fig- ure 1.9). Lithofacies 3 (1776–1516 and 204–0 cm) sediments are characterized by olive-brown colored bioturbated silt, relatively high organic matter and calcium carbonate (calcite) and low to intermediate clastic content. Lithofacies 2 (1516–1380, 1066–662, and 292–204 cm) has gray-olive, non-laminated silts with intermediate organic content, and generally low carbonate content but with distinct TIC (calcite and siderite) and Fe spikes. Sporadic occurrence of sand and gravel was recorded in L2. Lithofacies 1 (1380–1066 and 662–292 cm) sediments are gray, bioturbated, dominated by silt and with very low organic content. Conspicuous TIC (siderite) and (Fe) spikes are present between 1380 and 1066 cm, and an irregular black-greenish lamina- tion associated with black spots and high Fe and Mn (between 662 and 292 cm). Coarse sand and gravel were present intermittently throughout L1.
In Co1204 (described in Leng et al., 2010; Wagner et al., 2010, 2012) sediments between 1050–314 cm are gray, have a low TOC and high K content, and were deposited during the Last Glacial. Distinct Mn and Fe peaks are recorded during this interval which indicate shifts in the redox conditions and were correlated with Heinrich events (Wagner et al., 2010). Sedi- ments between 314–0 cm are characterized by a brownish color, higher organic content and were deposited during the Holocene (for radiocarbon ages from Co1204 see Wagner et al., 2012) In Co1216 (described in Wagner et al., 2012) sediments between 577–86 cm have a gray color, low TOC and TIC, high K and several Mn and Fe peaks, while between 86–0 cm are brown, have high organic content and low K. Although no reliable age control points exist for this core, Wagner et al. (2012) proposed the correlation of the uppermost 86 cm to the Holocene and between 577–86 to the Last Glacial. The authors interpreted discontinuities in the sedimenta- tion as the result of erosion and redeposition caused by wave action and fluctuating lake levels.
Core Coordinates Composite
Length (cm) Water
Depth (m) Recovery Date
Co1204 40˚57’02’’ N, 20˚55’54’’ E 1050 14 October 2007
Co1215 40˚57’50’’ N, 20˚58’41” E 1575
(1776) 14.5 October/November 2009
(June 2011)
Co1216 40˚56’22” N, 20˚56’57” E 577 32.3 October 2009